Copyright2000 by the Genetics Society of America
Genotypic Stability, Segregation and Selection in Heteroplasmic Human
Cell Lines Containing np 3243 Mutant mtDNA
Sanna K. Lehtinen,* Nicole Hance,
†Abdellatif El Meziane,*
,‡M. Katariina Juhola,*
K. Martti I. Juhola,
§Ritva Karhu,* Johannes N. Spelbrink,* Ian J. Holt
†and Howard T. Jacobs*
,**
*Institute of Medical Technology and Tampere University Hospital, University of Tampere, 33101 Tampere, Finland,†Department of Molecular and Cellular Pathology, University of Dundee, Dundee DD1 9SY, Scotland,‡Departement de Biologie, Faculte´ des Sciences et Techniques,
Universite´ Cadi-Ayyad, Marrakesh, Morocco,§Department of Computer Science, University of Tampere, 33101 Tampere, Finland and **Institute of Biomedical and Life Sciences, University of Glasgow, Glasgow G12 800, Scotland
Manuscript received December 20, 1998 Accepted for publication September 21, 1999
ABSTRACT
The mitochondrial genotype of heteroplasmic human cell lines containing the pathological np 3243 mtDNA mutation, plus or minus its suppressor at np 12300, has been followed over long periods in culture. Cell lines containing various different proportions of mutant mtDNA remained generally at a consistent, average heteroplasmy value over at least 30 wk of culture in nonselective media and exhibited minimal mitotic segregation, with a segregation number comparable with mtDNA copy number ($1000). Growth in selective medium of cells at 99% np 3243 mutant mtDNA did, however, allow the isolation of clones with lower levels of the mutation, against a background of massive cell death. As a rare event, cell lines exhibited a sudden and dramatic diversification of heteroplasmy levels, accompanied by a shift in the average heteroplasmy level over a short period (,8 wk), indicating selection. One such episode was associated with a gain of chromosome 9. Analysis of respiratory phenotype and mitochondrial genotype of cell clones from such cultures revealed that stable heteroplasmy values were generally reestablished within a few weeks, in a reproducible but clone-specific fashion. This occurred independently of any straightforward phenotypic selection at the individual cell-clone level. Our findings are consistent with several alternate views of mtDNA organization in mammalian cells. One model that is supported by our data is that mtDNA is found in nucleoids containing many copies of the genome, which can themselves be heteroplasmic, and which are faithfully replicated. We interpret diversification and shifts of heteroplasmy level as resulting from a reorganization of such nucleoids, under nuclear genetic control. Abrupt remodel-ing of nucleoids in vivo would have major implications for understandremodel-ing the developmental consequences of heteroplasmy, including mitochondrial disease phenotype and progression.
T
HE technique of cybridization tor0cells that lack grounds (the 143B osteosarcoma and A549 lung carci-endogenous mtDNA has enabled the genetic analy- noma cell lines) has demonstrated clearly the threshold sis of human disease-associated, heteroplasmic mito- effect of the np 3243 mutation on respiratory and bioge-chondrial mutations in a controlled nuclear back- netic function (Chomyn et al. 1992; King et al. 1992;ground (King and Attardi 1989; King et al. 1992). Bentlage andAttardi 1996;Dunbar et al. 1996;El
One mutation intensively studied by this technique is Mezianeet al. 1998a). Below 70% mutant mtDNA cells
the A to G point mutation at np 3243 (Gotoet al. 1990; are apparently normal. Between 70 and 90% mutant
Kobayashiet al. 1990), associated with several distinct mtDNA a mild complex I defect is evident. Above 90% pathological phenotypes (Van den Ouweland et al. mutant mtDNA there is a general impairment of respira-1992;Jean-Francoiset al. 1994;Mariottiet al. 1995), tion, but only at 98% or more mutant mtDNA is there including ocular myopathy, diabetes plus deafness, and a severe drop in mitochondrial protein synthesis. In the MELAS syndrome (mitochondrial encephalopathy lung carcinoma cybrids there is a drop in the steady-with lactic acidosis and stroke-like episodes). The muta- state level of tRNA-leu(UUR) proportionate to mutant tion maps to a conserved residue in the gene for tRNA- load (El Mezianeet al. 1998a), and the mutant tRNA
leu(UUR) and is presumed to impair the metabolism appears to be incapable of being aminoacylated (El
of susceptible tissues by affecting mitochondrial protein Mezianeet al. 1998b), accounting for its effects on
trans-synthesis. lation. Absolute mtDNA copy number also influences
Analysis of cybrid clones in two different nuclear back- the exact phenotype (Bentlage and Attardi 1996), with cells at low copy number crossing these thresholds earliest.
Corresponding author: Howard T. Jacobs, Institute of Medical
Tech-This type of analysis has been made possible by the nology, University of Tampere, P.O. Box 607, 33101 Tampere,
Fin-land. E-mail: [email protected] fact that cybridization results in the establishment of
364 S. K. Lehtinen et al.
cell lines that remain stably heteroplasmic at various posed on this process. We were able to observe several episodes of mitochondrial genotypic instability, result-different levels of mutant mtDNA. However, not all cell
clones arising from cybrid fusions exhibit a stable mito- ing in a concerted and rapid shift of mtDNA genotype. This almost certainly involved selection at the intercel-chondrial genotype. The direction in which unstable
heteroplasmons segregate is dependent on nuclear lular and perhaps also the intracellular level. These ob-servations are consistent with several alternate views of background. In 143B osteosarcoma cybrids,
segrega-tion, if it occurs, is in the direction of an increasing mtDNA organization within mammalian cells, but lead us to propose a model in which faithfully replicated level of mutant mtDNA (Yonedaet al. 1992;Dunbaret
al. 1995;BentlageandAttardi1996). Conversely, in mitochondrial nucleoids are the unit of segregation, allowing the maintenance of stable, long-term hetero-A549 lung carcinoma cells, the exact opposite is
ob-served, with unstable heteroplasmons showing progres- plasmy with very high apparent segregation numbers. The nucleoid model can also account for shifts in geno-sive loss of mutant (Dunbaret al. 1995). However, in
both backgrounds the wide range of heteroplasmy val- type if nucleoids are subject to transient destabiliza-tion, leading to an intracellular diversification of the ues over which cybrid cell lines can remain stable for
years indicates an effective absence of selection (Mat- mitochondrial genotype on which selection can act. We furthermore provide evidence that a nuclear genetic
thewset al. 1995;Shoubridge1995). During cell
cul-ture 50,000–100,000 cells are typically sampled at each change, namely a gain of chromosome 9, is associated with one such episode that we have documented. passage. Under these conditions, sampling error is
ex-tremely small, which accounts for the absence of signifi- The frequency with which such events occur in vivo in different tissues could have major implications for cant drift in heteroplasmy values. A stable average
het-eroplasmy level could nevertheless mask diversification the developmental evolution of heteroplasmy and for mitochondrial disease phenotype and progression. The of mtDNA genotype by random mitotic segregation, as
observed, for example, in the germ line of artificially nuclear genome may have an important role in the induction of such events.
heteroplasmic mice (Jenuth et al. 1996) and also in
humans (Marchingtonet al. 1997). Earlier studies of
143B osteosarcoma cybrids heteroplasmic for the np
MATERIALS AND METHODS 3243 mutation were consistent with such segregation
(Shoubridge1995).
Computer modeling of mitotic segregation: Predicted
Evidence that selection and/or drift are nevertheless changes with time in the distribution of mtDNA heteroplasmy possible in long-term cell culture comes from the obser- values in the cell populations studied in the laboratory were derived using a customized computer program (available from vation that new mtDNA mutations can arise and become
K. M. I. Juhola). The program was based on a simple mathe-fixed. As regards the np 3243 mutation, probably the
matical model (see appendixand results) modified from clearest example is the np 12300 suppressor mutation
that used byHoppensteadtandPeskin(1991) to predict the in the anticodon of tRNA-leu(CUN), which was discov- segregation of plasmids in bacteria.
ered in a subculture of lung carcinoma cybrids carrying Cells and cell culture:A549 lung carcinoma cybrids con-taining different proportions of np 3243 and np 12300 mutant 99% np 3243 mutant mtDNA (El Mezianeet al. 1998a).
mtDNAs have been described previously (Dunbaret al. 1995; Such cells, carrying the np 12300 mutation at the 11%
El Meziane et al. 1998a). Except where stated, cells were level, are phenotypically restored to apparently
wild-routinely maintained in Dulbecco’s modified Eagle’s medium, type levels of respiration, mitochondrial protein synthe- supplemented with 150 mg/ml uridine plus 10% fetal calf sis, and membrane assembly. The suppressor mutation serum, with weekly passaging. Cell cloning at limiting dilution is predicted to create a novel tRNA capable of decoding was carried out in 96-well plates. For testing in Gal medium, glucose in the medium was replaced by galactose at 0.9 mg/ the codon group for which tRNA function is otherwise
ml, with omission of the uridine supplement. For testing the absent, due to the pathological mutation.
effects of dimethyl sulfoxide (DMSO), cells were cultured In an effort to determine the limits and parameters prior to cloning either for 1 wk in normal medium containing of mitotic segregation and to document episodes of 0.2% DMSO, or for 2 hr in 1% DMSO, followed by a week in selection and/or drift associated with transient instabil- normal medium.
Oxygen consumption:Whole-cell oxygen consumption was
ity of mitochondrial genotype, we carried out a
long-measured as described previously (Dunbaret al. 1996). term study of a panel of stably heteroplasmic lung
carci-DNA extraction:For PCR-based mitochondrial genotyping,
noma cybrids maintained in continuous culture. This
DNA was extracted from cultured cells as described byReidet study included cell lines carrying the np 3243 mutation al. (1994, 1997). For Southern blot analyses of relative mtDNA at various levels as well as the subline carrying also the copy number, EcoRI-digested genomic DNA was prepared from cells as follows. One confluent 10-ml plate (z53 106 np 12300 suppressor mutation. The results are
consis-cells) was trypsinized, and cells were recovered by centrifuga-tent with a norm of mitotic segregation, but with a high
tion for 3 min at 20003gmax. Cell pellets were resuspended segregation number, much higher than the 200 inferred
in 50ml of water, 5 ml of 10 mg/ml boiled RNase A were for the mouse germ line (Jenuthet al. 1996), and com- added, and samples were incubated for 30 min at 378. After
superim-pH 5.5, incubation was continued overnight at 568. Crude as described previously (Kallioniemiet al. 1994;Karhuet al. 1997).
DNA was precipitated by the addition of 800ml of ice-cold isopropanol, and samples were stored at 48 before further processing. Crude DNA was recovered by centrifugation for
30 min at 70003 gmax, and pellets, washed twice with 70% RESULTS
ethanol, were digested three times successively with EcoRI as
follows. Pellets were resuspended by the successive addition Mitotic segregation with high segregation number is of 89ml of water, 10ml of 103EcoRI digestion buffer (New the norm for stable np 3243 heteroplasmons:The geno-England Biolabs, Beverly, MA), and 1ml of EcoRI (20 units/
types of three stable cybrid cell lines, heteroplasmic for ml; New England Biolabs), and were incubated overnight at
the np 3243 mutation (A3243G) at different levels, were 378. In the first digestion cycle an additional 1ml of the enzyme
was added after 5 hr. Samples were then phenol-chloroform followed over a.30-wk period of continuous culture. extracted without vortexing, centrifuged at 7000 3 gmax to The np 3243 genotype of the bulk culture and of individ-separate phases, and ethanol precipitated. The thrice-digested ual clones obtained at limiting dilution was determined DNA was finally resuspended in 30ml of water.
by ApaI site restriction fragment length polymorphism
Mitochondrial genotyping by last hot-cycle PCR: The
(RFLP) analysis of PCR products radiolabeled during amount of heteroplasmy for the A3243G and G12300A
muta-tions was measured in DNA samples extracted from cells using the last synthesis cycle. Up to eight replicate measure-the materials and methods described in El Meziane et al. ments were performed on each DNA sample, enabling (1998a). Briefly, the regions around the mutation sites were reliable estimates of the amount of mutant mtDNA PCR amplified using mtDNA-specific primer pairs, with
addi-generally to within 1%. The bulk cultures of all three tion of [a-32P]dCTP in the last synthesis cycle. Labeled PCR
cell lines, maintained by weekly passaging of a mini-products were then digested with the restriction enzymes
diag-nostic for the site polymorphisms created by the mutations mum of 50,000 cells in uridine-supplemented medium, (ApaI and AflII, respectively), and products of replicate diges- remained throughout the experiment at their initial tions were analyzed by polyacrylamide gel electrophoresis and heteroplasmy levels of 85% (line Y), 95% (line X), and phosphorimaging.
99% (line G), indicating an absence of selection.
Mitochondrial staining: Cells were grown to high density
Because of the large number of cells sampled at each on 60-mm plates, washed with phosphate-buffered saline
passage, the genotypic stability of the bulk cultures (PBS), and then stained for 15 min at 378in 1 ml of serum-free
Optimem medium (GIBCO, Grand Island, NY) containing 10 could mask a considerable degree of mtDNA segrega-mg/ml JC-1 (5,59,6,69-tetrachloro-1,19,3,39-tetraethylbenzimi- tion, as predicted by a random partition model and as dazolylcarbocyanine iodide; Molecular Probes, Eugene, OR).
observed previously in osteosarcoma cybrids with the The cells were washed twice with Optimem, then twice with
same mutation (Matthews et al. 1995; Shoubridge
PBS, mounted in PBS containing 5% sucrose, and examined
1995). A set of$20 individual cell clones, derived from within 20 min under highest magnification on an Olympus
BX-50 fluorescence microscope, using a U-MWB filter. each of lines X and Y after.30 wk of continuous culture,
Southern blot hybridization: To estimate relative mtDNA were therefore analyzed, revealing in both cases a
nar-copy number, DNA prepared as above was fractionated on a row distribution of genotypes (Figure 1, Table 1). The 0.7% agarose gel, capillary blotted under standard conditions
mean heteroplasmy value for each set of clones was to MagnaCharge nylon membrane (Micron Separation Inc.,
similar to that of the corresponding bulk culture, al-Westborough, MA) and UV linked. Blots were hybridized
over-night at 658in 1 mmEDTA, 7% SDS, 0.5msodium phosphate though slightly lower in each case, possibly indicating buffer pH 7.2 (ChurchandGilbert1984) with radiolabeled the loss of a few clones that would have been homoplas-probes for human mtDNA (a PCR product derived from a mic or very high mutant.
cloned segment of the COXII gene) and rDNA, as described
We compared the findings with the predictions of a bySpelbrinket al. (1997). The rDNA probe was a PCR product
random partition model (seeappendix;K. M. I. Juhola,
for the first 500 bp of the 18S rRNA gene, obtained by
amplifi-M. K. JuholaandH. T. Jacobs, unpublished results), cation from genomic DNA of a control A549 cybrid (line
B) using primers 18S-F (TACCTGGTTGATCCTGCCAG) and in which it is assumed that each mtDNA molecule is 18S-R (TCGGGAGTGGGTAATTTGC). Amplification condi- replicated exactly once per cell cycle, that precisely 50% tions were as for mtDNA genotyping (El Mezianeet al. 1998a),
of the molecules are partitioned at random to each and probe fragments were purified using the QIAquick PCR
daughter at cell division, and that the fitness of cells of purification kit (QIAGEN, Chatsworth, CA) and labeled using
all possible mitochondrial genotypes is equal. Deviations the Oligolabeling kit (Pharmacia Biotech, Uppsala, Sweden)
in the presence of [a-32P]dCTP (Amersham; 3000 Ci/mmol).
from these assumptions in practice will tend to result After hybridization, filters were washed successively for 20 min in a greater or faster segregation toward homoplasmy each at 658in 33SSC, 0.1% SDS and 0.33 SSC, 0.1% SDS than predicted by the model. We modeled outcomes and then analyzed by autoradiography and quantitated using
based on several different numbers of independently a PhosphorImager SI (Molecular Dynamics, Uppsala, Sweden)
segregating units: the 200 inferred for the mouse germ with Image-Quant software.
Comparative genomic hybridization: DNA (proteinase line byJenuthet al. (1996), a lower number (100), and
K-extracted, stored frozen) was RNase treated and then depro- a higher number (1000), which approaches the copy teinized by a standard phenol-chloroform extraction. Aliquots number of mtDNA in typical somatic cells. For both of DNA (4mg) were nick translated in the presence of either
line Y and line X the distribution of heteroplasmy levels, TexasRed-6-dUTP or FITCH-12-dUTP (DuPont, Wilmington,
presented in bar chart form in Figure 1, was far from DE) to provide the respective samples for comparison.
Ho-366 S. K. Lehtinen et al.
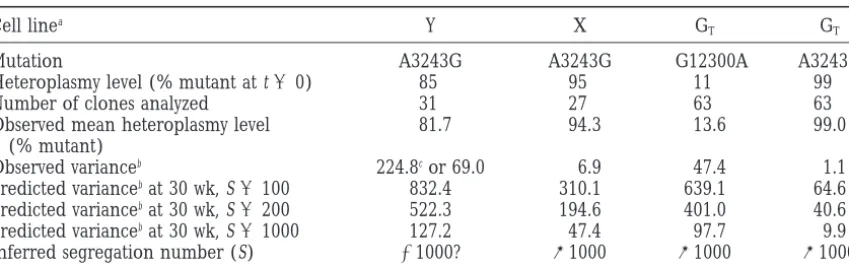
TABLE 1
Actual and predicted distributions of heteroplasmy levels in cybrid cell lines
Cell linea Y X GT GT
Mutation A3243G A3243G G12300A A3243G
Heteroplasmy level (% mutant at t50) 85 95 11 99
Number of clones analyzed 31 27 63 63
Observed mean heteroplasmy level 81.7 94.3 13.6 99.0
(% mutant)
Observed varianceb 224.8cor 69.0 6.9 47.4 1.1
Predicted variancebat 30 wk, S5100 832.4 310.1 639.1 64.6
Predicted variancebat 30 wk, S5200 522.3 194.6 401.0 40.6
Predicted variancebat 30 wk, S51000 127.2 47.4 97.7 9.9
Inferred segregation number (S) .1000? @1000 @1000 @1000
aThis excludes cell line G (99% mutant for np 3243 at t50, 0% mutant for np 12300 at t50), because low cloning efficiency for this line meant that we were unable to obtain meaningful data on the distribution of genotypes in individual cells of the population.
bVariance of the percentage heteroplasmy for mutant mtDNA, corrected to one decimal place.
cMost of the calculated variance (224.8) is here contributed by a single outlier clone at 12% mutant. If this clone is not considered, the variance reduces to 69.0.
moplasmic cells were completely absent, despite the fact (3–8%) of mtDNA also wild type at np 3243, and it is possible that some of them represent cells in which that they are predicted by random partition to be a
major fraction of cells at 30 wk. Even if the absence of the suppressor was never present, because line GT was originally obtained without cloning. Cells lacking the homoplasmic mutant cells is discounted as being due to
negative selection, the overall distributions of genotype suppressor but still retaining 99% or more np 3243 mutant mtDNA would presumably have cloned only at were much narrower than predicted for a model based
on 100 or 200 segregating units and are consistent with very low efficiency, as was the case for line G, and this is probably reflected in the slightly higher average heter-segregation numbers of 1000 or more (compare, for
example, the actual and predicted variances as shown oplasmy level of the clones for the np 12300 mutation (13.6%) than of the bulk culture grown in parallel. in Table 1).
In bulk culture, line G grew at the same rate as the Intercellular selection can shift the mean genotype of np 3243 heteroplasmons: Mitotic segregation from other cell lines, but its cloning efficiency was very low,
hence an insufficient number of clones could be ob- line G is predicted to result in the continuous genera-tion of a small number of cells at heteroplasmy values tained to enable a statistically meaningful analysis.
How-ever, we were able to measure the genotype of .20 ,99%. These would presumably have a growth advan-tage under conditions selective for respiratory function. clones of line GT, a derivative of line G heteroplasmic
also for the np 12300 suppressor mutation (G12300A), The fact that long-term culture of line G did not show any shift in average genotype toward lower heteroplasmy which also retains the np 3243 mutation at the same
level as line G (99%). A culture of line GT, containing values for the np 3243 mutation indicates that during culture in standard medium, either with or without uri-11% np 12300 mutant mtDNA, was maintained over 30
wk, at the end of which clones were obtained at limiting dine supplementation, no such selection is normally operating. To test whether such selection can be im-dilution and genotyped at both np 3243 and 12300.
Genotyping at np 12300 employed the AflII site poly- posed, revealing the presence of cells at lower hetero-plasmy values in the bulk culture, we grew G cells in morphism created by the mutation. The results (Figure
2, a–c; Table 1) showed that the distribution of geno- Gal medium, in which glucose is replaced by galactose. The rate of metabolization of galactose via glycolysis is types was again narrow, at both sites. A small number
of clones (9 out of the 63 analyzed) were derived and believed to be insufficient to maintain ATP levels in cells that cannot also use respiratory pathways to make grown in the absence of the usual uridine supplement in
the medium, but the distribution of their heteroplasmy ATP. Gal medium is therefore a standard selection sys-tem, used to distinguish cells on the basis of their ca-values was similar to that of the other 54 clones analyzed;
hence the results from all 63 clones are pooled in Figure pacity for oxidative phosphorylation (Whitfield et al.
1981). As observed previously, G cells cultured in Gal 2 and Table 1.
The implied segregation number, assuming random medium for 72 hr undergo cell death (El Mezianeet al. 1998a). However, a small number of surviving clones
partition, was once again clearly in excess of 1000. The
few clones obtained that were homoplasmic wild type can be recovered from such cultures.
368 S. K. Lehtinen et al.
Figure2.—Heteroplasmy profiles at np 12300 of line GTand of subculture GTS. (a) The observed distribution for line GT, based on analysis of mtDNA genotypes of 63 individual cell clones obtained after 30 wk of growth in culture. Frequency bars are plotted as in Figure 1. The percentage of suppressor mutant mtDNA of the bulk culture, as well as the mean of the clones analyzed, is shown by arrows. (b and c) The predicted heteroplasmy distributions for line GTafter 30 wk of culture under the conditions stated in theappendix, based on segregation numbers (S) of 200 and 1000, respectively. Hatched bars in b show the predicted distribution that would result if homoplasmic wild-type clones (i.e., lacking the suppressor) are excluded from consider-ation, on the basis of the fact that they are also close to 100% mutant at np 3243. (d) The heteroplasmy distribution for subculture GTS, based on analysis of mtDNA genotypes of 33 individual cell clones from the culture. Twenty-one such clones were obtained immediately at the time the shift to the new average heteroplasmy level of 29% suppressor mutant was noted, and their distribution is represented by the filled portions of the frequency bars. The remaining 12 clones, whose distribution is represented by the shaded portions of the frequency bars, were obtained from the GTSculture 2 mon later. The percentage of suppressor mutant mtDNA of the bulk culture, as well as the mean of the clones analyzed, is shown by arrows.
cells to Gal medium when they were 80% confluent and generally accepted threshold of 98% for severe impair-ment of mitochondrial protein synthesis, consistent with cultured them for 4 days. Surviving cells were allowed
to recover in glucose-containing medium for 8 days and the idea that a small number of respiration-competent cells, arising in the bulk culture by mitotic segregation then recultured for 4 days in Gal medium. At this point
.80 colonies were visible, of which 48 were subcultured as inferred above, were selected by growth under these conditions.
in 24-well plates for 2 final days in glucose-containing
medium. DNA was prepared from 34 surviving clones Rapid, concerted shifts in mtDNA genotype occur as a rare event in np 3243 cybrids:The above experiment and genotyped at np 3243. As shown in Figure 3a, the
proportion of mutant mtDNA was uniformly lower than represents the deliberate selection of a small proportion of cells against a background of massive cell death. Line that of the bulk culture of line G that had been grown
continuously in glucose-containing medium (99.4 6 G has otherwise been grown continuously in the labora-tory for periods of up to 1 year without any perceptible 0.2% mutant, genotyped alongside these clones) and
ranged from 87.5 to 97.2% mutant mtDNA. The mean change in genotype or phenotype. On several occasions, however, we have observed an abrupt shift in genotype heteroplasmy value for the 34 clones was 93.2%, with a
standard deviation of 2.4%. Replicate measurements for of subcultures of line G, grown continuously in glucose-containing medium and without any apparent cell individual clones were generally within 0.5% of each
that were therefore lost from the analysis. The 5 clones of subculture G6Sthat were analyzed also had hetero-plasmy levels narrowly distributed about the mean of the bulk culture (data not shown).
The events that gave rise to the shifts of genotype in subcultures G5S and G6S presumably involve a mecha-nism of selection similar to that inferred previously to be operating in unstable heteroplasmic cybrids (Dunbaret al. 1995). One possible explanation for the behavior of
these cultures is that the limitations on mitotic segrega-tion were transiently relaxed, leading to the rapid emer-gence of truly homoplasmic mutant cells and of many cells with significantly lower levels of mutant, upon which selection acted progressively to shift the average genotype. The kinetics of these events are also not fixed, in the sense that the duration and “genotypic end point” of such shifts can vary. In a further such subculture of line G, shifting continued progressively over a period of several months and resulted in the eventual complete loss of mutant mtDNA, as was observed previously in cybrid clones that were unstable from the time they were established (Dunbaret al. 1995).
Concerted shifts in mtDNA genotype are associated with transient diversification of genotype, followed by reestablishment of stable heteroplasmy, in np 3243 cy-brids:Finally, we obtained a subculture of line GT (desig-nated GTS) that underwent a shift at some point within an 8-wk period, from 11 toz29% mutant at np 12300, while remaining 99% mutant at np 3243. Thereafter, the bulk culture has remained stable for 10 mon at the
Figure3.—Changes in genotype of line G under selection
new heteroplasmy value. Twenty-one individual clones and as a result of a spontaneous shift. Genotype at np 3243
(percentage mutant mtDNA) of (a) 34 cell clones obtained obtained at limiting dilution at an early stage in the from line G, selected by growth in Gal medium. Arrows show culture following the shift in average heteroplasmy level the mean of the distribution (93.2%) and the value for the exhibited a wide variety of genotypes (Figure 2d), when bulk culture of line G grown continuously, in parallel, in
analyzed 2 wk after cloning. These ranged from 6 to glucose-containing medium (b) Twenty-two cell clones
ob-87% mutant at np 12300. A further 12 clones, derived tained from subculture G5S, which had undergone a
spontane-ous shift to a new mean heteroplasmy level of 92% that was 2 mon later from the shifted cells, showed a slightly noted 30 wk before cloning. Arrows show the genotype of the narrower distribution of heteroplasmy values (Figure bulk culture of G5Sand the mean heteroplasmy levels of the 2d), but still wider than in any sampling of the stable clones analyzed. Frequency bars are plotted as in Figures 1
lines. and 2.
All clones obtained at the early time point from the GTSculture were grown for a further 12 wk and regeno-typed (Figure 4a), revealing that while about half had parameter. In two such subcultures, designated G5Sand
G6S, the average genotype shifted toward increased levels remained stable within the accuracy of measurement (estimated at62% for the np 12300 mutation), many of wild-type mtDNA over at most a few weeks, with the
average heteroplasmy value restabilizing in these cul- had continued to shift to new heteroplasmy values both lower and higher than those originally measured 2 wk tures at 92 and 89% mutant, respectively. The cultures
were grown continuously for a further period of at least after cloning. In addition, 6 clones had apparently be-come homoplasmic for the np 3243 mutation, within 28 wk, cloned at limiting dilution, and genotyped. The
heteroplasmy values of 22 clones obtained from subcul- the detection limits (,1 copy per cell). Aliquots of each clone had been frozen 2 wk after cloning, and these ture G5S(Figure 3b) were now once again narrowly
dis-tributed, with an overall diversity similar to that of other were now recovered from the freezer and genotyped again at various times during growth over 3 mon, to lines exhibiting mitotic segregation with high
segrega-tion number. The mean heteroplasmy value of the determine whether the continuing shifts in genotype at np 12300 observed in the first experiment were random clones (90.6%) was slightly less than that of the bulk
370 S. K. Lehtinen et al.
Figure4.—Temporal changes in heteroplasmy in GTSclones. (a) The percentage of np 12300 mutant mtDNA was measured in each clone at 2 and 14 wk after cloning, and the values obtained at the two time points are plotted against each other. Solid circles represent clones that remained at an unchanged heteroplasmy level, within the limits of accuracy of measurement (62% np 12300 mutant). Open circles represent clones whose heteroplasmy levels were significantly different at the two time points. The dotted line represents the diagonal on which unchanged clones should lie. (b) The change in percentage heteroplasmy of each clone was compared in two separate experiments: (1) after 14 wk of growth since cloning and (2) in a second period of growth for a total of 15 wk since cloning, after having been frozen down at 2 wk postcloning. Solid circles represent clones whose direction of change, if any, was the same in the two experiments. Open circles represent clones that shifted in opposite directions in the two experiments. The dotted lines represent the diagonal along which clones exhibiting perfectly correlated behavior should lie and demarcate the quadrants of positive and negative correlation. (c) Measurements of heteroplasmy values (percentage np 12300 mutant mtDNA) for six individual clones, over time. Solid circles, first experiment over 14 wk; open circles, second experiment over a total of 15 wk since cloning.
correlation between the change in heteroplasmy level Reestablishment of stable heteroplasmy values is in-dependent of obvious phenotypic selection: The fact over 3 mon observed for each of 20 GTSclones in the
first experiment and the change exhibited over the same that the change in genotype of each clone of the shifted GTSsubculture was reproducible suggests that the rees-time period by the same clone during the second
experi-ment. In other words, clones that remained stable the tablishment of stable heteroplasmy values involved intra-or intercellular selection. The simplest hypothesis is that first time generally did so again, and those that showed
increases or decreases in the amount of suppressor mu- this was driven by respiratory constraints, favoring the growth of actively respiring cells. We therefore mea-tant mtDNA over 3 mon did so a second time, generally
to a very similar extent. Only 1 of the 20 clones behaved sured the oxygen consumption of each GTSclone, both at the earliest time point from which we had sufficient differently in the second experiment, namely clone
GTS-20, which was stable the first time at 25% mutant, but cells to carry out the assay (3 wk postcloning) and at 15 wk of growth, when heteroplasmy levels had generally in the second experiment declined progressively to 9%
mutant. restabilized.
The results, depicted in Figure 5, do not support the The kinetics with which these clones shifted to new
heteroplasmy values differed, but in general, the values view that the shifts observed in individual clones were due to respiratory selection. Furthermore, they indicate reached within 7 wk changed little thereafter. Some
examples of the behavior of individual clones showing that the relationship between respiratory phenotype and mitochondrial genotype at np 12300 is complex. up- or downshifts, or that remained stable, are shown
in Figure 4c. The extent or direction of change was not Although overall heteroplasmy level for np 12300 is clearly not the sole predictor of respiratory phenotype related in a simple way to the starting proportion of
mutant. For example, clones GTS-12, GTS-13, and GTS-19 in these cells, a general pattern is evident, wherein clones with rather extreme heteroplasmy levels (,10 or all had z50% mutant mtDNA at 2 wk yet after 3 mon
showed, respectively, a modest decrease, a large de- .70%) were the worst respirers. Oxygen consumption values for these clones were in the same range as the crease, and a significant increase in the amount of
Figure5.—Relationship of changes in heteroplasmy for the np 12300 suppressor mutation to respiratory activity. Oxygen consumption was determined for each GTSclone studied, at 3 and 15 wk after cloning, and plotted against heteroplasmy level (percentage of mutant at np 12300) at the two time points. Solid circles represent values measured at 3 wk, open circles represent those measured at 15 wk. Solid lines join the
two values for each given clone, to indicate the extent and Figure6.—Cellular distribution of mitochondria and mito-direction of change of both variables over time. chondrial redox activity, by fluorescence microscopy of JC-1 stained cells. Top, a cell from clone GTS-8, which is typical of all the cell lines and clones analyzed except for line G, shown at the bottom.
generally in the range of 20–30% heteroplasmy for np 12300, and many clones appeared to converge into this zone during growth, with concomitant improvement in
shifting in mtDNA genotype, contained threadlike mito-respiration. Nevertheless, a number of clones clearly
chondria, with many intracellular foci of intense orange-shifted in the opposite direction: away from optimal
yellow staining indicative of high membrane potential. heteroplasmy, and with accompanying phenotypic
“de-The mitochondrial network extended over the entire terioration.” The overall conclusion is that the shifts in
cell, but its exact intracellular distribution varied be-mitochondrial genotype that we observed during
resta-tween cells of a given culture. Lines with different het-bilization are not obligatorily associated with selection
eroplasmy values, with or without the np 12300 sup-driven by respiratory constraints, but are instead
attrib-pressor, whether genotypically stable or shifting, and utable, at least in part, either to drift or else to some
regardless of oxygen consumption values, all showed other kind of selection that we have not identified. The
this typical pattern. Line G gave a completely different notion of drift seems incompatible with the
reproduc-pattern, with diffuse green staining and only a few yellow ible behavior of these clones and with the general
nar-spots indicating high redox activity. We interpret this rowing of the distribution of heteroplasmy values with
as a feature of the np 3243 mutant phenotype not rele-time: however, in thediscussionwe present a
hypothe-vant to the stability of heteroplasmy as such. A very low sis to reconcile these ideas.
proportion of cells of line G (estimated at ,0.1% of
Shifts in mitochondrial genotype are not correlated
the total) gave a normal mitochondrial staining pattern.
with mitochondrial morphology or copy number: We
These cells are probably equivalent to those selected next considered two other simple hypotheses to account
by growth in Gal medium, which had higher levels of for transient instability of mitochondrial genotype:
alter-mtDNA wild type at np 3243. ations in the morphology or intracellular distribution
Relative mtDNA copy number was estimated by South-of mitochondria and differences in mtDNA copy
num-ern cohybridization, using probes for mtDNA and nu-ber. In both cases we examined the stable heteroplasmic
clear rDNA (illustrated in Figure 7). The relative signals lines X, Y, G, and GT, plus all of the clones from the
for nuclear and mitochondrial DNA were arbitrarily GTSsubculture, some of which were still shifting in
geno-normalized to those for one of the clones (GTS-8). Repli-type at the time of the experiment. Mitochondrial
mor-cate measurements were made on each clone at 11 and phology was analyzed by staining of cells with the
mito-15 wk of growth, giving small differences (generally chondrial membrane potential-sensitive dye JC1 (Figure
within 50%) that may reflect growth state or inherent 6). This revealed an identical pattern of staining in all
limitations in the accuracy of the method, rather than cell lines, with the sole exception of the
respiration-real differences in copy number. To improve accuracy deficient line G (99% mutant at np 3243). All of the
com-372 S. K. Lehtinen et al.
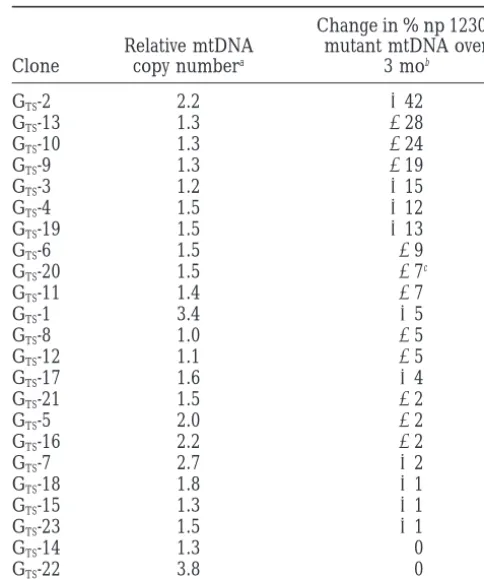
TABLE 2
Relationship between mtDNA copy number and
stability of heteroplasmy in GTSclones
Change in % np 12300 Relative mtDNA mutant mtDNA over
Clone copy numbera 3 mob
Figure7.—Example of mitochondrial DNA copy number
estimation in GTSclones. Genomic DNA digested with EcoRI GTS-2 2.2 142
(seematerials and methods) was fractionated by 0.7% aga- GTS-13 1.3 228
rose gel electrophoresis and Southern blots were cohybridized GTS-10 1.3 224
with probes for human mtDNA (COXII region) and rDNA GTS-9 1.3 219
(59end of 18S rRNA). The autoradiograph shows the signals GTS-3 1.2 115
obtained from a panel of GTSclones at 15 wk of growth after GTS-4 1.5 112
cloning. For estimating the values quoted in Table 2, phos- GTS-19 1.5 113
phorimager signals from a series of such blots on DNA samples GTS-6 1.5 29
extracted at both 11 and 15 wk were used to derive ratios of GTS-20 1.5 27c
mtDNA/rDNA hybridization that were then arbitrarily nor- GTS-11 1.4 27
malized to the value obtained for clone GTS-8. The fragments
GTS-1 3.4 15
detected are as predicted from the relevant database entries
GTS-8 1.0 25
for mtDNA (GenBank accession no. J01415) and rDNA
(Gen-GTS-12 1.1 25
Bank accession no. U13369).
GTS-17 1.6 14
GTS-21 1.5 22
GTS-5 2.0 22
pared with the shift in heteroplasmy over 3 mon for GTS-16 2.2 22 each clone (the value taken was the average hetero- GTS-7 2.7 12
GTS-18 1.8 11
plasmy shift that occurred for each clone, in the two
GTS-15 1.3 11
experiments depicted in Figure 4b). The relative copy
GTS-23 1.5 11
numbers were all within a fourfold range, and generally
GTS-14 1.3 0
much closer. No correlation was obtained between GTS-22 3.8 0
mtDNA copy number and any of the parameters
investi-aAverage of measurements made at 11 and 15 wk of culture, gated (average heteroplasmy level, stability vs.
instabil-normalized arbitrarily to value for clone GTS-8. See text. ity, rate of restabilization, or oxygen consumption). The
bAverage heteroplasmy shift of the two experiments de-analysis is illustrated in Table 2, in which the clones picted in Figure 4b, clones rank ordered according to the are rank ordered according to the amount of shift in magnitude of the changes observed.
heteroplasmy that was measured over 3 mon. Clones cClone GTS-20 behaved differently in the two experiments, showing almost no change in heteroplasmy in the first case that exhibited genotypic instability included those with
(11%), but a progressive decline during the second experi-both higher and lower relative copy numbers. The
ment (215%), when copy number was also measured. clones showing the greatest disparity in copy number
measurements at 11 and 15 wk (5, 7, and
GTS-22) were also among the most stable clones genotypi- posed earlier on the GT culture that shifted, as well as cally. We conclude that shifts in mtDNA genotype can at a higher dose for a shorter time (seematerials and
take place without significant alterations in mtDNA copy methods). The results, summarized in Table 3, show number. We cannot, however, exclude the possibility clearly that low-level DMSO treatment did not induce that a transient change in copy number occurred at the any systematic shift or diversification of heteroplasmy time of the original event that led to mitotic segregation levels in these cultures, despite the minor differences in the GTS culture, although copy number measure- observed. Specifically, clone GTS-52 showed a modest ments in the bulk cultures revealed no major differences increase in variance after treatment, but no change in between GT, GTS, and other cybrids studied. mean heteroplasmy, while clone GTS-53 showed a minor
Cytoskeletal disaggregation by DMSO treatment does change in average heteroplasmy level but no systematic
not induce systematic mtDNA segregation:Cells of line increase in variance. These variations are almost cer-GT that underwent the dramatic diversification in het- tainly attributable to the small number of subclones eroplasmy level had been subjected to very low levels analyzed. Moreover, in those cases where variance in-of the cytoskeleton-altering drug DMSO (Nishidaet al. creased, the increases were quantitatively minor com-1987), subsequent to an aliquot of the cells being frozen pared with those that occurred during the dramatic shift down in a DMSO-containing medium at passage. To of line GTS.
test whether such exposure to this drug could account Shifts in mtDNA genotype can be associated with a
im-TABLE 3
Effects of DMSO on mtDNA heteroplasmy levels
Clone GTS-52 Clone GTS-53
Treatment meana Varianceb Meana Varianceb
None 36.5 (n510) 32.3 42.9 (n510) 64.1
0.2% DMSO, 1 wk 34.9 (n512) 49.7 53.0 (n58) 120.8
1% DMSO, 2 hr 34.8 (n512) 81.6 48.3 (n512) 32.3
aMean percentage heteroplasmy for np 12300 mutation (n5number of subclones analyzed). bVariance of the percentage heteroplasmy for np 12300 mutation.
genetic change. To test this idea, we carried out CGH cells is generally in the range 103–104, comparable with the segregation numbers of..1000 we inferred here. on DNA samples from paired cell lines before and after
such episodes. DNA from line G (.99% np 3243 mu- Extant culture records do not allow us to estimate the total time during which each of these lines was grown tant) was compared with its derivative G5S, which had
shifted to 92% mutant, revealing no detectable differ- since its original cloning, which in most cases is certainly far longer than 30 wk. Therefore, this segregation num-ences. CGH can detect chromosomal deletions or
ampli-fications down to the 1 Mb level, but obviously this ber we have observed in tumor-derived cell lines must be regarded as a minimum. In principle we can suggest negative result does not exclude point mutations or
smaller scale aberrations. By contrast, comparisons of three mechanisms by which high segregation number might be achieved, based on radically different views of DNA from line GT(stable and homogeneous at 11% np
12300) with its derivative GTS (genotypically heteroge- the intracellular organization of mtDNA molecules. The simplest is that copy number and segregation number neous and shifted to 29% np average heteroplasmy)
showed clear evidence of a chromosomal difference, are synonymous, but other interpretations are possible. In this first model, therefore, we assume that every namely a gain of most or all of chromosome 9 (Figure
8a). To confirm this result, CGH was carried out to mtDNA molecule has an equal chance of being parti-tioned to either daughter cell, regardless of where in compare DNA from each of lines GTand GTSwith normal
human DNA, indicating that line GTis indeed deficient the cell it is physically located. This might be achieved if, like mitochondria themselves, mtDNA was highly dy-for chromosome 9, whereas the complement of
chromo-some 9 DNA in line GTSis as normal (Figure 8b). CGH namic within the cell, so that the physical locations of mtDNA molecules become randomized during each cell further revealed that the chromosome 9 content of line
GTSis also increased relative to that of another of the cycle. This model assumes that mtDNA is dispersed in the cell and that single mtDNA molecules are the unit A549 lung carcinoma cybrids of the series, line Y (Figure
8c). The shift in mitochondrial genotype, in this in- of inheritance. Almost nothing is known about the de-gree to which mtDNA molecules move about the cell stance, is therefore correlated with a gross change in
nuclear genotype, although this does not prove cau- in the course of the mammalian cell cycle. In yeast mating, when mtDNA molecules are supposedly pro-sality.
grammed to meet and exchange information, mtDNA remains much more rigidly fixed in the cytoplasm than
DISCUSSION mitochondrial proteins/membranes, during at least the
early phase of the mating process (Nunnariet al. 1997).
The experiments described in this paper document
The idea of mtDNA as a dynamic molecule is sup-three quite distinct types of behavior of heteroplasmic
ported by observations inr0HeLa cell cybrids, in which cells in culture: (1) stable heteroplasmy with high
segre-introduced mtDNA rapidly spread throughout the cell gation number, (2) genotypic shift effected by an
exter-(Hayashiet al. 1994) and in which complementation
nally applied selection, and (3) genotypic shift
associ-was observed between partially deleted mtDNA and ated with an apparent, transient relaxation of partition
mtDNA carrying a chloramphenicol-resistance mutation constraints.
(Takaiet al. 1997). In contrast to this, in 143B osteosar-Maintenance of stable heteroplasmy: The ability of
coma cell cybridsYonedaet al. (1994) failed to observe
cells to maintain stable heteroplasmy with a high
effec-complementation between pathological mtDNA point tive segregation number differs from what was
pre-mutations in different tRNA genes, suggesting that viously observed in the mammalian germ line (Jenuth
mtDNA molecules may have spatially limited spheres of
et al. 1996), as well as in yeast (TreatandBirky1980;
influence within the mitochondrial network.
Birky 1983). In both of the latter cases, segregation
The second model is almost the exact opposite of the number is at least an order of magnitude below the
374 S. K. Lehtinen et al.
Figure8.—Comparative ge-nomic hybridization. CGH sig-nals are shown only for chro-mosomes 9 and 10, averaged from a minimum of 5 replicate chromosomes in each hybrid-ization. For each chromosome the average spectral difference is plotted along the length of the chromosome on a scale that indicates the margins of error for signal equivalence. Signal to the right indicates gain relative to the reference DNA; signal to the left indi-cates loss. Solid bars alongside the plot indicate the chromo-some regions of significant sig-nal difference. (a) Comparison of DNA from line GTS(shifted) against line GT (unshifted) as reference. The signal for chro-mosome 10 indicates no sig-nificant differences. The signal for chromosome 9 indicates gain of DNA in line GTSalong the entire length of the chro-mosome, except perhaps for the tip of the long arm, as denoted by the solid bar to the right of the plot. Repeat experiments (not shown) gave the same results. (b) Comparisons of DNA from, respectively, lines GT(top) and GTS(bottom) against normal human genomic DNA as reference. The two lines exhibit a similar profile for chromosome 10, with a possible underrepresentation of a short region toward the telomere of the long arm. For chromosome 9 the two cell lines give different profiles, consistent with the results shown in a. Line GTSgives signal within the normal range, except at the tip of the long arm, where there is a probable amplification. By contrast, line GTgives signal indicating a relative underrepresentation of almost the entire chromosome, except for the tip of the long arm, as denoted by the solid bars to the left of the plot. (c) Comparison of line GTSwith line Y as reference. The profile for chromosome 10 is very similar to that seen in b for each cell line compared with normal DNA. The profile for chromosome 9 shows a uniform overrepresentation, straddling the limit of significance along the whole length of the chromosome. This is consistent with a general deficiency of chromosome 9 in A549 cybrid lines, with a gain of this chromosome uniquely in line GTS.
of every mtDNA molecule is not random, but absolutely nections between the two membranes and between mitochondria and the cytoskeleton are well docu-constrained. At each round of mtDNA replication the
two daughter molecules are proposed to be marked in mented, hence the physical components of such a ma-chinery are not unprecedented, although the nature of some way that determines their eventual partition in
opposite directions at cell division. This would imply the any mtDNA kinetochore is unknown. The effectiveness of such a system for constraining partition would be existence of some kind of mtDNA kinetochore, perhaps
analogous to the structure recently discovered in bacte- dependent on all or almost all mtDNA molecules repli-cating during each cell cycle. However, long-standing ria (Glaser et al. 1997; Lewis and Errington 1997;
WheelerandShapiro1997), and would furthermore observations indicate that, at least in tumor cells in cul-ture, not every mtDNA molecule replicates exactly once imply hard-wired connections between mtDNA and the
cytoskeleton, through the mitochondrial membrane sys- during each round of cell division (reviewed in Clay-ton1982).
tem, at least during cytokinesis. Such a system is indeed
suggested by observations of organelle partition in uni- The third model, which we favor, is that mtDNA mole-cules are grouped, as in yeast, plants, and slime molds cellular eukaryotes (Kuroiwaet al. 1998), and
disrup-tion of the cytoskeleton is known to impair the normal (Oldenburg and Bendich 1998; Sasaki et al. 1998),
into essentially permanent nucleoid structures, each patterns of mtDNA segregation in yeast (Berger and
Yaffe1996). containing a number of physically associated, protein-bound copies of the genome that usually are faithfully In mammalian cells mtDNA is generally believed to
exist in a proteinaceous complex associated with the replicated as a unit. In the stably heteroplasmic cell, this model assumes that each nucleoid is itself heteroplasmic inner membrane, as in plants, yeast, and lower
eukary-otes (Kuroiwaet al. 1994;Miyakawaet al. 1995;New- (i.e., contains molecules of the two different types), but that the heteroplasmy levels of the different nucleoids
Con-within the cell are roughly homogeneous. Thus, the analysis of patient-derived fibroblast cell clones ( Mat-thewset al. 1995). Stem cells must survive a prolonged
composition of the mtDNA population is maintained
at cell division, because the units of segregation are lifetime, with many rounds of division under conditions of little or no selection for respiratory function. Segrega-essentially identical. Any segregation that is actually
ob-served would then be attributable to the fact that the tion toward homoplasmy for deleterious mutations such as A3243G during this period would be catastrophic, exact number of mtDNA molecules in each nucleoid
might vary, and that especially where one mtDNA geno- but only once the cell’s descendants are required to differentiate. A system of constrained segregation, such type is extremely prevalent (e.g., 95% or more), some
heterogeneity in the degree of heteroplasmy of different as we observed in our A549 lung carcinoma cybrids, would minimize the risk that deleterious mutations aris-nucleoids must exist. In addition there may be a degree
of “leakiness” of the system that faithfully replicates such ing during the lifetime of a stem cell can accumulate to a damaging level. Tumor cells are widely regarded nucleoids.
This model has the advantage of being compatible as dedifferentiated representatives of the stem cell com-partments from which their tissues of origin are derived. with the noncomplementation of pathological mtDNA
mutations reported byYoneda et al. (1994), i.e., that Mitochondrial DNA is arguably located in a highly muta-genic environment, due to the generation of oxygen genetically distinct nucleoids in the cell would continue
to replicate faithfully and each have a distinct sphere radicals as a by-product of respiration (Miquel1992); hence this system may have evolved to compensate for of genetic influence. Furthermore, it does not require
stable interactions between mtDNA and the cytoskele- a hypothetical high somatic mutation rate, preserving the fitness of the stem cell population throughout life. ton to be invoked, although it does still imply the
existence of some kind of mitochondrial kinetochore, Genotypic shift arising from relaxation of partition constraints:In cultures of two different cybrid cell lines and what might be termed mitokinesis, as proposed by
Kuroiwaet al. (1994), and as inferred cytologically in we observed, as a rare event, a concerted shift in average heteroplasmy level without evidence of massive cell a number of organisms. In an earlier study of the
(short-term) evolution of heteroplasmy in fibroblast clones death or interrupted growth. In the one case that we were able to analyze in detail shortly after the primary carrying the np 3243 mutation, and also in cybridization
experiments using one such clone as a donor, Mat- event, there was clear evidence for a dramatic diversifi-cation of mitochondrial genotype in a culture of cell
thews et al. (1995) also concluded that the unit of
mitochondrial inheritance in heteroplasmic cells was line that has otherwise behaved in the standard fashion,
i.e., with highly constrained segregation. We therefore
itself heteroplasmic. However, there is no physical
evi-dence to support the view that mtDNA is organized thus interpret concerted genotypic shifts, such as occurred in both lines G and GT, as being the result of a sudden in mammalian cells.
Genotypic shift under external selection at the cellu- relaxation of partition constraints, followed by selection at the cellular level against cells that segregate, as a
lar level:Selection against cells with the highest levels
of np 3243 mutant mtDNA was achieved in the experi- result, toward homoplasmy for either the np 3243 or np 12300 mutation.
ments described here in two different ways. Cells of
line G, other than the tiny minority in which mitotic The relaxation on partition constraints that we infer to have occurred in both cell lines appears to have been segregation had raised the level of wild-type mtDNA
above the threshold of 2–3%, were unable to grow in transient. Some 28 wk after its initial shift in genotype was noticed, line G5Shad reestablished a relatively nar-the respiration-selective Gal medium, nor were nar-they able
to grow from single, isolated cells in rich medium, even row distribution of heteroplasmy values, and this was also the case for 2 GTSclones analyzed in detail (Table though their survival and growth rate when passaged at
higher cell density was indistinguishable from that of 3). In addition, the 10 clones picked from line GTS2 mon after the shift was recorded were more narrowly distrib-control cybrids. The unclonability of high mutant cells
may reflect a defect in the ability of an individual cell uted about the mean heteroplasmy value than the clones picked at the earlier time point (see Figure 2d). The to retain bioenergetic or ionic balance throughout the
cell cycle, for which neighboring cells, perhaps in gap individual GTSclones generally reestablished a new sta-ble heteroplasmy level within weeks, but with shifts in junctional communication, can compensate. The
physi-ological relevance of this is unclear, because cells do not both directions. Only one clone, GTS-20, was clearly con-tinuing to shift in genotype at 3 mon, and this was normally find themselves isolated from their neighbors.
However, the imposition of external nutritional con- also the clone that behaved differently when grown the second time, which possibly indicates that it had initi-straints may provide a good model for the additional
demands placed upon a cell’s bioenergetic capacity dur- ated a shift de novo.
However, considering the amount of suppressor mu-ing differentiation of stem cells to perform specialized
cell functions (as nerve, muscle, secretory tissues, and tant in the set of GTSclones analyzed at the two time points (2 and 14 wk after cloning), only a small overall so on). Selection in vivo against cells with high levels of
op-376 S. K. Lehtinen et al.
posed to 471 at 2 wk of growth). In other words, al- mtDNA molecules now moved to daughter cells only according to their positions in the cell, in a scenario though the bulk culture seemed gradually to return to
a more homogeneous state following the shift, this is rather similar to that envisaged above. If mitochondrial nucleoids of different genotypes were already present, not reflected in the distribution of mtDNA genotypes of
cell clones drawn from the population, which remained then this would accelerate segregation still further, upon rupture of the links between mtDNA and the wide. In addition, we observed that cell clones with
extreme heteroplasmy levels for np 12300 (,10 or apparatus of cytokinesis. Another possibility is that mtDNA replication might suddenly become highly
non-.70%) seemed to have a respiratory impairment, and
it is thus reasonable to assume that they may also have random, in the sense that a small number of molecules may replicate many times in one cell cycle, rather than a mild growth defect. The behavior of the bulk culture
following the diversification of genotypes may therefore all or most molecules replicating once. This would have the same effect as a transient drop in mtDNA copy involve a degree of selection at the cellular level against
cells with very high or very low amounts of suppressor number, leading to a founder effect. The possibility that mtDNA replication in mammalian cells might, under mutant.
The mechanism by which partition constraints are some circumstances, switch to a rolling circle mode as in yeast (Maleszkaet al. 1991) and plants (Backertet
relaxed obviously depends on what is the mechanism
constraining segregation in the first place. One obvious al. 1996) should be considered, because this would
en-tail selection of a relatively small number of molecules model, but which is unfortunately difficult to test, is
that a catastrophic event caused a transient but major as replication templates.
Finally, if the nucleoid/mitokinesis model is consid-reduction in mtDNA copy number in the whole cell
population, i.e., a bottleneck phenomenon. Such a tran- ered, mitotic segregation would be predicted to result from a transient disaggregation and reaggregation of sient reduction in copy number would entrain a
corre-sponding reduction in segregation number of exactly mtDNA nucleoids, especially if several rounds of DNA replication took place in the interim, generating a the kind we observed. Arguing against this is the fact
that we observed no abnormality of cell growth during highly nonuniform pattern of intracellular hetero-plasmy. We strongly favor this model, not only because the process, which might be expected to accompany a
sudden, major loss of mtDNA. If the drop in copy num- it is the most consistent with other published data, but because it best accounts for the progressive reestablish-ber was milder but more prolonged, then we might
expect to have detected at least an echo of it in cells ment of stable heteroplasmy that we observed in the GTS clones, with reproducible, clone-specific shifts in still shifting in genotype during the recovery phase,
which we did not. On balance, while we cannot entirely genotype apparently independent of phenotypic selec-tion. How we envisage this is depicted in Figure 9. reject this hypothesis, we think it unlikely, and now focus
on alternative possible explanations. We propose that at the time of the primary event, the previously homogeneous nucleoids are replaced with a Proceeding from the same three models presented
earlier, we can propose the following. According to the collection of nucleoids of very different internal hetero-plasmy levels, some of which may be homoplasmic or dynamic mtDNA model, mitotic segregation would be
induced if mtDNA movement around the cell were near homoplasmic for one or another genotype. During subsequent cell growth, these nucleoids remain in their blocked; hence sister molecules would remain close
to-gether following replication. In a rather small number new configurations, but are subject to mitotic segrega-tion. The implied number of segregating units would of cell divisions this would lead to the emergence of
cytoplasmic domains of a defined genotype, resulting in be rather small (at most, the number of nucleoids physi-cally present), leading rapidly and progressively to the a significant drop in the apparent segregation number.
Restabilization of heteroplasmy would then be viewed reestablishment of stable heteroplasmy. The new level of heteroplasmy reached in each cell clone is that of as a resumption of dynamic mtDNA movement. An
alter-native version of this is to invoke the formation of mito- the one remaining type of nucleoid in that cell after mitotic segregation is complete. The reproducible be-chondrial nucleoids in a cell that previously (or
nor-mally) does not possess them. If the thousands of havior of each cell clone is understandable if we assume that already at the time of cloning, or at the first time mtDNA molecules previously segregating as
indepen-dent units simply coalesced into a few hundreds or tens point at which we were able to sample the mtDNA popu-lation 2 wk later, there is already a predominant of mtDNA aggregates, then the segregation number
would drop. This would especially be the case if such nucleoid type present in each cell.
The cell line in which we observed these events was nucleoids formed mainly from mtDNA molecules of
one or another genotype. initially 99% mutant at np 3243 mtDNA and 11% mu-tant at np 12300, and homoplasmy for either mutation In the mitochondrial mitosis model, in which
daugh-ter mtDNA molecules are constrained to segregate in would presumably be deleterious, because mitochon-drial protein synthesis would be severely impaired due opposite directions at cell division, mitotic segregation
reso-Induction of altered mtDNA partition behavior:In an attempt to determine how the altered partition behavior that we observed in our cultures may have come about, we tested two hypotheses. The first postulated that the inducing mechanism may be environmental, related to the action of DMSO, a drug that is known to affect cytoskeletal organization. The second proposed that mtDNA segregation may have been induced by a gross change in the nuclear genotype of the cells. The DMSO hypothesis was tested directly, with negative results. Small differences in the mean and variance of hetero-plasmy were observed in cell clones after treatment with the drug, but these were not systematic. We conclude that if transient DMSO treatment was in any way in-volved in the shift of mtDNA genotype it must have been in combination with something else that we were not able to test.
The possible involvement of the nuclear genome was studied retrospectively, by comparative genomic hybrid-ization. This indicated that while the shift observed in line G5Swas not accompanied by any detectable nuclear genetic change, that of line GTS was associated with a gain of chromosome 9. The present results do not estab-lish causality. However, the simplest explanation is that the gain of chromosome 9 induced the abrupt but tran-sient diversification of mtDNA genotype that we ob-served. We postulate that a gain of chromosome 9 in an otherwise aneuploid cell line resulted in a modest
Figure9.—A model for changes in mtDNA genotype in GT
cells, based on the heteroplasmic nucleoid model. In the stable growth advantage, most probably unrelated to mito-heteroplasmic cells (a) it is proposed that all nucleoids (small chondria, that rapidly replaced the previous cell popula-circles) have the same relative composition of np 12300 sup- tion with the new variant. Because this is, by definition, pressor mutant (black) and wild-type (white) mtDNAs, with
a cloning event, the diversification of mtDNA genotype all or almost all molecules also mutant at np 3243. During
that appears to have accompanied it would seem even successive rounds of cell division the mtDNA genotype of
individual cells in the culture (b) remains unchanged, because more dramatic than if it occurred in a population of nucleoids are proposed to replicate and divide faithfully, thus cells. We suggest that enhanced expression of one or preserving their uniformity. In response to an unknown stimu- more genes on chromosome 9 resulted in a significant, lus, cells in the culture can enter a different state (c), in which
but transient, modification of mtDNA organization their nucleoids become transiently disaggregated, or in which
within the cell, whether by the disaggregation and re-their faithful replication is temporarily abrogated. The result
is that individual nucleoids in the cell, when they reform, can formation of nucleoids, the induction of rolling circle have a great variety of different internal heteroplasmy levels. replication, the disruption of mtDNA/cytoskeleton in-During subsequent growth of the culture, mitotic segregation teractions, or some other mechanism. The event then progressively purifies the nucleoid population in each cell
manifested as mitotic segregation over a period of weeks, descendant, such that after many rounds of division only one
such as already illustrated in Figure 9, leading finally type of nucleoid remains in each cell. Cells containing only
homoplasmic mutant nucleoids (f), and cells whose nucleoids to the reestablishment of a stable and homogeneous contain only np 3243 mutant mtDNA without the suppressor heteroplasmy level. The shift observed in line G5Smay, (g), are proposed to be eliminated, progressively, by negative however, have involved another mechanism. Given the selection, leaving a diverse collection of stably heteroplasmic
clear selective advantage of lower heteroplasmy values cells (d and e), whose heteroplasmy levels are now different
for np 3243 mutant mtDNA in the A549 background, and much more diverse than the original culture. The average
heteroplasmy level of the remaining cells may differ from that we cannot rule out a simple selective mechanism in this of the original culture as a result of the different selective case.
values of very high or very low levels of the suppressor mutant. To establish which of the proposed mechanisms
ac-counts for the segregation behavior of mtDNA during the long-term culture of heteroplasmic mammalian cells and to establish the exact role of the nuclear genome lution period, the shift in average genotype of each
clone can be understood as the loss of homoplasmic in this process, it will be necessary to build a detailed understanding of how mtDNA is organized in cells, the nucleoids, by virtue of their segregation into cells that