ISSN(Online): 2319-8753 ISSN (Print): 2347-6710
International Journal of Innovative Research in Science,
Engineering and Technology
(An ISO 3297: 2007 Certified Organization)
Vol. 4, Issue 11, November 2015
Protection Scheme Based on Analysis of
Critical Clearing Time of System
Rahul R Nair
1, R Visakhan
1, Sebin Joseph
1, Ancy Sara Varghese
2PG Student [Power System], Dept. of EEE, Saintgits College of Engineering, Kottayam, Kerala, India1
Assistant professor, Dept. of EEE, Saintgits College of Engineering, Kottayam, Kerala, India2
ABSTRACT:Nowadays power system mainly concentrate on the platform of reliability and security parameters. Due to the deregulation of power systems, most of the consumers depends on highly reliable and secure supply. Most of the works concentrated on the Critical Clearing Time and transient stability analysis but due to less accuracy, these were not able to apply in real time analysis in multi machine system. The Critical Clearing Time (CCT) is the largest possible time for which a power system is allowed to remain in fault condition without losing stability. Appropriate CCT settings of protective equipment’s on power system greatly determine the reliability of power supply. This thesis is concerned with time domain analysis of Critical Clearing Time of Central Travancore Grid and IEEE 14 bus system. In this thesis, a look up table is formulated with an algorithm which relates the stability of the system through eigenvalue analysisand time domain simulations. According to the changes in power system, relay settingsare updated periodically based on the look up table so that reliability can be improvedand the system becomes more flexible. The CCT is varied according to the changes inthe parameters of the system. The Simulation platform used here is PSAT/MATLABtoolbox and the test system for the study is IEEE 14 bus system and Central Travancore Grid in which the algorithm developed is applied
KEYWORDS:Critical Clearing time, Central Travancore Grid.
I. INTRODUCTION
Stability of the power system is an important problem faced by engineersin establishing secure system operation. Growing economies of the world has widelyincreased the load demand. As a result, the power system structure has become largein size as well as complex in nature. This complexity has lead to more security andstability issues in the power system. As the transient contingency analysis of such asystem is tedious, this pushes the system transient stability limit to a drastic conditionand routed for major reliability problems in power system.
Transient stability of the system is its ability to reach an equilibrium state aftera transient fault has occurred[1]&[2]. Different methods are available for transient stabilityevaluation such as time direct techniques, domain simulation, artificial intelligencetechniques based on the energy function. Even though the causes for the distraction on
transient stability are identified, less research is carried out in improving the stabilitylimits. Most of the existing methods include providing multiple feeders in the systemand by increasing the system capacity but all these methods are highly uneconomical.
Critical Clearing Time (CCT) of a system is the maximum time upto whichthe system can be withstand in the faulty condition without any stability issues in thesystem[3],[4]&[5]. If the fault exists above the CCT, the system enters into burnout. Reliability ofa power system can be improved by the optimum control of the Critical Clearing Time(CCT) of the relay system. Changes in CCT depends mainly on the system pre-faultconditions, (operating point, topology, system parameters), fault structure (type andlocation) and post fault conditions that themselves depend on the protective relayingplan employed. It would be highly desirable to define this relation analytically. But dueto diversity of variables of this task become extremely complicated.
ISSN(Online): 2319-8753 ISSN (Print): 2347-6710
International Journal of Innovative Research in Science,
Engineering and Technology
(An ISO 3297: 2007 Certified Organization)
Vol. 4, Issue 11, November 2015
obtained onlythrough the static analysis[6],[7]&[8] .So the variation in the CCT due to the dynamic conditionscannot be utilized for improving the reliability of the system. Reaction of the relay to afault is determined by the current CCT value and by analysing this variation the reliabilityof the system can be improved. This methodology turned out to be more efficienton the grounds that no extra designs are needed for the current framework. CCT haslarge scope in improving the reliability of smart grid systems.
After the development of power electronics devices such as switching convertersand inverters there came the FACTS devices which could provide adequate activeand reactive powers at the point of injection there by maintaining the grid stability[9]&[10].Normally FACTS devices with supplementary controller is used to damp system oscillationsand reactive power management. But when FACTS devices are incorporatedto the system, it also influences the measure of CCT. So the change in CCT whenFACTS devices were incorporated was drastic in nature.
In this work, analyse the change of CCT with its depending factor. Based on the dependency of CCT, try to develop a new algorithm for find out the CCT of the system with the change in parameters of the system. And also develop a new low cost method for protection of the system on the basis of the change of CCT. This method can simply implement in a new system or existing system.
II. RELATEDWORK
Mathematically, CCT is a complex function of pre-fault and post fault systemconditions . In practice, CCT can be obtained from two ways such as trial and erroranalysis of system post disturbance equations or by integrating fault-on equatifault-ons andchecking the value of Lyapunov energy functifault-on. For the first approach many integratifault-onprocesses are necessary and for the second approach the CCT can be evaluated injust one integration process. The major problem for the second approach is to find ananalytical energy function which considers a precise model of generator and connecteddevices. For this reason the work will be more complicated and individual analysis is
required for each system[11].
Another method is based on the use of amplitude and bandwidth of the firstlarge oscillation of the swing curve, and CCT can be determined using neural network.It adapts a multilayerperceplron (MLP) architecture and a second order training methodwhich uses the non-linear optimization method. The architecture of the neural networkbecomes more complex when more number of generators or compensators are addedto the system. Training and testing of data includes the detailing about all parametersof generators. If the data is not sufficient, the accuracy of the result becomes very lessand the system should be trained upto a satisfied accuracy level . So this method is toocomplicated and individual design is required for each case and cannot be consideredas a general method[12].
Among the direct methods used to estimate the CCT, the extended equalarea criterion, Lyapunov functions, transient energy functions, the hybrid method andothers based on decision and regression trees and artificial neural networks (ANN) areconsidered. In fast applications for which the precision of the CCT is not critical, directmethods like neural networks may be used. ANN methods have been used in dynamicsecurity assessment and they have been demonstrated to be successful for the calculationof the Critical Clearing Time but their application to practical power systemsundergoes some difficulties due to the large dimensions of the power systems[13].
A new structure preserving the energy function is developed, known as PotentialEnergy Boundary Surface(PEBS) method. In this method energy function of themodelled system compared with critical energy for finding the transient stability of thesystem. It becomes faster in operation but accuracy is very less. As a common toolfor simple analysis of power system, the PEBS method is limited by the accuracy of itsmodels and the statistics shows that the error can be basically kept below 20% and thismethod needs a detailed model of generators and other components in the system[14].
ISSN(Online): 2319-8753 ISSN (Print): 2347-6710
International Journal of Innovative Research in Science,
Engineering and Technology
(An ISO 3297: 2007 Certified Organization)
Vol. 4, Issue 11, November 2015
III.PROPOSEDMETHODOLOGY
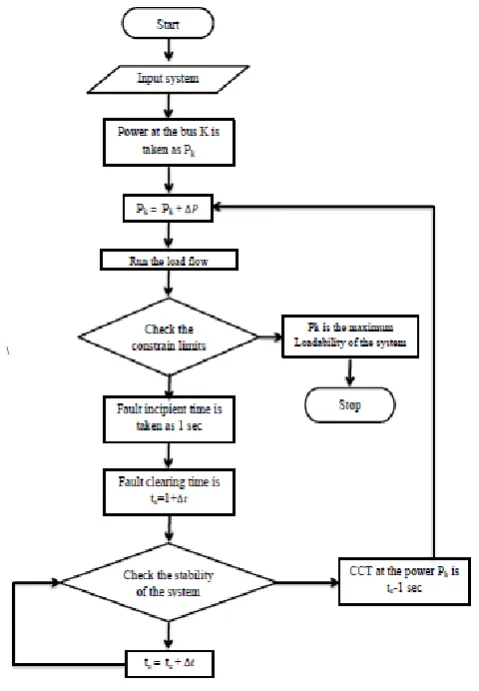
When CCT analysis was done, it is found that mostdepending factor for CCT variation is the load change in the system[11]. Based on thisfactor, a methodology was developed for finding CCT of any system correspondingto the load variation of any bus in the system.The proposed methodology includes themodelling of IEEE-14 bus system and Central Travancore Grid. In this methods firstlythe load is increased step by step by considering the limit of equality and inequalityconstraints. In this simulation, a fault is implanted in bus number 5 and an appropriatefault clearing time is set for which stability of the system is analysed by eigenvalue analysis and through the stability indices for limit violation.Thereafter the clearing timeof the fault is gradually increased till the system becomes unstable and correspondingclearing time is recorded for the power value in the look up table. Figure 1 shows theflow chart of the algorithm for finding the CCT at different load conditions.
Figure 1: Flow chart of developed algorithm for CCT
ISSN(Online): 2319-8753 ISSN (Print): 2347-6710
International Journal of Innovative Research in Science,
Engineering and Technology
(An ISO 3297: 2007 Certified Organization)
Vol. 4, Issue 11, November 2015
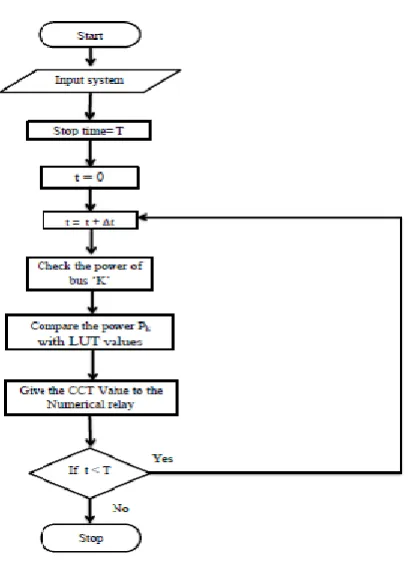
Figure 2.Proposed Methodology
IV.POWERSYSTEMSTABILITYCONSTRAINTS
a)Small signal stability:
For the small signal stability analysis, the powersystem with distributed generators is modelled as a set of differential equations and aset of algebraic equations as given in equation (1)
𝑥 = 𝑓 𝑥, 𝑦 0 = 𝑔(𝑥, 𝑦) . . . . . (1)
Where, x is the vector of the state variables and y the vector of the algebraic variables. The differential algebraic equations(DAEs) can be linearized at an operating point toobtain the system state matrix As
. . . . . . .(2)
Eliminating the algebraic variables, the state matrix As is given by
.
𝐴𝑠= 𝐹𝑥− 𝐹𝑦𝐺𝑦−1𝐺𝑥
. . . (3)
Where, Fx,Fy,Gx,Gy are Jacobian Matrices as given in equation (2) The eigenvaluesof As provide the
ISSN(Online): 2319-8753 ISSN (Print): 2347-6710
International Journal of Innovative Research in Science,
Engineering and Technology
(An ISO 3297: 2007 Certified Organization)
Vol. 4, Issue 11, November 2015
b) Fast Voltage Stability Index:
Fast Voltage Stability Index (FVSI) proposed by is utilized in this paper toassure the safe bus loading.The line that exhibits FVSI close to 1.00 implies that it is approaching its instability point. If FVSI goes beyond 1.00, one of the buses connected to the line will experiencea sudden voltage drop leading to the collapse of the system. FVSI index incorporationin the controller assures that no bus will collapse due to overloading[17]
𝐹𝑉𝑆𝐼𝑖𝑗 = 4𝑍2𝑄
𝑗 𝑉𝑖2𝑋
c)Transient stability index:
An index was defined using the maximum rotor angle difference to analyse the severity of the angular separation between synchronous generators in a network followinga 50ms three-phase short circuit fault[18]. The transient rotor angle severityindex (TRASI) is defined as follows:
𝑇𝑅𝐴𝑁𝑆𝐼 = (360 0− 𝛿
𝑚𝑎𝑥 𝑝𝑠𝑡
3600− 𝛿 𝑚𝑎𝑥 𝑝𝑟𝑒 )
Where 𝛿𝑚𝑎𝑥 𝑝𝑠𝑡
and 𝛿𝑚𝑎𝑥 𝑝𝑟𝑒
represent the post-disturbance and pre-disturbance maximum rotor angle difference in the network respectively.The TRASI is a comparative measure of rotor angle separation following atransient grid fault in the network. The index varies from 0 to 1,TRASI value shouldalways be near to one for better system stability and reliability .Here in IEEE-14 systema three phase short circuit fault was given to bus number 5 and results are plotted. TheTRASI value is calculated in IEEE-14 bus system and is found to be 0.9897, whichimplies that the system is stable after when a three phase fault is occurred in the system.
V. CENTRALTRAVANCORESYSTEM
ISSN(Online): 2319-8753 ISSN (Print): 2347-6710
International Journal of Innovative Research in Science,
Engineering and Technology
(An ISO 3297: 2007 Certified Organization)
Vol. 4, Issue 11, November 2015
Figure 3.PSAT model of Central Travancore System
VI.SIMULATIONRESULTSINCENTRALTRAVANCOREGRID
CCT variation of Central Travancore Grid is done by analysing the rotorspeed variation of the generators in the system at different load conditions. Figure 3,4 represents the rotor speed variation of generators in kayamkulam, and sabarigirirespectively at 100 % loading and the fault clearing time for 1.336sec. From the graphs it is inferred that in all these conditions system is stable becauserotor speed is settling down to a constant value. So CCT of the system will greater thanor equal to 0.336 sec.
ISSN(Online): 2319-8753 ISSN (Print): 2347-6710
International Journal of Innovative Research in Science,
Engineering and Technology
(An ISO 3297: 2007 Certified Organization)
Vol. 4, Issue 11, November 2015
Figure 5.Rotor speed variation of generator in sabarigiri
Figure 6.Rotor speed variation of generators in Central Travancore Grid when systemin unstable
Figure 6 represents the rotor speed variations of the generators in theCentral Travancore Grid at 100 % loading and at the fault clearing time set as 1.337sec. In this condition all the generators in the system goes to unstable condition. So thiscondition is taken as the reference clearing time for developing the protection schemein Central Travancore Grid.
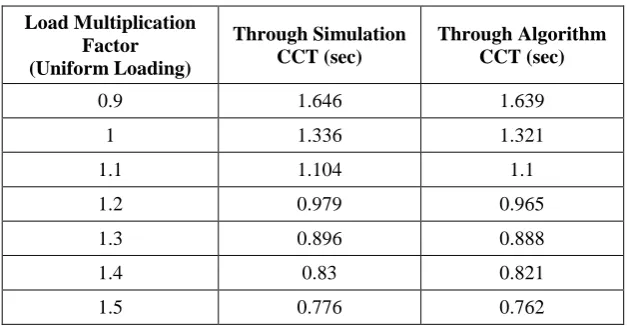
Table 1 Analysis through simulation and algorithm in Central Travancore Grid
Load Multiplication Factor (Uniform Loading)
Through Simulation CCT (sec)
Through Algorithm CCT (sec)
0.9 1.646 1.639
1 1.336 1.321
1.1 1.104 1.1
1.2 0.979 0.965
1.3 0.896 0.888
1.4 0.83 0.821
ISSN(Online): 2319-8753 ISSN (Print): 2347-6710
International Journal of Innovative Research in Science,
Engineering and Technology
(An ISO 3297: 2007 Certified Organization)
Vol. 4, Issue 11, November 2015
1.6 0.726 0.715
1.7 0.688 0.681
1.8 0.66 0.653
1.9 System unstable System unstable
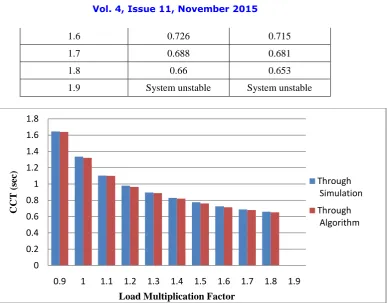
Figure. 7 Graphical representation of results
Table 1 represents the CCT obtained through time domain simulation and through proposed algorithm for different load multiplication factors and from the tabulation itis inferred that the simulation results and the results through the proposed algorithm isvery closely related. This deviation of the tabulated results are due to approximationin the parameter transient stability indices. Figure 7represents variation of results through the time domain simulation and algorithm graphically for different load multiplicationfactors.
VII. ANALYSISINCENTRALTRAVANCOREGRID
This section contains the datas of Central Travanvcore Grid after implementingthe new protection scheme. In this case fixed load change is applied fordefinite time interval.
Table 2: Load change and CCT variation of Central Travancore Grid
Time Load Multiplication
factor CCT (sec)
0.5 0.95 1.321
1 0.95 1.321
1.5 0.95 1.321
2 0.95 1.321
2.5 0.95 1.321
3 1.35 0.821
3.5 1.35 0.821
0 0.2 0.4 0.6 0.8 1 1.2 1.4 1.6 1.8
0.9 1 1.1 1.2 1.3 1.4 1.5 1.6 1.7 1.8 1.9
CCT (
sec
)
Load Multiplication Factor
Through Simulation
ISSN(Online): 2319-8753 ISSN (Print): 2347-6710
International Journal of Innovative Research in Science,
Engineering and Technology
(An ISO 3297: 2007 Certified Organization)
Vol. 4, Issue 11, November 2015
4 1.35 0.821
4.5 1.35 0.821
5 1.35 0.821
5.5 1.35 0.821
6 1.55 0.715
6.5 1.55 0.715
7 1.55 0.715
7.5 1.55 0.715
8 1.55 0.715
8.5 1.8 0.653
9 1.8 0.653
9.5 1.8 0.653
10 1.8 0.653
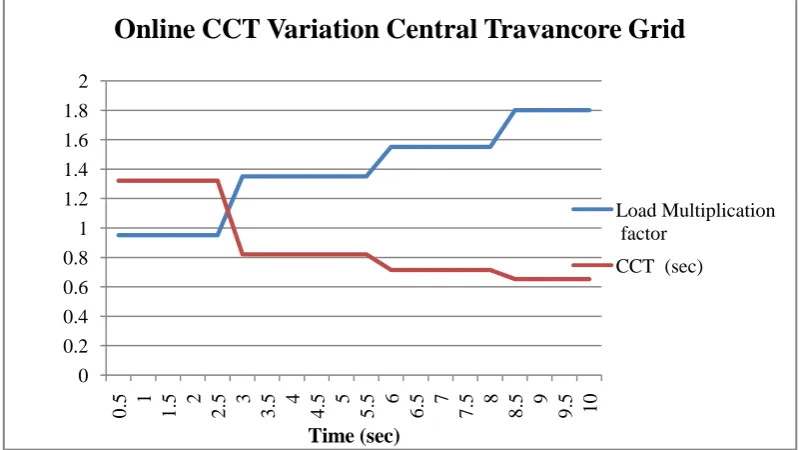
Table 2, shows the variation of CCT on load multiplying factor at differentinstant of time. From Table 2 it is inferred that as the load changes the system updatesto a new CCT value as the setting time of numerical relay. Figure 8 shows thegraphical representation of load change and CCT variation of Central Travancore Gridand it is inferred that when the load increases , the system CCT value deceases andstability margin also reduces
.
Figure 8 Graphical representation of load change and CCT variation of Central TravancoreGrid
The Table 2 shows the CCT values with respect to change in load of thesystem.In this simulation time upto 2.5 sec, the load multiplying factor is kept at 0.95and responding to this load factor CCT is 1.321 sec . From the Table 2 it is inferredthat when the load increases the CCT gets reduced. Figure 7.19 represents the graphicalrepresentation of this data.
0 0.2 0.4 0.6 0.8 1 1.2 1.4 1.6 1.8 2
0
.5 1 1.5 2 2.5 3 3.5 4 4.5 5 5.5 6 6.5 7 7.5 8 8.5 9 9.5 10
Time (sec)
Online CCT Variation Central Travancore Grid
Load Multiplication factor
ISSN(Online): 2319-8753 ISSN (Print): 2347-6710
International Journal of Innovative Research in Science,
Engineering and Technology
(An ISO 3297: 2007 Certified Organization)
Vol. 4, Issue 11, November 2015
This scholary work proposes a method which proves to be advantageouscompared with the existing system. The existing system utilizes a method dependentupon a static CCT. This work focuses on changing the CCT with respect to variationsin loads. Some advantages are highly notable. This scheme improves the reliability ofthe system. Under light load conditions, CCT adjusts itself to avoid unwanted trippingin transient fault conditions so that reliability of the system improves. This plan makeutilization of an expansive piece of existing hardware. Extra installation changes areminimum and thus implementation of this technology is highly economical. The capability of the system to adapt according to the changes in the CCT value makes it very flexible.
VIII.CONCLUSION
CCT of a system is the maximum time at which the system can withstand in the faulty condition. Reaction of the relay to a fault is determined by the current CCT value of the system. Accurate value of CCT is very much essential for designing an efficient protection scheme. From the analysis, it is observedthat Load Variation is most depending factor of CCT through the analysis of the rotorspeed of the system generator with respect to time. Analgorithm is developed to find the CCT of the system for different load condition in thesystem and a look up table is created for developing a new protection scheme. In thiswork, the new protection scheme is implemented in Central Travancore Grid. Frommy work, it is inferred that the new protection scheme developed can be easilyimplemented to any practical system, SCADA or smart grid which results in betterreliability and security of the system.
REFERENCES
[1] P. Kundur, J. Paserba, V. Ajjarapu, G. Andersson, A. Bose, C. Canizares, N. Hatziargyriou, D. Hill, A. Stankovic, C. Taylor et al., “Definition
and classification of power system stability ieee/cigre joint task force on stability terms and definitions,” Power Systems, IEEE Transactions on, vol. 19, no. 3, pp. 1387–1401, 2004.
[2] AdepojuGafariAbiola and TijaniMuhammedAdekilekun. “ Critical clearing time evaluation of nigerian 330kv transmission system” American
Journal of Electrical Power and Energy Systems, 2(6):123–128, 2013.
[3] Luis FC Alberto, Flavio HJR Silva, and NG Bretas. “Direct methods for transient stability analysis in power systems”: state of art and future
perspectives. In Power Tech Proceedings, 2001 IEEE Porto, volume 2, pages 6–pp. IEEE, 2001
[4] B Boussahoua and M Boudour “Critical clearing time evaluation of power system with upfc by energetic method” electric power, 5:11, 2009
[5] L Ren, Fang Tian, J Yan, Z Yu, Feng Su, and Tao Wu. “Online application and fast solving method for critical clearing time of three-phase
short circuit in power system”Int J Smart Grid Clean Energy, 2(1):93–99, 2013.
[6] Hung Nguyen Dinh, Minh Y Nguyen, and Yong Tae Yoon. “ Novel techniques for real time computing critical clearing time sime-b and
ccs-b.”Journal of Electrical Engineering & Technology, 8(2):197–205, 2013.
[7] SJ Mirazimi, B Salehi, M Tadayon, and HR Karshenas, “ Optimal relay placement in microgrids considering critical clearing time” In Power
Engineering and Optimization Conference (PEOCO), 2013 IEEE 7th International, pages 691–696. IEEE, 2013
[8] P Sravanthi, K Radha Rani, J Amarnath, and S Kamakshaiah. “ Critical clearing time and transient stability analysis of scig based wind farm
with STATCOM ” In Smart Electric Grid (ISEG), 2014 International Conference on, pages 1–8. IEEE, 2014.
[9] TijaniMuhammedAdekilekun and G. Andersson “Critical Clearing Time and Transient Stability Analysis of SCIG based Wind Farm with
STATCOM ” Oleg Lenga, The National Academy of Sciences of Ukraine Institute of Electrodynamics Kiev, Ukraine
[10] E. Gholipour and S. Saadate, “Improving of transient stability of power systems using upfc,” Power Delivery, IEEE Transactions on, vol. 20,
no. 2, pp. 1677–1682, 2005.
[11] Luis FC Alberto, Flavio HJR Silva, and NG Bretas.“ Direct methods for transientstability analysis in power systems â˘A˙I: state of art and future perspectives", InPower Tech Proceedings, 2001 IEEE Porto, volume 2, pages 6-pp. IEEE, 2001
[12] Naoto Yorino, ArdyonoPriyadi, Hironori Kakui, and Mitsuhiro Takeshita.“ A newmethod for obtaining critical clearing time for transient
stability", Power Systems,IEEE transactions on, 25(3):1620-1626, 2010.
[13] RenukaKamdar and Mukesh Kumar Kirar, “ANN Based Critical Clearing TimeDetermination for IEEE 9 Bus System", Conf. on Advances in
Computer, Electronicsand Electrical Engineering – CEEE 2013, ISBN: 978-981-07-6260-5
[14] Yuanzhang Sun and JiangnanPeng.“ A new Lyapunov function for transient stabilityanalysis of power system with emergency control", Power
Systems, IEEEtransactions , 20-7803-7459-202 IEEE 2002.
[15] TheodorosKyriakidis, Guillaume Lanz and RachidCherkaoui “A Transient StabilityAssessment Method using Post-Fault Trajectories"
,Electronics Laboratoryand Power System Group Swiss Federal Institute of Technology, 2014.
[16] Rahul R Nair, AncysaraVarghese,et.al “ Comparative study of Depending Factorsof CCT in IEEE 14 Bus system”, IJAREEIE-
2015,International journal ofadvanced Research in Electrical, Electronics and Instrumentation Engineering.,(ISSN: 2278-8875).
[17] J. Vishnu, R. Menon, T. Joseph, S. SREEDHARAN, V. Chittesh, V. DAS, and S.Joseph, “Ga based optimal facts controller for maximizing
loadability with stabilityconstraint” , International Journal of Electrical Engineering
[18] Ismail Musirin and TitikKhawa Abdul Rahman. “Novel Fast Voltage Stability Index (FVSI) for Voltage Stability Analysis in Power
Transmission System ” ,2002 Student Conference on Research and Development Proceedings, Shah Alam Malaysia.