Available online: https://edupediapublications.org/journals/index.php/IJR/ P a g e | 4756
Earthquake, a natural fury cannot be ignored as
far as the stability of a structure is concerned. All structures should be made seismic resistant to prevent loss of life and infrastructural damage. The Pushover Analysis is conducted to find out the seismic response of the structure In performance based seismic analysis evaluates how building is likely to perform. It is an iterative process with selection of performance objective followed by development of preliminary design, an assessment whether or not the design meets the performance objective; In the present study pushover analysis has been done an two multistoried R.C. frame building; In which plan of 2 buildings was taken symmetrical 10 storey and it consist of 5 bays in x direction & 5 bays in y direction and second building having 15 storey. The shear wall is providing for studying their resisting lateral forces. The building has an overall plan dimension of 20m x 20m.The M25 grade of concrete and Fe 415 grade of steel is considered for design. In this highlight the effect of shear wall on R.C frame building when shear wall providing along the longer and shorter side of the building Pushover analysis is carried out using
commercially available software ETABS and behaviour of RC frames is studied.
Key words : Pushover analysis, Capacity M25, shear wall, ETABS software.
1 Introduction
Seismic analysis is a subset of structural analysis and is the calculation of the response of a building (or non-building) structure to earthquakes. It is part of the process of structural design, earthquake engineering or structural assessment and retrofit in regions where earthquakes are prevalent.As seen in the figure, a building has the potential to ‘wave’ back and forth during an earthquake (or even a severe wind storm). This is called the ‘fundamental mode’ and is the lowest frequency of building response. However, most buildings have higher modes of response, which are uniquely activated during earthquakes. The figure just shows the first and second mode, but there are higher ‘shimmy’
Pushover Analysis of Multi-Storeyed Concrete Building
with and Without Shear Wall UsingEtabs Software
PatraVenkata Naga Jyothi
1,Dr. Dumpa Venkateswarlu
2Jami Lakshmi Sudha
31
M.Tech (student) in structural Engineering, department of civil engineering, Godavari Institute of
Engineering and Technology (Autonomous),Rajahmundry, Velugubanda Village,Rajanagaram
(mandal) East Godavari, A.P, India, pin code: 533296.
2
Professor and Head of the Department, department of civil engineering, Godavari Institute of
Engineering and Technology (Autonomous),Rajahmundry, Velugubanda Village,Rajanagaram(mandal)
East Godavari, A.P, India, pin code:533296.
3
Assistant Professor
,structural Engineering, department of civil engineering, Godavari Institute of
Available online: https://edupediapublications.org/journals/index.php/IJR/ P a g e | 4757
(abnormal vibration) modes.
Fig ure1 First and second mo des of bu ild in g s eis mic res p o n s e
Structural analysis methods can be divided into thefollowing five categories.
a) Linear static analysis
b) Linear dynamic analysis
c) Non linear static analysis
d) Non linear dynamic analysis
Lin ear s tatic an aly s is
In a linear static procedure the building is modelled as an equivalent single-degree of freedom (SDOF) system with a linear elastic stiffness and an equivalent viscous damping. The seismic input is modelled by an equivalent lateral force with the objective to produce the same stresses and strains as the earthquake it represents. Based on an estimation of the first fundamental frequency of the building using empirical relationships or Rayleigh’s method, the spectral acceleration is determined from the appropriate response spectrum which, multiplied by the mass of the building, results in the equivalent lateral force These linear static procedures are used primarily for design purposes and are incorporated in most codes. Their expenditure is rather small. However, their applicability is restricted to regular buildings for which the first mode of vibration is predominant.
Lin ear d y n amic an aly s is
Static procedures are appropriate when higher mode effects are not significant. This isgenerally true for short, regular buildings. Therefore, for tall buildings, buildings with torsion irregularities, or non-orthogonal systems, a dynamic procedure is
required. In the linear dynamic procedure, the building is modelled as a multi-degree-of-freedom (MDOF) system
The seismic input is modelled using either modal spectral analysis or time history analysis but in both cases, the corresponding internal forces and displacements are determined using linear elastic analysis. modes can be considered. Only linear properties are assumed. The analytical method can use modal decomposition as a means of reducing the degrees of freedom in the analysis. If the linear dynamic procedure (LDP) is selected for seismic analysis of the building, the design seismic forces, their distribution over the height of the building, and the corresponding internal forces and system displacements shall be determined using a linearly elastic, dynamic analysis in compliance with the requirements. Buildings shall be modeled with linearly elastic stiffness and equivalent viscous damping values consistent with components responding at or near yield level.
No n -lin ear s tatic an aly s is
Available online: https://edupediapublications.org/journals/index.php/IJR/ P a g e | 4758
induced forces. Consequently, at each event, the
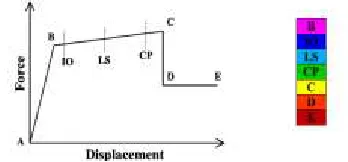
structures experiences a stiffness change as shown in Figure 1.2 where IO, LS and CP stand for immediate occupancy, life safety and collapse prevention respectively.
Fig u re 2 Hin g e p erfo rman ce lev els
The plastic deformation curve is characterized by the following points:
• Point A represents the origin.
• Point B represents the yielding state. No deformation occurs in the hinge up to point B, regardless of the deformation value specified for point B. The displacement (rotation) at point B will be subtracted from the deformations at points C, D, and E. Only the plastic deformation beyond point B will be exhibited by the hinge.
• Point C represents the ultimate capacity for pushover analysis.
• Point D represents the residual strength for pushover analysis.
• Point E represents total failure. Beyond point E the hinge will drop load down to point F (not shown) directly below point E on the horizontal axis.
No n -lin ear d y n amic an aly s is
Nonlinear dynamic analysis utilizes the combination of ground motion records with a detailed structural model, therefore is capable of producing results with relatively low uncertainty. In nonlinear dynamic analyses, the detailed structural model subjected to a ground-motion
In non-linear dynamic analysis, the non-linear properties of the structure are considered as part of a time domain analysis. This approach is the most rigorous, and is required by some building codes for buildings of unusual configuration or of special importance.
A b o u t Etab s
ETABS is a sophisticated, yet easy to use, special purpose analysis and design program developed specifically for building systems. ETABS Version 9 features an intuitive and powerful graphical interface coupled with unmatched modeling, analytical, and design procedures, all integrated using a common database. Although quick and easy for simple structures, ETABS can also handle the largest and most complex building models, including a wide range of nonlinear behaviours, making it the tool of choice for structural engineers in the building industry.
Need Fo r In v es tig atio n
The widespread damage especially to RC building during Bhuj earthquake exposed the construction practices being adopted in India and generated a great demand for seismic evaluation and up-gradation of RC buildings. The RC building can become seismically deficient since seismic design modal requirements are constantly revised due to extensive experimental investigations in the research fields. Performance-based design is experiencinga rapid development in recent years. This concept provides a new approach for establishing design objectives and desired performance levels for new and existing buildings. Seismic deficient buildings are being upgraded using performance-based design.
A ims A n d Ob jectiv es Of Th e Stu d y
1) To analyze the seismic behaviour of 10 and 15 storied RC framed building using pushover analysis procedure.
Available online: https://edupediapublications.org/journals/index.php/IJR/ P a g e | 4759
3) Determination of performance point of the
building to suggest retrofitting techniques.
4) To study the effect of shear walls as a method of retrofitting.
Sco p e Of Th e Stu d y
The scope of the present study is limited to building the model, generating the load cases and to carry-out the analysis for 10 and 15 storied buildings both symmetrical in plans and are carried out with shear walls and without shear walls using ETABS Version 9.7.3.
Su mmary
In this chapter, various types of analysis and importance of ETABS are discussed. The scope and objective is also been discussed. Based on the objective of the present study, research papers were collected and studied thoroughly. The review of research papers is discussed in the chapter named as literature review
2 Literature Review
Ch attopadhyaya and Sengup ta (2011) studied on a 4-storyed regular RC building was considered for comparative study of the options of modeling a shear wall for pushover analysis. The modeling of shear wall was studied for seismic loads along one direction. He concluded that modeling of tall and solid shear wall using column element is adequate for pushover analysis, provided the hinge properties are defined properly. Modeling a shear wall using fiber-based wall element is rigorous. Since it is computationally intensive, it need not be used for pushover analysis of a building with a solid shear walls.
Ch an d ras ekaran an d Gu p ta (2013) focuses on pushover analysis of multistory RC framed buildings subjecting them to monotonically increasing lateral forces with an invariant height wise distribution until the preset performance level (target displacement) is reached. The studies conducted highlight the superiority of MPA while bringing out
the significant higher mode participation in evaluating the seismic demands. The results also show that MPA agrees closely with that of the response behavior obtained through nonlinear response history analysis (NLRHA). The study conducted lead to some main conclusions: i) the MPA results closely agree with that of NLRHA and hence shall be looked upon as a reliable alternative, ii) MPA brings out the significant contribution of higher modes in seismic demand estimation,
iii) MPA shows conservative results compared to NLRHA.
3Shear Walls
In tro d u ctio n
Shear walls are vertical elements of the horizontal force resisting system. The reinforced concrete shear wall is important structural elements placed inmulti-storey buildings which are situated in seismic zones because they have a highresistance to lateralearthquake loads. RC shear walls must have sufficient ductility to avoid brittle failure under the action of strong lateral seismic loads. In residential construction, shear walls are straight external walls that typically form a box which provides all of the lateral support for the building. When shear walls are designed and constructed properly, and they will have the strength and stiffness to resist the horizontal forces.
Available online: https://edupediapublications.org/journals/index.php/IJR/ P a g e | 4760
Classification Of Shear Walls
Simple rectangular types and flanged walls Coupled shear walls
Framed walls with in filled frames Core type shear walls
Ty pes Of Shear Walls
RC Shear Wall Plyood Shear Wall Mid ply Shear Wall
RC Hollow Concrete Block MasonrWall Steel Plate Shear Wall
RC s h ear wall
RC Shear Wall consists of reinforced concrete walls and reinforced concrete slabs. Wall thickness varies from 140 mm to 500 mm, depending on the number of stories, building age, and thermal insulation requirements. In general, these walls are continuous throughout the building height; however, some walls are discontinued at the street front or basement level to allow for commercial or parking spaces. Usually the wall layout is symmetrical with respect to at least one axis of symmetry in the plan.
Fig u re 4 R.C s h ear wall
Ply wood shear wall
Plywood is the traditional material used in the construction of Shear walls. The creation of prefabricated shear panels have made it possible to inject strong shear assemblies into small walls that fall at either side of a opening in a shear wall.
Fig u re 5 Ply wo o d s h ear wall
M id ply shear wall
The midply shear wall is an improved timber shear wall that was developed by redesigning the joints between sheathing and framing members, so that the failure modes observed in standard wall testing are virtually eliminated at lateral load levels high enough to cause failures in standard wall.
RC Ho llo w concrete block masonry walls
RHCBM walls are constructed by reinforcing the hollow concrete block masonry, by taking
advantage of hollow spaces and shapes of the hollow
blocks. It requires continuous
steelrods(reinforcement) both in the vertical and horizontal directions at structurally critical locations of the wall panels, packed with the fresh grout concrete in the hollow spaces of masonry .
Steel p late s h ear wall
Available online: https://edupediapublications.org/journals/index.php/IJR/ P a g e | 4761
Fig u re 6Plate s h ear wall
4 Methodology
The use of the nonlinear static analysis (pushover analysis) came in to practice in 1970‟ s but the potential of the pushover analysis has been recognized for last two decades years. This procedure is mainly used to estimate the strength and drift capacity of existing structure and the seismic demand for this structure subjected to selected earthquake. This procedure can be used for checking the adequacy of new structural design as well. The effectiveness of pushover analysis and its computational simplicity brought this procedure in to several seismic guidelines (ATC 40 andFEMA 356) and design codes (Euro code 8 and PCM 3274) in last few years.
Ro le Of Pu s h o v er A n aly s is
Performance based approach requires a non-linear lateral load verses deformation analysis.
The pushover analysis is a static method of non-linear analysis. The pushover analysis is an elegant method to observe the successive damage states of building states of a building both in the existing condition and a proposed retrofit scheme. It addresses the deficiencies of an elastic analysis by the following features.
The analysis considers the inelastic deformation and ductility of the members. The sequence of yielding of sections in the
members and subsequent redistribution of loads in the building are observed.
Pu rp o s e Of Pu s h o v er A n aly s is
The purpose of pushover analysis is to evaluate the expected performance of structural
systems by estimating performance of a structural system by estimating its strength and deformation demands in design earthquakes by means of static inelastic analysis, and comparing these demands to available capacities at the performance levels of interest. The evaluation is based on an assessment of important performance parameters, including global drift, inter story drift, inelastic element deformations (either absolute or normalized with respect to a yield value), deformations between elements, and element connection forces (for elements and connections that cannot sustain inelastic deformations). The inelastic static pushover analysis can be viewed as a method for predicting seismic force and deformation demands, which accounts in an approximate manner for the redistribution of internal forces that no longer can be resisted within the elastic range of structural behavior.
5Numerical Study
Bu ild in g Des crip tio n
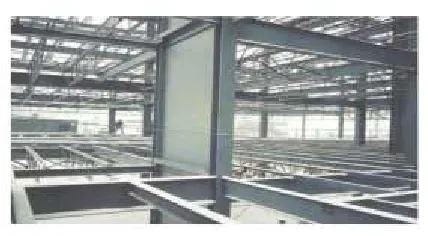
In the present work, a 10 storied and 15 storied reinforced concrete frame building situated inzone V, is taken for the purpose of study. The plan area of building is 20 x 20m with 2m as plinth level and 3m as height of each typical storey. It consists of 5 bays in X-direction and 5 bays in Y-direction. The total heights of the buildings were 32m and 47m.
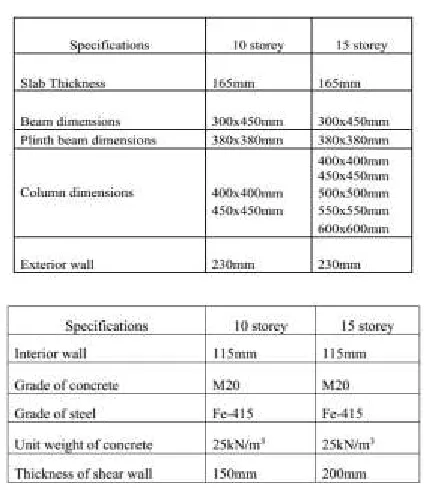
Structural System Of The Building
The column, beam and wall dimensions are
detailed in the below tables:
Available online: https://edupediapublications.org/journals/index.php/IJR/ P a g e | 4762
Table 3Design variables for analysis
Pu shover Analysis Using Etabs V9.7.3
Fig u re 7 Pu s h o v er A n aly s is
Fig u re 8 Dis p lacemen t s p ectru m cu rv e o f s y mmetrical 10 storied building with shear walls fo r
1% d rift
Fig u re 9 Dis p lacemen t s p ectru m cu rv e o f s y mmetrical 10 storied building with shear walls fo r
2% d rift
Fig u re 10 Dis p lacemen t s p ectru m cu rv e o f s y mmetrical 15 storied building with shear walls fo r
Available online: https://edupediapublications.org/journals/index.php/IJR/ P a g e | 4763
Fig u re 11 Dis p lacemen t s p ectru m cu rv e o f
s y mmetrical 15 storied building with shear walls fo r 2% d rift
6Results And Discussions
Gen eral
In this chapter, the structure is modelled for 10 and 15 storied building considered in zone V which is symmetrical in plan. A non-linear static analysis is performed in ETABS v9.7.3 and the results are generated in the form of pushover curveswhich are presented here. The same building is analyzed by taking symmetric condition and analyzed after applying retrofitting.
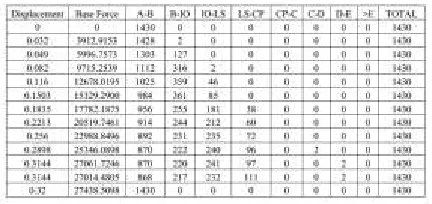
Res ults Obtained For A 10-Storied Bu ild in g In itial Drift 1%
Tab le 4 Pushover curve for a 10-storied symmetrical b u ild in g fo r d rift 1%
Tab le 5 Capacity spectru m cu rv e fo r a 10-s to ried s y mmetrical b u ild in g fo r d rift 1%
Res ults Obtained For A 10-Storied Bu ild in g In itial Drift 2%
Tab le 6 Pushover curve for a 10-storied symmetrical b u ild in g fo r d rift 2%
Tab le 7 Capacity spectrum cu rv e fo r a 10-s to ried s y mmetrical b u ild in g fo r d rift 2%
Res ults Obtained For A 15-Storied Bu ild in g In itial Drift 1%
Tab le 8 Pushover curve for a 15-storied symmetrical b u ild in g fo r d rift 1%
Tab le 9Capacity sp ectru m cu rv e fo r a 15-s to ried s y mmetrical b u ild in g fo r d rift 1%
Res ults Obtained For A 15-Storied Bu ild in g In itial Drift 2%
Tab le 10 Pu s h o v er cu rv e fo r a 15-s to ried s y mmetrical b u ild in g fo r d rift 2%
Available online: https://edupediapublications.org/journals/index.php/IJR/ P a g e | 4764
Sto rey Drifts Fo r 10 & 15 Sto ried Bu ild in g
Tab le 12 Sto rey d rifts o f v ario u s s to rey lev els
Fig ure 12 Drifts of 10-storied building in x-directio n
Tab le 13 Drifts o f v ario u s s to rey lev e
Fig ure 13 Drifts of 15-storied building in x-directio n
DISPLA CEM ENTS FOR 10 & 15 STORIED BUILDING
Tab le 14Roof displacements of various storey lev els
Available online: https://edupediapublications.org/journals/index.php/IJR/ P a g e | 4765
Tab le 14 Roof displacements of various storey levels
Fig ure 15 Displacements of 15-storeied building in x-d irectio n
7. Conclusions
When a 10 and 15 storied buildings are pushed to 1% transient drift (0.32m,0.47m), the performance of the building lies between Immediate Occupancy and Life Safety levels even with increase in the storey height. In the present case study, both the buildings have moderate resistance.
The drift index of 10 and 15 storied buildings are 0.00406 and 0.00415 which is below the permissible index value of 0.005(for no damage as per ATC-40). It infers that the lateral displacement of the structure is well within permissible limits and no damage occurs as a whole.
When a 10 and 15 storied buildings are pushed to 2% transient drift(0.64m,0.94m), the performance of the building lies between Life Safety and Collapse Prevention levels even with increase in the storey height. In the present case study, both the buildings have poor resistance.
The drift index of 10 and 15 storied buildings are 0.00445 and 0.00459 which is below the permissible index value of 0.005(for
no damage as per ATC-40). It infers
that the lateral displacement of the structure is well within permissible limits and no
damage occurs as a whole.
The observed displacements at terrace level for a 10 storied building without shear wall were 161mm. When shear wall was introduced to the structure displacement was drastically reduced to 34.9mm. It infers that the structure is well within permissible
limits and no damage occurs as a whole. The observed displacements at terrace level
for a 15 storied building without shear wall were 271mm. When shear wall was introduced to the structure displacement was drastically reduced to 72.5mm. It infers that the structure is well within permissible
limits and no damage occurs as a whole.
Sco p e Fo r Fu tu re Stu d y
The Study can be extended to a non-linear time history analysis of the building. Modeling of shear walls with openings, coupled shear walls, flanged walls and core walls can also be studied.
Su mmary
This Chapter, details the discussions drawn based on the present work and the scope of the further study and Investigation based on the present study was discuss
Available online: https://edupediapublications.org/journals/index.php/IJR/ P a g e | 4766
1. Habibullah and Stephen Pyle (1998), “Practical
Three Dimensional Nonlinear Static Pushover Analysis”, Published in Structure Magazine, winter.
2. Kadid A and Boumrkik A (2008), “Pushover Analysis of Reinforced Concrete Framed Structures”, At Department of civil Engineering, University of Banta, Algeria, Asian journal of civil engineering Vol. 9(1),pp. 75-83.
3. Monavari B, Massumi A, Kazem A (2008), “Estimation of Displacement Demand in RC Frames and Comparing with Target Displacement” Provided by FEMA-356, 15th World Conference on Earthquake Engineering, 24th to 28th, Lisbon, Portugal.
4. Onur Merter and Taner Ucar (2010), “A Comparative Study on Nonlinear Static
and Dynamic Analysis of Frame Structures”, Journal of civil Engineering and Science, Vol. 2(3), pp. 155-162.
5. Sudipta Chattopadhyaya and Alman K Sengupta (2011), “Modeling of Tall Shear Walls for Non-linear Analysis of RC Buildings under Cyclic LateralLoading”, The Indian Concrete journal, Vol. 85( 8), pp. 38-40.
6. Mitchalis Fragiadakis, Dimitrios Vamvatsikos, Mark Ascheim (2011), “Application for Seismic Assessment of Regular RC Moment Frame Buildings", Department of Civil and Environmental Engineering, University of Cyprus. Vol. 5(4), pp. 20-29.
7. A. Cinitha, P.K. Umesha, Nagesh R. Iyer (2011), “Non linear Static Analysis to Assess Performance and vulnerability of Code- Conferring RC buildings”, wseas transactions on applied and theoretical mechanics, Vol.7(1), pp. 39-48.
8. S.I. Khan and P.O. Modani (2012), “Seismic Evaluation and Retrofitting of RC Building by Using Energy Dissipating Devices”, International
Journal of Engineering research and Applications, Vol. 3(3), pp. 1504-1514.
9. Chopra, A.K and Rakesh K.G (2012), “Capacity-Demand-Diagram Methods Based on Inelastic Design Spectrum”, Earthquake Spectra, Vol. 5(4), pp. 45-52. 57