A Method for Estimating the Low Frequency Coupling
Characteristics of a Ferrite-Cored Rod Antenna to a Long Conductor
Jingcheng Li*, Jacob L. Carr, Chenming (Jim) Zhou, Miguel A. Reyes, and James D. Noll
Abstract—Magnetic proximity detection systems (PDSs) used in underground mines occasionally generate false alarms when the miner-wearable component (MWC) is close to nearby conductors such as power cables. This is because the signals from the generators (antennas) of the PDS wirelessly couple to nearby cables, travel along these cables, and then couple back from the cable to a distant MWC to cause a false alarm. In order to manage such a false alarm, it is necessary to understand the basic near-field coupling characteristics from a generator to a long wire. Researchers from the National Institute for Occupational Safety and Health (NIOSH) have developed a method to measure such coupling characteristics for a ferrite-cored antenna to a straight wire. The method is introduced in this paper along with the test results.
1. INTRODUCTION
The coupling of electromagnetic (EM) fields to nearby long conductive lines is of great interest in many applications. EM coupling to micro-strip in integrated circuitry is part of the focus in microwave engineering [1]. EM coupling to long AC power transmission lines due to lighting strikes has been an area of extensive research to prevent power systems from being damaged by the high EM energy coupled to the lines [2–9]. The generalized theoretical study of EM coupling to a wire is described in [10– 12]. A model developed for the coupling from a small coil antenna to two parallel wires is described in [12]. These studies of electromagnetic coupling to lines are of practical interest to engineers concerned with predicting the effects of coupled EM energy to the electrical and electronic systems used in close proximity to these lines.
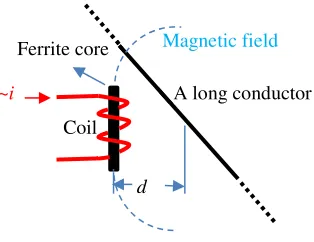
In this paper, an indirect method to experimentally measure the voltage induced on a long thin wire by a magnetic field generated from a small ferrite-cored coil antenna, as illustrated in Figure 1, is introduced. The method was developed by the National Institute for Occupational Safety and Health (NIOSH) researchers in the coupling study. The coupling characteristics are derived from the induced voltages that would exist in the line. In Figure 1, i is the current flowing through the antenna; this current excites a magnetic field. The EM energy couples to the long conductive wire spaced at a distance,
d, from the antenna and perpendicular to the antenna. As shown in [12], the induced voltage will be produced along the wire. Although it is known that this induced voltage exists, directly measuring the induced voltage is impractical because the induced voltage on the leads of a voltage meter cannot be effectively separated from the induced voltage on the wire. An indirect measurement method is thus developed in this study.
Received 15 August 2018, Accepted 13 October 2018, Scheduled 16 November 2018 * Corresponding author: Jingcheng Li ([email protected]).
A long conductor
Coil Ferrite core
d
~i
Magnetic field
Figure 1. Inductive coupling from a ferrite-cored antenna to a long conductor line.
2. BACKGROUND
Since 1984, there have been 44 fatalities involving the striking and pinning of operators and other workers by continuous mining machines (CMMs), and according to the Mine Safety and Health Administration (MSHA) database, 34 fatal accidents in underground coal mining have occurred since 2000 involving collisions with mobile equipment such as shuttle cars, scoops, and ram cars. One method used to prevent many of these accidents from happening is to utilize a magnetic proximity detection system (PDS).
A magnetic proximity detection system with an operating frequency often below 100 kHz can be mounted on a machine to constantly monitor the proximity of miners working near the machine and who may be at risk of being struck or pinned by the motion of the machine. These systems use machine-mounted generators (transmitting antenna) and worn-receivers, referred to as the miner-wearable component (MWC). The generators create radio frequency (RF) magnetic fields to cover the area surrounding the machine. The MWC worn by a worker continuously detects the magnetic field, and the proximity detection system determines the distance between the person and the machine with the measured magnetic flux density B.
Some machines such as CMMs have high voltage electrical cables attached to provide AC power. Due to space restrictions in the underground mine environment, the cables connected to various machines can run close to each other. Those cables can act as long receiving antennas to pick up signals from the generators of a nearby PDS through electromagnetic (EM) coupling. The coupled signals can propagate along these cables for a distance, and then be received by an MWC near the cables. Under certain conditions, these coupled signals can be strong enough to trigger an alarm causing the machine to shut down, even though the MWC is at a safe distance away from the machine. Nuisance alarms caused by unintentional magnetic signals coupled to a trailing cable pose a safety concern in underground coal mines. Researchers at NIOSH recently investigated the conditions under which a magnetic signal was coupled to a trailing cable connected with a commercial PDS. As a result of the investigation, a three-stage coupling model was proposed and the coupling effects were characterized. Mitigation strategies were also developed [13].
Signals from magnetic proximity detection systems have also been found to couple onto nearby steel wire mesh and alter the local magnetic field near the mesh, resulting in a change in the calculated location of an MWC positioned in close proximity to the mesh. In mines, steel wire mesh is affixed to the vertical and overhead surfaces of the underground opening to retain loose rocks and prevent them from falling on miners working in the mine.
The EM coupling creates unfavorable effects for proximity detection systems. However, the effects of coupling can be favorable for other applications in underground mine. Namely, medium frequency (MF) (300 kHz–3 MHz) communication systems used in underground coal mines take advantage of EM coupling to enable long distance communication. The operating frequency of an MF communication system used in underground mines is often below 500 kHz. The signal from an MF transmitting antenna can couple to long conductors such as AC power cables, land phone wires, and trolley cables. The signals can then travel along these conductors for kilometers in the underground openings before being received by a distance MF receiver near the conductors [14–17].
systems have one thing in common: they are constructed with a coil wound around a ferrite rod core. The operating frequencies of these systems range from tens of kHz to hundreds of kHz. Within an underground coal mine, it is not uncommon for these generators and antennas to be within a meter of cable lines or long wires due to space restrictions. Understanding the basic coupling characteristics of a ferrite-cored antenna to a nearby long wire in this frequency range is essential to developing methods to reduce the adverse effects of such coupling on proximity detection system performance and to optimize coupling efficiency for communication systems that rely on coupling. NIOSH researchers have thus developed a method to experimentally measure the coupling characteristics from a ferrite-cored antenna to a long wire. The method along with the experimental results is introduced in this paper.
3. METHOD DEVELOPMENT
Several considerations were taken into account during the development of the indirect method to measure the induced voltage on a long conductor near a ferrite-cored antenna. The maximum distance, dmax, between the transmitting antenna and the wire is set to be a meter since this distance is of greatest interest in underground mining applications. Only signal frequencies below 650 kHz are considered as operating frequencies used in currently available proximity detection systems and MF communication systems are all well below this frequency. A magnetic wave for a frequency below 650 kHz can be hundreds or thousands of times longer thand. Therefore, the magnetic field propagation time would be negligible for these measurements. Similarly, the nulls in the magnetic wave are not considered in this method because they occur far from the antenna.
The magnetic field generated by an antenna is non-uniformly distributed in the space around the antenna. Close to the antenna, the magnetic flux density, B, is high, and it decreases with increasing distance from the antenna. The induced voltage on a line is, therefore, non-uniformly distributed and can be obtained as the integral over the total length of the line [12]. The Maxwell-Faraday law is used to describe this induction.
The Maxwell-Faraday equation as shown in Equation (1) governs inductive coupling [18, 19]. Equation (1) states that the total voltage induced, v, in a closed wire loop is proportional to the rate of change of total magnetic flux enclosed by the loop. In (1), the vector E is the electric field strength produced on the infinitesimal length vector, dl, of the wire in length oflby the magnetic field changing with time; andB is the magnetic flux density vector through the infinitesimal surface ds.
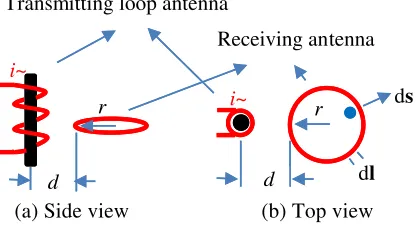
Figure 2 graphically illustrates such a coupling scenario from a ferrite-cored rod antenna to an air-cored circular antenna with a radius of r. The distance between the center of the ferrite-cored antenna and the edge of the air-cored circular loop antenna is d. The induced voltage on the circular loop antenna, according to (1), will be v. This induced voltage on such a loop can be experimentally measured with a voltage meter at a small opening in the circular antenna.
v =
E·dl=−d dt
B·ds (1)
The receiving circular antenna shown in Figure 2 is by no means a straight wire. However, when
r approaches infinity, the circular antenna approaches a straight line, and the induced voltage on it
d r
d r
(b) Top view i~
i~ Transmitting loop antenna
Receiving antenna
dl ds
d r
d r i~
i~ Transmitting loop antenna
Receiving antenna
dl ds
(a) Side view
approaches the maximum at the given distance of d from the transmitting antenna to a straight line. In this paper, this maximum voltage is defined as the induced voltage from a ferrite-cored antenna to a straight line at the distanced.
From a practical standpoint, it is still difficult to construct a circular antenna with a radius large enough to be considered to approach infinity. However, a series of smaller circular antennas can be constructed with progressively larger radii, rk,k= 1,2, . . . , n, from which a series of induced voltages,
vr1, vr2, . . . , vrn, can be obtained, as illustrated in Figure 3. With these induced voltages measured, a converging function, v(r) as shown in the right-hand side of Eq. (2), for induced voltage with respect to a loop radius of r can be constructed. The maximum induced voltage, V, on the straight wire can thus be obtained from Eq. (2) by finding the limit as r→ ∞ at the given distance d. This is the basic concept for the method developed.
V = lim
r→∞v(r) (2)
Experimental data show that with a given antenna current, the voltage function can be empirically modeled as the function v(r), which has a form given in Eq. (3), and in whichA is a positive constant in volts, and M is also a positive constant in units of inverse length. M is the change rate of induced voltage with the circular antenna radius. The maximum induced voltage V on the straight wire is then
A, obtained from Eq. (4) for the given distance dfrom the transmitting antenna to the straight wire.
v(r) = A1−e−M r (3)
V = lim
r→∞v(r) = limr→∞A
1−e−M r=A (4)
Repeating this process with the same antenna current and various values of d yields a series of voltages induced on the wire,Vd1,Vd2, . . . , Vdn. With a sufficient number of induced voltages obtained, a function of induced voltage u(d) with respect to the distance between the ferrite-cored antenna and the wire can be constructed. Modeling from experimental data shows that the function can be expressed in the form shown in Eq. (5). Here, C is a constant in unit of voltage, andK is a constant of change rate of the induced voltage on the wire with respect to d. Both constants are dependent on electrical and magnetic properties of the ferrite-cored antenna and antenna current. The expression (6) can be used to obtain the coupling characteristics, cch(d), which are independent of the given current in the
d
r1
i~ r2
r V
=
vr∞vr
1 vr2
rn
vr n
∞
Figure 3. Illustration showing the in-duced voltages vr1, vr2, . . . , vrn, . . . , vr∞ on a
series of the loop antennas with radii of
r1, r2, . . . , rn, . . . , r∞(r → ∞) shared with the same tangential point at the distance d from the ferrite-cored antenna.
d i~
V = v
Φ r∞
ferrite antenna. In Eq. (6), d0 is a reference distance between the ferrite-cored antenna and the wire.
u(d) = Cd−K (5)
cch(d) = 20 log10
u(d)
u(d0)
(6)
An inspection of Figure 3 reveals that the voltage on the straight wire is induced from the total magnetic flux Φ over the entire area on the right-hand side of the wire, which is shown as the shaded area in Figure 4. This suggests that induced voltages from a series of square receiving antennas with different side lengths of s, instead of circles, can also be used to construct the induction function as shown in Figure 5. As the side length s approaches infinity, the magnetic flux, Φ, also approaches an area covering the entire area on the right-hand side of the wire. In this case, Eqs. (2), (3), and (4) need to be slightly modified to Eqs. (7), (8), and (9), respectively, in whichsdenotes the variable of the side length of the progressively larger square receiving antennas.
V = lim
r→∞v(s) (7)
v(s) = A1−e−M s (8)
V = lim
s→∞v(s) = lims→∞A
1−e−M s=A (9)
d
s1
i~
s2
s
V = vs∞
vs
1
vs
2
sn
vs
n
Φ
∞
Figure 5. Induced voltages vs1, vs2, . . . , vsn, . . . , vs∞ from a series of square antennas with the corresponding side lengths ofs1, s2, . . . , sn, . . . , s∞.
4. EXPERIMENT
Antenna 1 Antenna 2
Figure 6. Two ferrite-cored antennas with core dimensions of 25.4 mm×190.5 mm (Antenna 1) and 76.2 mm×457.2 mm (Antenna 2).
Agilent 22330A signal generator
2010L RF power amplifier
d
s1
i~
s2
vs1
vs2 S18
vs18
...
Fluke 125 multimeter
Transmitting loop antenna
Current probe
18 square receiving antennas
Fluke 125 multimeter (V~)
C
Figure 7. Experimental system for obtaining induced voltages from a ferrite-cored antenna to square antennas.
voltage was to be measured on that particular antenna. AWG 22 (0.644 mm diameter) of multiple string copper wire was used to construct the square antennas.
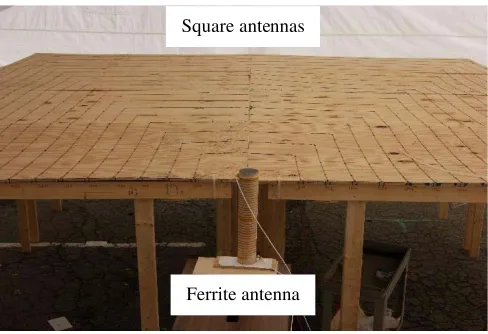
The photo in Figure 8 shows the square antennas on the platform. The current flowing through the transmitting antenna was monitored with a current probe and measured with a Fluke 125 multimeter. A constant current was maintained throughout the process of voltage measurements on all of the square antennas for all of the distances ofdat a given frequency for each of the transmitting antennas.
The experiment site was a parking lot with the ground covered with an asphalt surface. The site was selected because it had no large metal masses nearby. Before conducting the experiment, a pre-experiment system test was conducted to determine what, if any, impact the ground had on the measurements of induced voltage. In this pre-experiment test, a small platform 2.44 m×2.44 m was set at heights of 0.4 m and 1.2 m from the ground, successively, to obtain two sets of induced voltage data from nine square antennas, with their side lengths of 500 mm, 750 mm, 1000 mm, 1250 mm, 1500 mm, 1750 mm, 2000 mm, 2250 mm and 2410 mm. Eight distances were used between the transmitting and the square antennas: 160 mm, 200 mm, 250 mm, 300 mm, 350 mm, 400 mm, 450 mm, and 500 mm. 300 kHz was chosen as a test frequency in this pre-experiment test. The induced voltages on the square antennas at each given distance between the transmitting and square antennas at heights of 0.4 m and 1.2 m from the ground were compared. The average difference was 0.41%, the maximum was 1.31%, and the minimum was 0.26% with the majority of the differences falling below 1%. These results suggested that the impact of the ground could be negligible.
A larger plywood platform of 4.86 m×4.86 m was then constructed to accommodate additional square antennas. In addition to the original eight antennas with side lengths of 500 mm, 750 mm, 1000 mm, 1250 mm, 1500 mm, 1750 mm, 2000 mm, and 2250 mm, an additional 10 antennas were constructed with side lengths of 2500 mm, 2750 mm, 3000 mm, 3250 mm, 3500 mm, 3750 mm, 4000 mm, 4250 mm, 4500 mm, and 4750 mm. The platform was elevated to 1.85 m to make it easy to connect the pieces of wires from underneath the platform to form a complete square antenna under measurement and disconnect them after completion of the measurement.
The experiment began with a distance, d1, set between the transmitting antenna and square antennas. The induced voltage on each of the square antennas was measured one after another at this distance. This procedure was then repeated for different distances,d2, d3, . . . , d10, at the same frequency. After that, the same procedure was repeated for another frequency and another antenna. The induced voltages were used to derive the coupling characteristics for each of the ferrite-cored antennas at the given frequencies.
Ferrite antenna Square antennas
Figure 8. Square loop antennas on the platform 1.85 m from the ground.
5. RESULTS
In the experiment, the current to Antenna 1 was maintained at 4.363 A with 73 kHz and then at 1.758 A with 300 kHz. Figure 9 shows two sample sets of the measurements of the induced voltages on the square antennas at d = 460 mm between Antenna 1 and the square antennas at 73 kHz and 300 kHz. Their data fit model functions are also given as a plot in the figure with their expressions in Eqs. (10) and (11) for 73 kHz and 300 kHz, respectively. Consequently, the maximum voltages of these can be obtained from Eqs. (12) and (13) for 73 kHz and 300 kHz, respectively. These expressions give the solutions of 0.5586 V for 73 kHz and 0.8487 V for 300 kHz atd= 460 mm.
v73-kHz(s) = 0.5586
1−e−0.000584s, sin mm (10)
v300-kHz(s) = 0.8467
1−e−0.000561s, sin mm (11)
V73-kHz = lim
s→∞0.5586
1−e−0.000584s= 0.5586 V (12)
V300-kHz = lim
s→∞0.8487
1−e−0.000561s= 0.8487 V (13)
Following this procedure, the total of ten maximum line voltages were thus obtained for ten different distances,d1, . . . , d10; these are shown graphically in Figure 10. The blue diamond markers in the figure represent the line voltages for 73 kHz, and the square red markers for 300 kHz. The induced voltage functions obtained from both sets of the voltage data are given in Eqs. (14) and (15) for 73 kHz and 300 kHz, respectively. All of these empirical data shown here fit the form shown in Eq. (5). These coupling functions were valid only for the currents applied to the transmitting antenna. To make them current-independent, a reference voltage v0(d0) at reference distance d0 = 0.16 m was selected, and Eq. (6) was applied to obtain Eqs. (16) and (17) for 73 kHz and 300 kHz, respectively; these are their respective coupling characteristics (cch) functions with respect todindependent of the current.
u73-kHz(d) = 0.2862d−0.918, din m (14)
u300-kHz(d) = 0.4426d−0.902, din m (15)
cch−73-kHz(d) = 20 log10
u73-kHz(d) u73-kHz(d0)
=−18.36 log10(d)−14.61 dB (16)
cch−300-kHz(d) = 20 log10
u300-kHz(d) u300-kHz(d0)
=−18.04 log10(d)−14.46 dB (17)
Figure 9. Induced voltages on the square antennas at a distance of 460 mm from Antenna 1 at 73 kHz and 300 kHz with the data fit curves.
Figure 10. Maximum line voltages at 73 kHz and 300 kHz and their models for Antenna 1.
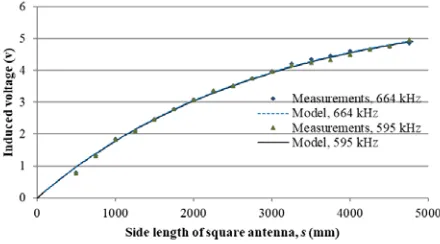
Figure 11. Induced voltages on the square antennas at d = 610 mm from Antenna 2 at 595 kHz and 664 kHz with the data fit curves.
Figure 12. Comparison of the coupling
characteristics of two antennas to the line at different frequencies.
characteristics functions with this antenna were obtained in a similar process and are given in Eqs. (20) and (21).
Figure 12 provides a graphic comparison of the coupling characteristics functions of Eqs. (16), (17), (20), and (21). They are all independent of their individual exciting sources.
v595-kHz(s) = 6.0626
1−e−0.00035s, sin mm (18)
v664-kHz(s) = 6.0682
1−e−0.00035s, sin mm (19)
cch−595-kHz(d) = −16.32 log10(d)−9.826 dB, din m (20) cch−664-kHz(d) = −16.26 log10(d)−9.789 dB, din m (21)
6. DISCUSSION
antenna can increase the energy coupled to a nearby line if the coupling is desirable in a communication system.
Figure 12 also shows the similar coupling characteristics for two different frequencies for a given antenna. This suggests that the electromagnetic properties (including permeability) of the medium of the magnetic field are the major influential factors to the coupling characteristics for a given antenna. In this experiment, most of the medium was air, and a small part of it was composed of asphalt and soil. These materials have relative permeability µ ≈ 1 with a low conductivity for the frequencies tested. Because air has almost the same electromagnetic properties in a much wider frequency range than that used in this experiment, this suggests that the coupling characteristics would be expected to be similar over a wide frequency range for a given antenna having a fixed permeability for its core.
Although the experiment showed similar coupling characteristics for frequencies for a given antenna, as shown in Figure 9, the induced voltage can vary with frequency. The higher the frequency, the higher the induced voltage that was measured. In this case, the exciting current for 300 kHz was even lower than that for 73 kHz. This is because the induced voltage on a line is proportional to the magnetic flux change rate (dΦ/dt) according to the Maxwell-Faraday law. For a situation in which the coupling can potentially cause systems to malfunction, shifting the system operating frequency downward may result in lowering the induced voltage. On the other hand, shifting the operating frequency upward may result in boosting the induced voltage.
Lastly, several cables can often be found in a mine tunnel, and each of them can be positioned at a different relative orientation to and at different distances from antennas in the mine. The coupling characteristics of each scenario can be determined individually with the procedures introduced in this paper.
7. LIMITATIONS
This paper presents the test results from only one experimental setup. In this setup, the antenna was perpendicular to the line. The procedures introduced in this paper can apply to a setup in which the antenna can be at any orientation. The coupling characteristics obtained would then be expected to be different from those obtained in this experiment. Nevertheless, the results presented in this paper can serve as a baseline for reference.
One major limitation of the method presented in the paper was that this method was designed for low-frequency coupling measurement and has been used to obtain the coupling characteristics for a signal below 664 kHz. Its validity needs to be tested if a higher frequency signal is used.
Another limitation is that for an experimental system set in an open space, a high current may be required to the transmitting antenna in order to produce a strong magnetic field. A high signal-to-noise ratio for induced voltage on the square antennas can, then, be maintained because the square antennas can also pick up signals from nearby AM radio stations and other environmental electromagnetic noise. A final limitation is that observation showed that daily temperature fluctuations caused the antenna current to fluctuate for the system set in an open space resulting in a fluctuation of induced voltage measurements. A frequent current adjustment may be needed to maintain steady current if a high daily ambient temperature swing is encountered.
8. CONCLUSIONS
A method to experimentally obtain the near-field coupling characteristics from a small ferrite-cored rod antenna to a conductive wire is presented in this paper along with an experimental setup and the experimental results. The method applies to a signal up to the low end of the medium frequency band (less than 644 kHz). The results show that similar coupling characteristics functions were obtained for two signals at two different frequencies with a given transmitting antenna. The results also show that the size of the antenna could affect the coupling characteristics with increasing size correlating to increased coupling. Furthermore, the results showed that a higher induced voltage was associated with a higher frequency for a given antenna.
a communication system) the coupling effect for electrical and electronic systems and devices used in underground mines. Improving the performance of these systems could effectively make underground coal mines more electromagnetically compatible and safer for miners.
9. DISCLAIMER
The findings and conclusions in this paper are those of the authors and do not necessarily represent the official position of the National Institute for Occupational Safety and Health, Centers for Disease Control and Prevention.
Mention of company names or products does not constitute endorsement by NIOSH.
ACKNOWLEDGMENT
The authors would like to express our special thanks to Mr. Timothy J. Lutz, NIOSH mechanical engineer, Mr. Jeffrey A. Yonkey, NIOSH engineering technician, and Bruce Whisner, NIOSH electronic technician for their help in the experimental preparation and experimental platform setup during this study. The authors also wish to take this opportunity to thank Dr. Adam Smith, Deputy Director of Pittsburgh NIOSH’s Mining Research Division, for his invaluable comments and suggestions during this work.
REFERENCES
1. Pozar D. M., “Microwave engineering,” Dielectric Resonator Oscillators of 13.2 Microwave Oscillators, 4th Edition, 617–622, John Wiley & Sons, Inc., Nov. 2011.
2. Piantini A. and J. M. Janiszewski, “Lightning-induced voltages on overhead lines — Application of the extended Rusck model,” IEEE Transactions on Electromagnetic Compatibility, Vol. 51, No. 3, 548–558, Aug. 2009, doi: 10.1109/TEMC.2009.2023514.
3. Poljak, D. and V. Roje, “Time domain modeling of electromagnetic coupling to transmission lines,”1998 IEEE International Symposium on Electromagnetic Compatibility, Vol. 2, 1010–1013, Sept. 1998, doi: 10.1109/ISEMC.1998.750346.
4. Rachidi, F., “A review of field-to-transmission line coupling models with particular reference to lighting-induced voltage,” X International Symposium on Lighting Protection, 67–88, Curitiba, Brazil, Nov. 9–13, 2009.
5. Paolone, M., F. Rachidi, A. Borghetti, C. A. Nucci, M. Rubinstein, V. Rakov, and M. A. Uman, “Lighting electromagnetic coupling to overhead lines: Theory, numerical simulation and experimental validation,” IEEE Transactions on Electromagnetic Compatibility, Vol. 51, No. 2, 532–547, Aug. 2009, doi: 10.1109/TEMC.2009.2025958.
6. Kauun, P. D. and M. J. Thomas, “Lighting induced voltages on multiconductor power distribution line,” IEE Proceedings — Generation, Transmission and Distribution, Vol. 152, No. 6, 855–863, Nov. 4, 2005, doi: 10.1049/ip-gtd:20045090.
7. Rachidi, F., “A review of field-to-transmission line coupling models with special emphasis to lighting-induced voltages on overhead lines,”IEEE Transactions on Electromagnetic Compatibility, Vol. 54, No. 4, 898–911, Aug. 2012, doi: 10.1109/TEMC.2011.2181519.
8. Piantini, A., “Lighting-induced voltages on overhead power distribution lines,” World
Meeting on Lighting, invited paper, Cartagena de Indias, Colombia, Apr. 6–8, 2016,
http://www.acofi.edu.co/womel/.
9. Poljak, D. and K. E. K. K. Drissi, “Electromagnetic field coupling to overhead wire configurations: Antenna model versus transmission line approach,” International Journal of Antennas and Propagation, Vol. 2012, Article ID730145, 18 Pages, 2012, doi: 10.1155/2012/730145.
11. Tkatchenko, S., F. Rachidi, and M. Ianoz, “Electromagnetic field coupling to a line of finite length: Theory, fast iteration solutions in frequency and time domain,” IEEE Transactions on Electromagnetic Compatibility, Vol. 37, No. 4, 509–518, Nov. 1995, doi: 10.1109/15.477335.
12. Smith, A., “The response of two-wire transmission line excited by nonuniform electromagnetic fields of nearby loop,”IEEE Transactions on Electromagnetic Compatibility, Vol. EMC-16, No. 4, 196–199, Nov. 1972, doi: 10.1109/TEMC.1974.303365.
13. Zhou, C., J. Li, N. Damiano, J. DuCarme, and J. Noll, “Influence of trailing cables on magnetic proximity detection systems,”The Proceedings of the Annual Conference of the Society of Mining, Metallurgy and Exploration, 1–6, Minneapolis, MN, Feb. 25–28, 2018.
14. Li, J., B. Whisner, and J. Waynert, “Measurements of medium-frequency propagation characteristics of a transmission line in an underground coal mine,”IEEE Transactions on Industry Applications, Vol. 49, 1984–1991, Sept./Oct. 2013, doi: 10.1109/TIA.2013.2260812.
15. Li, J., J. Waynert, and B. Whisner, “An introduction to a medium frequency propagation characteristic measurement method of a transmission line in underground coal mines,” Progress In Electromagnetics Research B, Vol. 55, 131–149, 2013.
16. Li, J., J. Waynert, and B. Whisner, “Medium frequency propagation characteristics of different transmission lines in an underground coal mine,” International Journal on Communications Antenna and Propagation, Vol. 5, No. 1, 7–15, Feb. 2015, doi: 10.15866/irecap.v5i1.4824.
17. Li, J., M. Reyes, N. Damiano, B. Whisner, and R. Matetic, “Medium frequency propagation characteristics of a lifeline as a transmission line in underground coal mines,”IEEE Transactions on Industry Applications, Vol. 52, No. 3, 2724 – 2730, May/Jun. 2016, doi: 10.1109/TIA.2016.2517599. 18. Griffiths, D. J., Introduction to Electrodynamics, 3rd Edition, 331–333, Pearson Addison Wesley,
Prentice-Hall, Inc., Upper Saddle River, New Jersey, 07458, 1999.
19. Volakis, J. L., Antenna Engineering Handbook, 4th Edition, 59-5, McGraw-Hill Companies, Two Penn Plaza, New York, NY 10121-2298, 2007.