ATLAS Grid Workflow Performance Optimization
Johannes Elmsheuser1,∗, Alessandro Di Girolamo2, Andrej Filipcic3, Antonio Limosani4,
MarkusSchulz2,DavidSmith2,AndreaSciaba2, andAndreaValassi2on behalf of the ATLAS
collaboration
1Brookhaven National Laboratory, Upton, NY, USA 2CERN, Geneva, Switzerland
3Jozef Stefan Institute, Ljubljana, Slovenia 4University of Sydney, Sydney, Australia
Abstract.The CERN ATLAS experiment grid workflow system manages
rou-tinely 250 to 500 thousand concurrently running production and analysis jobs to process simulation and detector data. In total more than 370 PB of data is distributed over more than 150 sites in the WLCG. At this scale small improve-ments in the software and computing performance and workflows can lead to significant resource usage gains. ATLAS is reviewing together with CERN IT experts several typical simulation and data processing workloads for potential performance improvements in terms of memory and CPU usage, disk and net-work I/O. All ATLAS production and analysis grid jobs are instrumented to collect many performance metrics for detailed statistical studies using modern data analytics tools like ElasticSearch and Kibana. This presentation will re-view and explain the performance gains of several ATLAS simulation and data processing workflows and present analytics studies of the ATLAS grid work-flows.
1 Introduction and ATLAS distributed computing
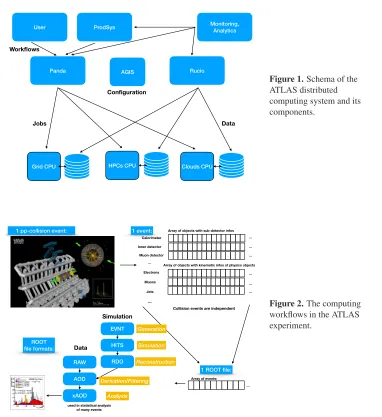
The distributed computing system of the ATLAS experiment [1] as outlined in Fig. 1 is built around the two main components: the workflow management system PanDA [2] and the data management system Rucio [3]. It manages the computing resources to process the detector data at the Tier-0 at CERN, reprocesses it once per year at the Tier-1 and Tier-2 WLCG [4] Grid sites and runs continuous Monte Carlo (MC) simulation and reconstruction. In addi-tion continuous distributed analyses from several hundred ATLAS users are executed. The
resources used are the Tier-0 at CERN and Tier-1/2/3 Grid sites world-wide and
opportunis-tic resources at HPC (High Performance Computer) sites, Cloud computing providers and volunteer computing resources.
Figure 2 shows a schema of the workflows executed on the distributed computing
in-frastructure. The information of the LHC collision events detected by the different ATLAS
sub-detectors are stored in ROOT files [5]. These files are centrally managed and processed
in different MC simulation or data reconstruction steps and workflows before finally analysed
by individual analysers.
Panda Rucio
Grid CPU HPCs CPU Clouds CPU
ProdSys User
AGIS
Workflows
Jobs
Configuration
Data
Monitoring, Analytics
Figure 1.Schema of the ATLAS distributed computing system and its components.
1 pp-collision event:
Calorimeter Inner detector Muon detector
…
Array of objects with sub-detector infos
Electrons Muons
Jets
Array of objects with kinematic infos of physics objects
…
… … …
1 event:
… … …
1 ROOT file:
Array of events: Collision events are independent
RAW
AOD
xAOD
EVNT
HITS
RDO
Data
Simulation
ROOT file formats:
used in statistical analysis of many events
Generation
Simulation
Reconstruction
Derivation/Filtering
Analysis
…
… Figure 2.The computing
workflows in the ATLAS experiment.
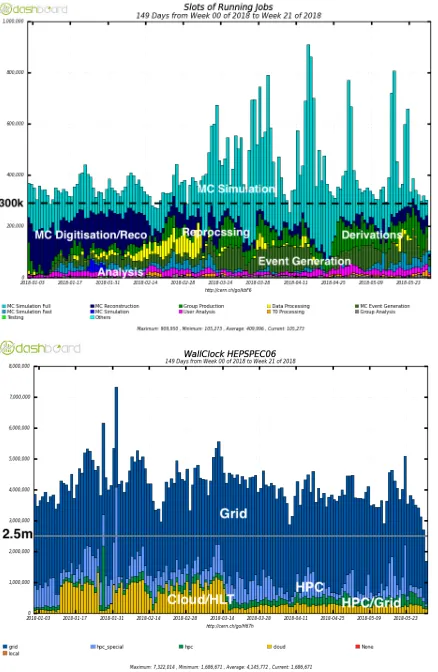
ATLAS has been using much more CPU resources than the officially pledged in 2017 and in 2018 so far (see Fig. 3 top and bottom). The pledge of CPU resources sums up to roughly 250k concurrently running Grid job slots in 2017. In the middle of 2018 the ATLAS data volume exceeds 370 PB in disk and tape storage. The distributed computing system is constantly processing a broad mixture of workflows on a diverse set of resources.
Panda Rucio
Grid CPU HPCs CPU Clouds CPU
ProdSys User
AGIS
Workflows
Jobs
Configuration
Data
Monitoring, Analytics
Figure 1.Schema of the ATLAS distributed computing system and its components.
1 pp-collision event:
Calorimeter Inner detector Muon detector
…
Array of objects with sub-detector infos
Electrons Muons
Jets
Array of objects with kinematic infos of physics objects
…
… … …
1 event:
… … …
1 ROOT file:
Array of events: Collision events are independent
RAW
AOD
xAOD
EVNT
HITS
RDO
Data
Simulation
ROOT file formats:
used in statistical analysis of many events
Generation
Simulation
Reconstruction
Derivation/Filtering
Analysis
…
… Figure 2.The computing
workflows in the ATLAS experiment.
ATLAS has been using much more CPU resources than the officially pledged in 2017 and in 2018 so far (see Fig. 3 top and bottom). The pledge of CPU resources sums up to roughly 250k concurrently running Grid job slots in 2017. In the middle of 2018 the ATLAS data volume exceeds 370 PB in disk and tape storage. The distributed computing system is constantly processing a broad mixture of workflows on a diverse set of resources.
In the middle of 2016 ATLAS computing and software experts together with CERN IT ex-perts started an informal working group to discuss potential optimisations of different work-flows with respect to resource usage and data throughput. Given the large scale of ATLAS distributed computing small improvements in the software and computing performance and workflows can lead to significant resource usage gains. The following sections discuss the tools used to monitor and analyse the workflow performances and provide examples of work-flow improvements.
Figure 3. Top: Number of running jobs by core count and workflow type in the first half of 2018. Bottom: CPU usage normalised to HEPSPEC06 by resource type in the first half of 2018.
2 Workflow examples, metric and typical costs
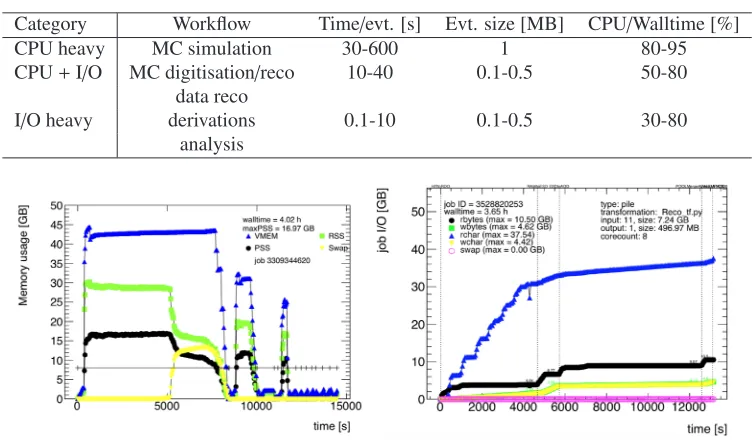
Ideally every workflow has a fast turn-around time with a high processing rate in terms of events/second. But every workflow has some cost in terms of CPU, memory, disk and net-work usage. Table 1 loosely categorises the different main ATLAS workflows in the combina-tion of the three resource types. Network usage is not considered here for now, since all input file access happens locally at the site with pre-placed data. Remote network access inside the workflows happens only during the access to the remote detector conditions database. The workflows can be categorised into either using predominately CPU or disk I/O or a mixture of both, respectively. Workflows are generally not distinguished too much in terms of memory usage, since all workflows should use not more memory than approximately 2 GB/CPU core. Given these categorisation the resource usage optimisation is workflow type dependent.
3 Process memory monitoring
Table 1.Examples of workflows and their categorisation in terms of CPU and I/O costs.
Category Workflow Time/evt. [s] Evt. size [MB] CPU/Walltime [%]
CPU heavy MC simulation 30-600 1 80-95
CPU+I/O MC digitisation/reco 10-40 0.1-0.5 50-80
data reco
I/O heavy derivations 0.1-10 0.1-0.5 30-80
analysis
Figure 4. Left: distribution of the memory usage of an ATLAS data reconstruction jobs over time. Right: the time dependent distribution of the disk I/O for a MC digitisation and reconstruction job.
alone program that can monitor the resource consumption of a process and its children es-pecially in terms of memory and I/O usage. In addition there is a prototype for the process network I/O monitoring in development which is not yet in production use. One of its most useful features is to correctly calculate the proportional set size (PSS) of the used memory in the group of processes monitored, which is a much better indication of the true memory consumption of a group of processes where children share many pages. Detailed informa-tion is collected in the job log files and aggregated informainforma-tion is forwarded to the PanDA monitoring and to the ATLAS analytics platform in elasticsearch [7, 8].
Figure 4 shows the time-dependent measurements using the MemoryMonitor of a data reconstruction (left) and MC digitisation and reconstruction job (right) in terms of memory and disk I/O usage. Figure 5 shows a screen shot of a Kibana dashboard of the ATLAS analytics platform [7]. This system is based on an NoSQL elasticsearch cluster, custom made data collectors and data enrichment on a Kubernetes cluster [10]. Many detailed studies of the ATLAS Grid system and workflow performance have been carried out and several workflow improvements have been introduced using this combined information which are described in the following sections.
4 PanDA job errors and retry attempts
A job error analysis depending on the job wall time length and type of job workflow has been carried out. Figure 6 shows the distribution of the job wall time for successful and failed production job at the beginning of 2017. The majority of jobs is rather short and the majority of errors happen right at the start of the jobs. These errors are due to job software miscon-figurations or are transient failures of various site services like e.g. the site storage. Many sites only allow to execute jobs for a few days or the Grid proxy lifetime is restricted to a
Figure 5.Example of a dashboard of the ATLAS analytics platform using Kibana.
Figure 6. Left: Wall clock distribution of successful (top) and failed (bottom) production jobs at the beginning of 2017. Right: Enhancement of the failed over successful jobs. A clear structure depending on the queue length configuration is visible.
Figure 7.The cumulative number of events that is produced in the number of attempts in February to April 2018.
of events are produced in the first attempt. There is a slight dependence on the workflows in the overall additional walltime required to finish a task in the Nth final attempt: Simulation requires+29%, event generation+23%, MC digitisation and reconstruction+19%, data re-processing+45% and derivation production+29% additional wall time in multiple additional attempts.
5 AthenaMP improvements: shared writer and fork after first event
The multi process workflow AthenaMP [9] saves significant amount of memory by sharing common memory pages in the different subprocesses running on the same compute node. Typically all simulation and reconstruction jobs keep information of calls to the ATLAS conditions database or ATLAS magnetic field map in memory which can be very efficiently shared between the processes. Each subprocess writes separate output files that need to be merged afterwards in a separate single CPU core process or even a separate Grid job, in which case the output files need to be transferred to other Grid sites. The shared writer has been introduced in AthenaMP to merge the output files of the separate subprocesses on the fly. It uses an additional parallel shared memory process to merge the outputs of the separate AthenaMP processes in one output. Figure 8 shows the I/O profile of a data reconstruction job in AthenaMP mode with and without shared writer on 8 CPU cores. The overall used wall time is significantly shorter with the shared writer and all CPU cores are fully utilised over the whole job wall time. The total walltime saving is in the order of 15-20% of the overall walltime dependent on the workflow. Overall less errors happen since no extra merging job has to be executed.Figure 7.The cumulative number of events that is produced in the number of attempts in February to April 2018.
of events are produced in the first attempt. There is a slight dependence on the workflows in the overall additional walltime required to finish a task in the Nth final attempt: Simulation requires+29%, event generation+23%, MC digitisation and reconstruction+19%, data re-processing+45% and derivation production+29% additional wall time in multiple additional attempts.
5 AthenaMP improvements: shared writer and fork after first event
The multi process workflow AthenaMP [9] saves significant amount of memory by sharing common memory pages in the different subprocesses running on the same compute node. Typically all simulation and reconstruction jobs keep information of calls to the ATLAS conditions database or ATLAS magnetic field map in memory which can be very efficiently shared between the processes. Each subprocess writes separate output files that need to be merged afterwards in a separate single CPU core process or even a separate Grid job, in which case the output files need to be transferred to other Grid sites. The shared writer has been introduced in AthenaMP to merge the output files of the separate subprocesses on the fly. It uses an additional parallel shared memory process to merge the outputs of the separate AthenaMP processes in one output. Figure 8 shows the I/O profile of a data reconstruction job in AthenaMP mode with and without shared writer on 8 CPU cores. The overall used wall time is significantly shorter with the shared writer and all CPU cores are fully utilised over the whole job wall time. The total walltime saving is in the order of 15-20% of the overall walltime dependent on the workflow. Overall less errors happen since no extra merging job has to be executed.Data reprocessing is rather demanding in terms of memory usage even if AthenaMP is used. The increased average number of interactions per bunch crossingµin the 2017 LHC data taking lead to higher memory usage of the reconstruction that did not fit anymore easily into the 2 GB/core Grid worker node configurations. In AthenaMP a lot of conditions and geometry info is loaded during processing the first event and can potentially be shared in all the subsequent subprocesses in addition. This leads to large memory savings due to memory sharing when forking into the AthenaMP subprocesses after instead of before the first event. The grid jobs don’t have to be forced into 2 GB/core slots which results in a significantly lower job failure rates and overall walltime savings. The reprocessing of the 2017 has been split in two separate campaigns. The first half of 2017 data with lower averageµvalues was reprocessed without fork-after-first-event and the second half with higher averageµvalues
time [s] 0 1000 2000 3000 4000
job I/O [GB]
0 2 4 6 8 10 12 14 16 18 20
max rbytes = 6.12 GB walltime = 1.22 h
rchar wbytes rbytes wchar job q431_8_off
time [s] 0 500 1000 1500 2000 2500 3000
job I/O [GB]
0 2 4 6 8 10 12 14 16 18 20
max rbytes = 6.83 GB walltime = 0.82 h
rchar wbytes rbytes wchar job q431_8_on
Figure 8. Left: the I/O profile of a data reconstruction job in AthenaMP mode without shared writer on 8 CPU cores. Left: The same job but with shared writer mode. The overall walltime is significant shorter with shared writer.
Figure 9.Left: the maximum PSS memory distribution of the first half of the 2017 data reprocessing campaign. The blue single core values are from AOD merging jobs and all other values from recon-struction jobs. Right: the same for the second half of the reprocessing in which fork-after-first event was used. The bin with values below 1 GB is due a bug in the PanDA pilot.
was reprocessed using fork-after-first-event. Figure 9 shows the memory distributions for these two campaigns. The second campaign with fork-after-first event shows significantly lower memory usage. Due to this lower memory usage only 6.4% of the overall walltime was lost due to failed jobs, while for the first half of the reprocessing 17.4% was lost due to job failures.
6 Workflow disk I/O
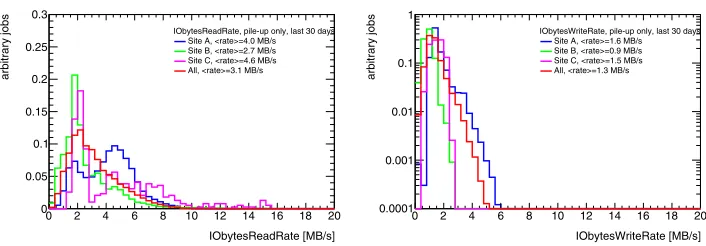
0 2 4 6 8 10 12 14 16 18 20 IObytesReadRate [MB/s] 0
0.05 0.1 0.15 0.2 0.25 0.3
arbitrary jobs
IObytesReadRate, pile-up only, last 30 days Site A, <rate>=4.0 MB/s Site B, <rate>=2.7 MB/s Site C, <rate>=4.6 MB/s All, <rate>=3.1 MB/s
0 2 4 6 8 10 12 14 16 18 20 IObytesWriteRate [MB/s] 0.0001
0.001 0.01 0.1 1
arbitrary jobs
IObytesWriteRate, pile-up only, last 30 days Site A, <rate>=1.6 MB/s Site B, <rate>=0.9 MB/s Site C, <rate>=1.5 MB/s All, <rate>=1.3 MB/s
Figure 10.Left: distribution of the read rates for MC digitisation and reconstruction in June 2018. The sites have been randomly chosen and represent at large Tier1 and medium size Tier2 sites. The double peak structure of the distributions for site A and C are due to worker node and workflow setups. Right: the distribution of the write rates for the same type of jobs and the same time range.
MB/s. Monitoring these values allows to broker these type of rather resource demanding jobs
to sites with good disk I/O capabilities.
7 Conclusions
More than two years ago ATLAS established a working group to improve the ATLAS Grid workflow performance on the Grid. An essential ingredient to study the performance is the instrumentation of all PanDA jobs with a lightweight process monitoring which is collected in a powerful analytics platform. The group has identified several workflow bottlenecks and
addressed them with different improved workflows. More improvements are currently under
study. All this work especially the detailed job performance monitoring and analytics is a valuable input for the WLCG cost performance working group [11].
References
[1] ATLAS Collaboration, JINST3(2008) S08003.
[2] T. Maeno et al., J. Phys. Conf. Ser.331(2011) 072024.
[3] V. Garonne et al., J. Phys. Conf. Ser.898(2017) no.6, 062019.
[4] Worldwide LHC Computing Grid project, URL http://cern.ch/lcg [accessed 2018-09-06]
[5] ROOT, Version 6.14/04 available from https://root.cern.ch/downloading-root [accessed
2018-09-10]
[6] Process Monitor (prmon), Version available from https://github.com/HSF/prmon
[ac-cessed 2018-09-10]
[7] I. Vukotic et al.,ATLAS Analytics and Machine Learning Platforms, These Proceedings
(2018).
[8] Elasticseach, Version 6.4.0 available from https://www.elastic.co/downloads/elasticsearch
[accessed 2018-09-06]
[9] P. Calafiura et al., J. Phys. Conf. Ser.664(2015) no.7, 072050.
[10] Kubernetes, Version 1.11 available from https://kubernetes.io/docs/setup/release/notes/
[accessed 2018-09-06]
[11] A. Sciaba et al.,System Performance and Cost Modelling in LHC computing, These