Magnetism in Uranium Intermetallic Compounds
Alberto Martin-Martm*
University College London
Thesis submitted for the title of PhD in Physics
June 4, 2000
All rights reserved
INFORMATION TO ALL U SE R S
The quality of this reproduction is d ep en d en t upon the quality of the copy subm itted. In the unlikely even t that the author did not sen d a com plete manuscript
and there are m issing p a g e s, th e se will be noted. Also, if material had to be rem oved, a note will indicate the deletion.
uest.
ProQ uest U 6 4 2494
Published by ProQ uest LLC(2015). Copyright of the Dissertation is held by the Author. All rights reserved.
This work is protected against unauthorized copying under Title 17, United S ta tes C ode. Microform Edition © ProQ uest LLC.
ProQ uest LLC
789 East E isenhow er Parkway P.O. Box 1346
A b stract
W hat differentiates the actinides from the rare earths is the extended nature of the 5 / wavefunctions. Because the energies of the 5 / electrons are comparable to those of the 6d electrons, a site-based approach to actinide magnetism is certainly not of general validity, but a itinerant approaches goes too far in the opposite direction. Thus depending on the actinide element, the interactinide spacing, and the actinide environment in a compound, we find properties ranging from th a t of itinerant transition-like systems to th a t of localised lanthanide-like systems.
It is clear th a t the magnetic properties of 5/-based intermetallics cannot be explained by either of the limiting approaches. At present, none of the existing theories is capable to explain the whole variety and richness of magnetic prop erties among actinide intermetallic compounds. A full understanding of their properties, which lies at the boundary between localisation and itinerancy, re mains, in spite of enourmous experimental and theoretical efforts, a challenging problem.
I would have never thought, in the summer of 1995, when I went to London to study for an MSci in physics th a t I would be away from home for four years. All this because I met Prof. Keith McEwen during the MSci, and he suggested a Ph.D in a subject I could not refuse. I am much indebt by his support, su pervision and encouragement. During my first year of the Ph.D I was based at Birkbeck College London, where I learnt to orient single crystals, magnetometry and low tem perature techniques. I am very grateful during this period by the help, support and friendship of Mark Ellerby. I would like also to thank the Royal Institution of Great Britain, the "Institute de Ciencia de Materiales de M adrid” and “Universidad Complutense de Madrid” for the availability of their SQUID magnetometers and Marco Antonio Lopez de la Torre and Jose Luis Martinez.
I want to thank the European Commission for a bursary within the framework of the Human Capital and Mobility Program.
My thanks go also to the Institute for Transuranium Elements in Karlsruhe, Germany where I was hosted by the European Commission. In particular I am much in debt with Prof. Gerry Lander who has taught me about the beauty of neutron scattering and more recently, synchrotron radiation. I am very grateful to his cheerful disposition, enthusiasm and his ability to explain in simple words the most difficult concepts.
the supervision of Jiri Kulda who introduced me to the various techniques used in neutron scattering. I want to thank him for the time he dedicated to explain me the details of neutron instrum entation, and I regret I did not have more time to collaborate with him on this. I would like to thank the Institute for its hospi tality, the TAS group and the technicians for their assistance in the experiments, specially D. Puschner and A. Brochier. There are also a big number of scientists from the Institute which have collaborate in one way or another to the final result of the thesis and I am very much indebt to them; P.J. Brown, G. McIntyre, B. Ouladiaff, A. Filhol, P. Burlet, J. Campo, A. Murani, A. Hiess, A. Wildes and J.C. Marmeggi.
A b stra ct 2
A ck n ow led gm en ts 3
Table o f con ten ts 5
List o f figures 7
List o f tab les 15
1 In trod u ction 19
1.1 Actinides or U-based compounds ... 20
Bibliography ... 25
2 T h eory 26 2.1 Curie p aram ag n etism ... 27
2.2 The crystal electric f i e l d ... 29
2.2.1 Crystal field in te ra c tio n s ... 31
2.3 Quadrupolar in te ra c tio n s... 32
2.4 From “single impurity problem” towards “interacting im purities” 34 2.4.1 Anderson m o d e l... 34
2.4.2 Kondo m o d e l ... 35
Contents 6
3 E xp erim en tal techniques 40
3.1 M agnetom etry... 40
3.2 Neutron s c a t t e r i n g ... 41
3.2.1 Elastic s c a tte r in g ... 45
3.2.2 Inelastic s c a t te r i n g ... 59
Bibliography ... 64
4 U (P d i_ ^ P tj3 66 4.1 Literature S u r v e y ... 67
4.1.1 Magnetic properties of U P d a ... 68
4.1.2 Magnetic properties of U P t s ... 74
4.2 Magnetisation and susceptibility... 78
4.3 Elastic scattering e x p e rim e n ts ... 87
4.3.1 Magnetic susceptibility in U P d g ... 87
4.3.2 U(Pdo.995Pfo.005)3 ... 91
4.4 Magnetic excitations in U P d g ... 92
4.4.1 Low energy excitations in U P d g ... 93
4.4.2 High energy excitations in U P d g ... 96
4.5 Magnetic excitations in U(Pdo.9gPto.o2 ) 3...106
4.5.1 Low energy excitations in U(Pdo.9 8Pto.0 2 ) 3 ...106
4.5.2 High energy excitations in U(Pdo.9 8Pto.o2 ) 3 ...108
4.6 Magnetic excitations in U(Pdo.7 5Pto.2 5 ) 3...I l l 4.7 Magnetic excitations in U(Pdo.o5Pto.9 5 ) 3...116
4.8 D iscu ssio n ... 124
Bibliography ... 130
5 U2T2I11 (T = N i, P d , P t) 134 5.1 Literature S u r v e y ... 134
5.3 Magnetic s t r u c t u r e ... 145
5.4 Temperature dependence of m o m e n ts ...148
5.5 Polarised-neutron experiment on U2P t2l n ... 149
5.6 Searching for magnetic correlations in U2P t2l n ... 152
5.7 D iscu ssio n ... 154
Bibliography ...157
6 C onclusions 161 Bibliography ...164
A T he d eterm in a tio n o f crystal field sp littin g s 164
List o f Figures
1.1 A schem atic of the bandwidth W, and spin-orbit splitting A s o , for the d and / series elements, from [2]... 21
3 .1 Geom etry for a general scattering experim ent... 4 4 3 .2 Condition on the scattering vector Q = ki — kf îov Bragg scattering. |Q| =
2|^| sin ^ ... 4 9 3 .3 Schematic picture of the D15 single crystal diffractometer at the ILL, Grenoble. 51 3 .4 Scattering geometries used to separate the nuclear and m agnetic contributions
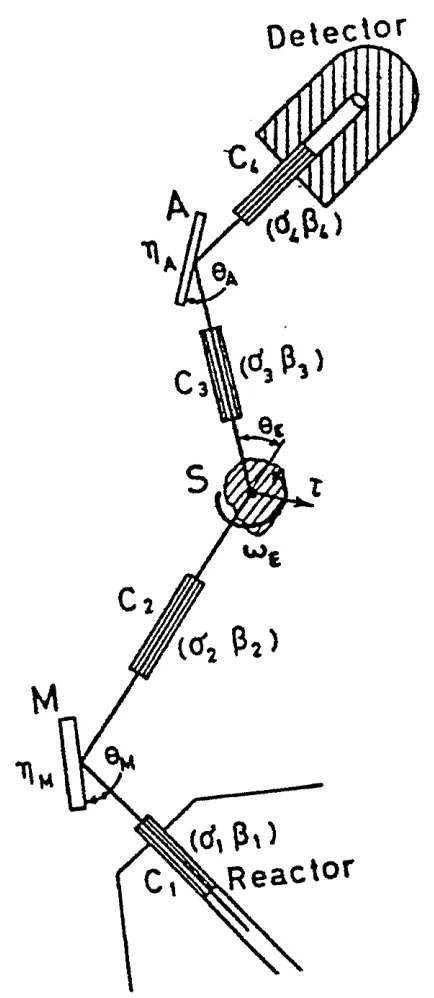
by polarisation analysis; a) The polarisation of the incident beam is parallel to the scattering vector and perpendicular to the m agnetisation of the sample. The m agnetic scattering inverts the spin of the neutron and coherent nuclear scattering does not. b) The polarisation of the incident beam is parallel to the sample m agnetisation and perpendicular to the scattering vector. Both coherent nuclear and magnetic scattering occur without spin-flip... 53 3 .5 Experim ental set up for a polarised neutron diffraction experim ent... 5 4 3 .6 Schematic view of a triple axis spectrom eter... 61
4 .1 The hep and dhcp crystal s t r u c t u r e s ... 6 7 4 .2 Specific heat and thermal expansion of UPdg at zero field (open circles) and
4 .3 The peak intensity at Q = (^,0,3) and Q = ( |,0 ,4 ) for P || Q as a function of temperature. The lines are guide to the eye. From [15]... 6 9 4 .4 Basal plane projection of the antiferroquadrupolar structure on the cubic sites
of UPda below T i. The circle and the ellipses represent the uranium ions at the cubic A-layer sites. In the high tem perature phase the uranium ions will have non-zero quadrupole moments corresponding to the uraniums having a spheroidal charge distribution w ith the c-axis being the axis of revolution. The
Qx2- y2 contribution to the order parameter results in the charge distribution
of an ion being no longer spheroidal, but acquiring the sym m etry of an ellipsoid with its three principal axes having unequal lengths; the ellipses indicate the relative orientations of these ellipsoids (one principal axis remains normal to the basal plane) for the different ions in the cubic sites (the central ion remains spheroidal). The effect of the Q^x contribution can be visualised by im agining that the ellipsoidal charge distribution for each ion is rotated by a small angle in the positive direction out an appropriate rotation axis; this rotation axis lies in the basal plane and is indicated with an arrow; the central ion is not rotated. The unit cell of the structure is indicated... 71 4 .5 Crystal field scheme calculated with the effective charges of Murray and Buyers
[6] 72
4 .6 Dispersion of collective excitations in UPda as in [5]... 73 4 .7 Susceptibility of single-crystalline U P ts, from [21]... 74 4 .8 Constant energy transfer hw scans a i Q = (^// ,0,1) in high-frequency (hw = SmeV)
and low-frequency {hw = 0.5meV) regimes for U P ts. Lines are guides to the eye; A E denotes the incoherent energy resolution (fwhm) of the instruments. From [22, 3]... 75 4 .9 Schematics of (a) m agnetic short-range order accounting for high frequency
List o f Figures 10 4 .1 0 C /T values at T = 1.4K vs. Pd concentration in a m agnetic field of 5T and
at zero field... 7 7 4 .1 1 Phase diagram for the U(Pti_a;Pda; ) 3 compounds for x <0.10; Neel tem per
ature, Ttv, and superconducting tem perature, T g , vs. Pd concentration; S = superconductivity, SF = spin fiuctuations, AF = antiferromagnetism, K = Kondo behaviour. Arrows indicate the sign of the pressure effect on the characteristic tem perature... 78 4 .1 2 Susceptibility for U (Pdi_a;Ptx) 3 measured in an applied field of B = IT for
the a and c-axis... 7 9 4 .1 3 D etail of susceptibility for U (P d i_ z P tz )3, x = 0 , x = 0 .0 0 5 and x = 0 .0 2 , mea
sured in an applied field of B = IT for the a and c-axis... 8 0 4 .1 4 D etail of susceptibility for U(Pdo.5oPto.5o) 3 measured in an applied field of
B = O.OIT for the ZFC branch (•) and the FC branch (□ ) in the a and c-axis. 81 4 .1 5 Temperature dependence of the inverse m agnetic susceptibility for U (P d i_a;P tz)3.
The em pty squares (□ ) are data with the field parallel to the c-axis, while for the full dots (•) the field is parallel to the a-axis. The straight lines are fits to the Curie-Weiss law above lOOK. For the sake of clarity, the data of each compound are shifted by two units on the scale... 82 4 .1 6 Effective magnetic moment and Curie tem perature for the c-axis (□ ) and
a-axis (•). The vertical lines represent the changes of crystal structure [19]. . . 8 3 4 .1 7 Bg and c /a ratio, from [19], for U (Pdi_a;Ptx) 3... 8 4
4 .1 8 M agnetisation versus applied field for U (P d i_ x P tx) 3 measured at T = 2K.
The data with the field parallel to the a-axis are shifted for clarity... 85 4 .1 9 Non-linear susceptibility w ith the field applied along the a-axis and c-axis for
U(Pdi_a;Pta: ) 3 with x = 0 , x = 0 .0 0 5 , x = 0 .0 2 and x = 0 .2 5 ... 86
4 .2 0 M agnetic susceptibility of U P d3 measured by m eans of single crystal polarised
4 .2 1 M agnetic susceptibility of UPdg measured by means of single crystal polarised neutron diffraction in a field of B = 4.6T for the hexagonal sites for fields applied along the a and c-axis. From [7]... 8 8 4 .2 2 Susceptibility fitted for the hexagonal sites from a crystal field Hamiltonian.
The parameters for the fit are 8 ° = 0.406m eV, = -0.00212m eV, Bg = O.OOOSSlmeV, Bg = 0.00169m eV and B = 2.24Tesla... 9 0 4 .2 3 Spin-fiip and non-spin-fiip scattering from the ( |,0 ,1 ) reflection at T = 2K
as a function of applied field for U(Pdo.995Pto.oo5)3- The enhancement of the scattering follows the power law I oc B “ where 0 ! ~ 1 . 7 ... 91 4 .2 4 Spin-flip and non-spin-fiip scattering from the ( |,0 ,1 ) and ( |,0 ,4 ) reflections
at B = 3T as a function of temperatures for U(Pdo.9 9 5Pto.oo5 ) 3... 9 2
4 .2 5 Inelastic scattering at a F-point of UPdg at 1.8K, measured on IN 14 with
k f = 1.5Â “ ^ fixed. Monitor 4000 corresponds to a counting tim e of llm in at 0.5m eV energy transfer. The curves are lorentzian fits to the data. The bottom line represents the measured background... 9 4 4 .2 6 Temperature dependence of the inelastic scattering at Q = ( | , | , 0 ) in UPdg,
measured with fixed k / = 1.3Â “ ^. Remind transition tem peratures for UPdg, see section 4.1.1. T i, = 7.8K, T i = 6.8K, T2 = 4.4K ... 9 5
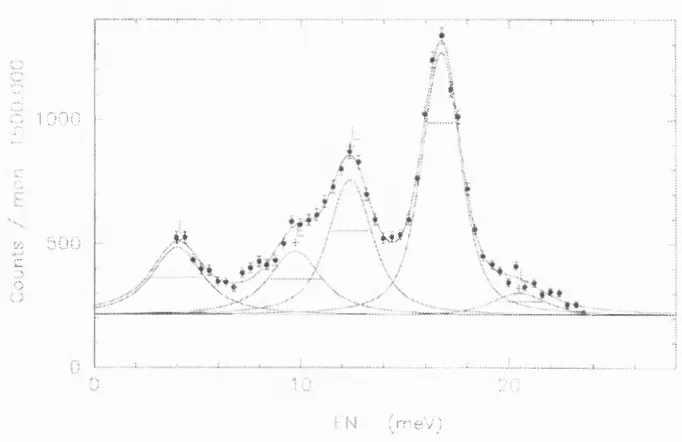
4 .2 7 Inelastic scan of UPdg at the wave vector Q = (2.5,0,0) at lOK fitted w ith five lorentzians. The energy resolution width for this configuration {kf = 2.662Â “ ^) is l.OOmeV at zero energy transfer. Monitor 5000 corresponds to a counting tim e of 4min at 5meV energy transfer. The bottom line represents the m ea sured background... 9 7 4 .2 8 Inelastic scan of UPdg at the wave vector Q = (2.5,0,0) at lOK. At least two
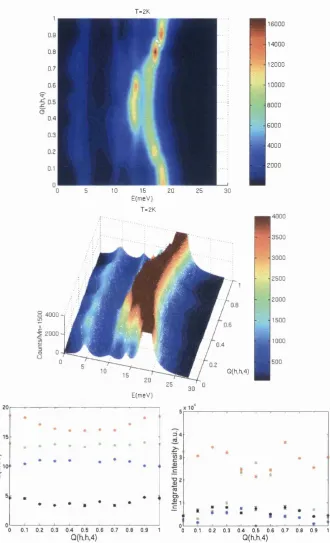
List o f Figures 12 4 .2 9 Crystal field m odes of UPdg along Q = (0,0,0 2K. We clearly observe four
modes in this energy range. The top figure shows the strong dispersion of the most intense mode. The middle figure shows a section in order to observe the weaker modes. The two bottom figures show the fitted centre of the lorentzians and their area in the same colour... 1 0 0 4 .3 0 Crystal field m odes of UPdg along Q = (h,h,3) at 2K. D etails as for Fig. 4.29. 101 4 .3 1 Crystal field modes of UPda along Q = (h,h,4) at 2K. D etails as for Fig. 4.29. 1 0 2 4 .3 2 Crystal field modes of UPdg along Q = (h,0,0) at lOK. D etails as for Fig. 4.29. 10 3 4 .3 3 Crystal field m odes of UPdg along Q = ( ^ ^ ,k ,0 ) at lOK. D etails as for Fig. 4 .2 9 .1 0 4 4 .3 4 Crystal field modes of UPdg along Q = ( l ^ , k , 0 ) at lOK. D etails as for Fig. 4 .2 9 .1 0 5 4 .3 5 Inelastic scattering of U(Pdo.9 8Pto.o2 ) 3 at the M-point Q = (1.5,0,0) at 2.0K,
measured on IN14 with k f = 1.5Â “ ^ fixed. Monitor 6000 corresponds to a counting tim e of 27min at O.SmeV energy transfer. The curves are lorentzian
fits to the data. The bottom line represents the measured background. . . . 1 0 7 4 .3 6 Inelastic scattering of U(Pdo.9sPto.o2 ) 3 at the F-point Q = (1,0,0) at 50K,
measured on IN14 with k / = 1.5Â~^ fixed. Monitor 6000 corresponds to a counting tim e of 27min at O.SmeV energy transfer. The curves are lorentzian
fits to the data. The bottom line represents the measured background. . . . 10 8 4 .3 7 Crystal field modes of U(Pdo.9 8Pto.0 2 ) 3 along Q = (h,0,0) at 2K. The top figure
show the evolution from the zone centre to the boundary of the Brillouin zone. The two bottom figures show the fitted centre of the lorentzians and their area in the same colour... 1 0 9 4 .3 8 Crystal field modes of U(Pdo.98Pto.o2)3 along Q = ( ^ ^ ,k ,0 ) at 2K. D etails as
for Fig. 4.37... 1 1 0 4 .3 9 Inelastic scan of U(Pdo.9 8Pto.o2 ) 3 at the M -point Q = (2.5,0,0) at T = 2K,
fitted to five lorentzians. The energy resolution width for this configuration
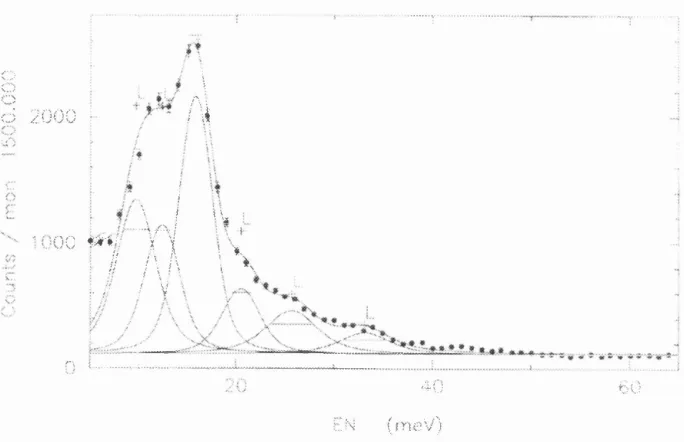
4 .4 0 Inelastic scan of U(Pdo.9 8Pto.o2 ) 3 at the wave vector Q = (2,0,0) at 2K. At
least two extra modes are observed at higher energies. The energy resolution width for this configuration ( k / — 4 . 1Â~^) i s S.lSm eV at zero energy transfer. Monitor 5000 corresponds to a counting tim e of 9.2m in at 27m eV energy transfer. The bottom line represents the measured background...1 1 2 4 .4 1 Crystal field m odes of U(Pdo.9gPto.o2 ) 3 along Q = (h,0,0) at 2K. The top
figure shows the strong dispersion of the m ost intense mode. In the middle figure show a section in order to observe the weaker m odes. The two bottom figures show the fitted centre of the lorentzians and their area in the same colour. 1 1 3 4 .4 2 Crystal field modes of U(Pdo.9 8Pto.o2 ) 3 along Q = ( ^ ^ ,k ,0 ) at 2K. D etails as
for Fig. 4.41...1 1 4 4 .4 3 Crystal field modes of U(Pdo.9 8Pto.o2 ) 3 along Q = ( ^ ^ ,k ,0 ) at 2K. D etails as
for Fig. 4.41...1 1 5 4 .4 4 Inelastic scan of U(Pdo.7 5Pto.2 5 ) 3 at the wave vector Q = (0,0,4.4) at 1.5K
fitted with four lorentzians. The energy resolution width for this configuration
{kf = 2.662Â “ ^) is l.OOmeV at zero energy transfer. Monitor 5000 corre sponds to a counting tim e of 2.3min at 5meV energy transfer. T he bottom line represents the measured background...1 1 6 4 .4 5 Inelastic scan of U(Pdo.7 5Pto.2 5 ) 3 at the wave vector Q = (0,0,5) at 2K. At least
another extra mode is observed at energy ~ 46meV. The energy resolution width for this configuration (k / = 2.662Â “ ^) is l.OOmeV at zero energy transfer. Monitor 5000 corresponds to a counting tim e of 2.3m in at 5meV energy transfer. The bottom line represents the measured background. . . . 1 1 7 4 .4 6 Crystal field modes of U(Pdo.7 5Pto.2 5 ) 3 at 2K. The top figure shows the inten
sity and energy evolution of the modes along the sym m etry line in reciprocal space Q = (0,0,f). The two bottom figures show the fitted centre of the lorentzians and their area in the same colour... 11 8 4 .4 7 Crystal field modes of U(Pdo.7 5Pto.2 5 ) 3 along Q = (h,0,0) at 2K. D etails as
List o f Figures 14 4 .4 8 Crystal field modes of U(Pdo.75Pto.25)3 along Q = (h,0,3) at 2K. D etails as
for Fig. 4.46...1 2 0 4 .4 9 Inelastic spectra of U(Pdo.o5Pto.95)3 at fixed Q = ( |,0 ,1 ) and k / = 2.662Â~^
at T = 1.6K, measured on INS. Resolution is l.Ofimev fwhm at zero energy transfer. Monitor 4000 corresponds to a counting tim e of 3.8m in at 2meV
energy transfer. The bottom line represents the measured background. . . . 121 4 .5 0 Inelastic spectra of U(Pdo.o5Pto.95)3 at fixed Q = ( |,0 ,1 ) and k / = 2Â “ ^
at T = 1.72K, measured on IN14. Resolution is 0.5m ev fwhm at zero energy transfer. Monitor 6000 corresponds to a counting tim e of 19.5min at 2meV
energy transfer. The bottom line represents the measured background. . . . 121 4 .5 1 Constant energy scan along Q = (A,0,1) in U(Pdo.o5Pto.95)3 at fixed energy
transfer A E = 1.2meV and k / = 2Â “ ^ at T = 1.72K ... 12 2 4 .5 2 Coloured plots along Q = (A,0,1) in U(Pdo.o5Pto.95)3 at fixed k / = 2Â~^ at
T = 1.72K, T = 9.79K and T = 28.87K ... 12 3 4 .5 3 Coloured plot along Q = ( |,0 ,/) in U(Pdo.o5Pto.95)3 at fixed k f = 2Â~^ at
T = 1.72K...12 5
5 .1 Crystallographic structure for U2T2ln (T = Ni and P d ), space group P 4 /m 6 m
(No. 127), in two different projections...135 5 .2 Schematic diagram illustrating the development of some electronic properties
of U2 7 2A compounds with corresponding transition m etal and p-electron el ements. The uranium moments fiord of antiferromagnetic \J2T2X com pounds
determined by neutron diffraction are displayed as filled chimneys. Further more, the m agnetic ordering tem peratures T n and the low-tem perature elec tronic contribution 7 to the specific heat are given in the upper left and lower right corner, respectively. Note, that 1 mol f.u. contains two uranium atoms. From [14]... 1 3 6 5 .3 Antiferromagnetic transition temperature versus the tetragonal c distance for
5 .4 Specific heat and electrical resistivity of U2P t2ln single crystal showing non-Fermi liquid behaviour at low temperatures, from [22, 23]... 1 3 8 5 .5 Crystallographic structure of the U2P t2ln com pound of the space group P 4 2 /m n m
(No. 136) in two different projections. The U2 atom s at the 4 / site are marked
with bold borders; these are the atom s that have a separation of only 3.48Âin this structure... 14 2 5 .6 Possible m agnetic arrangements in the space group F 4 / m b m w ith the repre
sentations corresponding t o k = (0,0,0) - taken from [28]. If the m agnetic structure propagation wavevector k = (0 ,0 ,1 /2 ), the possible arrangements stays the same, but their space group identification changes. T he correspon dence between the two wavevectors is given in Table 5 .2... 145 5 .7 Temperature dependence of the intensity of the (1 ,0 ,1 /2 ) and the (1,0,1)
magnetic reflection in U2Ni2ln and U2P d2ln shown on a scale normalised
to the value at 2.5K and at 4K, respectively. The insets show a log-log plot which gives = 14.0(1)K , and the exponent /3 = 0.28(1) for U2N i2ln and
Ttv = 40.8(7)K and = 0.34(2) for U2Ni2ln. T he reduced tem perature t = (T
- T ^ ) / T w ...1 4 9 5 .8 (0,0,1) projection showing the m agnetisation density (determined by the m ax
imum entropy m ethod) induced at T = lOK with H = 4.6T in U2P t2ln. N ote
the larger signal at the U 2 (4 /) compared to that at the U i(4p ) site. Contour levels are from -0.01 (dashed) to 0.41 in steps of 0 .0 2 /ig /A ^ ...151 5 .9 Scans performed in reciprocal space with a fixed energy transfer of A E = 0.4m eV
in single crystal U2P t2ln are marked with solid line...1 5 3 5 . 1 0 Scans performed in reciprocal space with a fixed energy transfer of A E = O.fimeV
List o f Tables
1.1 5 / bandwidth W , intra-atom ic Coulomb correlation and Stoner parameter
I tim es the density of states n^f{EF) for light actinide m etals... 23 4 .1 Lattice parameters (a and c), neighbouring uranium distance and c/a* { 2c/a
for U P ts) ratio quite deviated from ideal c / a = 1.633 for hep UPtg (MgCda type structure) and dhcp UPdg (TiNig type structure) from [1]... 6 6
4 .2 Parameters from the fit of the Curie-Weiss law and m agnetic moment at 2K and 7T for all the series U(Pdi_a;Pta:)3... 81
5 .1 Crystal structure refinements. Two different crystals from different batches have been examined in the case of U2P t2l n . < y > is the mean value of ex
tinction refined, and ymm corresponds to the largest reduction (compared to an unaffected intensity with y = 1) calculated from extinction. T he In atoms are fixed by sym m etry to the positions 2a in the T = Ni and Pd com pounds, and 4d for T = P t ... 14 0 5 .2 Interatomic distances around the U i and U2 atom s in U2P t2ln calculated
at 20K. NN refers to the number of neighbours. The error bars are about ±0.005Â on interatom ic distances... 141
5 .3 Table to illustrate the distortions in the U2P t2l n com pound as compared to
the other two. xîJ is the position which would correspond to all U atom s being on rows parallel to the tetragonal c axis. For the Ni and Pd com pounds, this is the real value of X[/ (see Table 5.1), whereas for the P t com pound it is taken so that the atom s are displaced a constant amount Arcc; either side. T he sam e arguments can be made for the P t atom s which are displaced in the c direction. d|| is the distance in the basal plane between nearest U neighbours, d x is the distance (to a good approximation) along the c-axis. W ith the inequivalence of the U i and U2 in the P t structure there are two values of dy... 1 4 4 5 .4 Correspondence between the m agnetic representations w ith k = (0,0,0) and
k = (0 ,0 ,1 /2 ). In the latter case there is a simple antiferromagnetic arrange ment (-1- -f ) of the uranium m agnetic m oments along the c axis that requires the m agnetic unit cell to be doubled along this direction...1 4 6 5 .5 For convenient reference to Fig. 5.6 we give the representations in the order
equivalent t o k = (0,0,0), which corresponds to U2P d2l n , whereas U2N i2l n
has k = (0,0,1/2). Given are the values for the refinements and the resulting moment of the uranium moment. In the final column in each case is given the results of a refinement including the best configuration (lowest %^) of the U moments and allowing a moment on the T-site. The sym m etry of the T site moment is given are the second representation in the column heading. For
List o f Tables 18 5 .6 Refinements for the polarised-neutron values for U2P t2ln. The experiment
was performed at T = lOK with an applied field of 4.6T. 161 reflections were measured with A = 0.843Â. The data have been analysed within the dipo lar approxim ation with the single-electron wavefunctions of Freeman et al.
In trod u ction
The name of magnetism comes from the Greek city of “Magnesia” , where large amounts of a natural magnet (Fe3 0 4), were found. The “magic” property of
this stone consisted in attracting some metallic tools made of iron. In the sec ond century B.C. the Chinese learnt th at if a piece of iron was placed in the vicinity of a natural magnet, this will acquire the same properties. Then the use of a small needle free to rotate in the horizontal plane, after being magne tised, became widely extended by our ancestors because of its ability to point always to the same direction, due to the E a rth ’s magnetic field. The materials th at exhibit these properties are called ferromagnets. At ambient tem perature these are Fe, Ni, Co and their alloys. This type of magnetism is carried by the spin magnetic moment of the conduction electrons, and hence is called itinerant magnetism. The lanthanides are characterised by the consecutive filling of the 4 / shell. From Lanthanum (La) with atomic number 57 to Lutetium (Lu) 71 they form 14 elements. Almost all the lanthanides are magnetic. For these, the unpaired electrons do not participate in the conduction, and the magnetism can be considered as localised in the magnetic ions.
There is a family of elements, which goes after Actinium (Ac) in the periodic classification of Mendelei'ev, with atomic numbers between 89 and 102, which
Chapter 1. Introduction 20 forms the series of the A c tin id e s. The first ones in the series, Actinium (Ac), Thorium (Th), Protactinium (Pa) and Uranium (U) are present in nature. The heavier elements have been discovered with the advent of the atomic era. For the intermetallic compounds of these elements and some light Rare Earths, mainly Ce, the unpaired electrons may be part of the conduction band. Thus, these compounds, depending on the hybridisation with the d electrons of transition metals, may behave as itinerant or localised magnets, and they give rise to a great new range of physical properties, th a t has been extensively studied in the last years.
In this thesis, we concentrate on the intermetallic compounds of uranium, which form the bulk of the published work because it is a relatively easy m aterial to handle, taking the appropriate care.
1.1
A ctinides or U -based com pounds
The main feature of the actinides is the consecutive filling of the 5 / shell. W ith the exception of Cerium, in the lanthanide series the 4 / electrons are located well below the Fermi level and do not take part in atomic bonding, while in the actinides the 5 / electrons are close to the Fermi level and they are often exposed to bonding forces. Thus the magnetic behaviour of the 5 / electrons not only concerns the magnetic measurements but also others, e.g., electrical resistivity or specific heat.
> o> >-13 CC ÜJ Z
LU
20
15
10
5
0
ATOMIC NUMBER
Figure 1.1: A schematic of the bandwidth W, and spin-orbit splitting Aso, for the dand / series elements, from [2].
systems.
The results for 4 / systems, with the exception of Ce and some other materials th a t exhibit intermediate valent behaviour, are for the main part understood [1]. The framework of localised moments interacting with each other through the conduction electrons by the RKKY interaction and subject to crystal fields from the surrounding ions, explains not only the neutron results, but also almost all the bulk property measurements.
F ig . 1.1 shows the energy scale of two of the most im portant interactions in the magnetism of the various electron series. The 5 / electrons fit neither into the schemes devised for the d-transitions metals, where the spin-orbit interaction is an small perturbation on the bandwidth parameter, nor into those applicable to the rare earths, where the reverse is true. We find th a t actinides have characteristics of both series.
Chapter 1. Introduction 22 • The Mott-Hubbard theory (many-particle local picture) [4].
The Stoner theory of magnetism states th a t magnetic ordering is possible in a band scheme when spin alignment becomes energetically favourable. A simple criterion is derived:
I X n { E F ) > 1 (1.1)
where I is the so-called Stoner param eter and n{EF) is the electronic density of states at the Fermi energy. From a band point of view the possibility of magnetic ordering is essentially governed by the 5 / density of states at the Fermi energy
^5/(-Ë^f)-In the approach of M ott-Hubbard an instability exists in the narrow-band structure; if the bandwidth {W) decreases below the effective intra-atom ic Coulomb correlation
W < U ,„ (1.2)
a sudden transition develops, driving the system from a nonmagnetic itinerant state into a magnetic localised one.
Estim ated values of IF, U and I x ti{ Ef) for the light actinides metals are reported in T a b le 1.1. It is clear th a t plutonium is in a critical position and a transition occurs between plutonium and americium. Americium behaves like a lanthanide in all its physical properties with a J= 0 nonmagnetic ground state.
For pure metals, the M ott-Hubbard scheme is more appropriate to describe the change in 5 / behaviour through the actinide series. Up to plutonium the Stoner criterion is not fulfilled. From their critical situation ( / x ti{ Ef) ~ 1),
Table 1.1: 5/ bandwidth W , intra-atomic Coulomb correlation and Stoner parameter I tim es the density of states rif,f{EF) for light actinide m etals.
Pa U Np Pu Am Ref.
IV (ey) 5 4 3 2 0.1 [5]
1.5 2.3 2.6 3.5 5
[51
I X ti{ Ef) 0.3 0.9 0.9 0.8 > 1 [6]The early members of the actinide series beginning with thorium have a ten dency in a metallic environment to a valency of 4+, whereas curium, the middle member of the series, tends to have valency 3^. It is then not surprising th at in the intermediate elements such as uranium and plutonium there may be a competition between configurations.
Hill [8] pointed out th a t uranium, neptunium and plutonium compounds could be divided into magnetic and nonmagnetic subgroups, depending on the inter actinide distance dAn-An, the critical value being about 3.4Â. This systematic behaviour clearly indicates a localisation process related to direct 5 / — 5 / over lap. The critical dAn-An value may correspond to the fulfilment either of a Stoner criterion, or of a M ott-Hubbard criterion. It is now clear th a t for magnetic com pounds near the critical spacing the 5 / electrons are in bands pinned at the Fermi energy. Therefore, contrary to the pure metals, the Stoner criterion may be fulfilled before the band description breaks down.
The essential param eter for 5 / localisation is direct 5 / — 5 / overlap. The first correction comes from hybridisation with d or p states of the compounds anions.
Chapter 1. Introduction 24 complex, and frequently controversial because of the doubt whether to use a lo calised or an itinerant description. To a first approximation, the itinerant picture seems more appropriate for intermetallic compounds with small dAn-An or with strong hybridisation while the local picture seems to work rather well for most semimetallic- and of course insulating- compounds. When the separation is close to the critical value, complex spin fluctuation behaviour results though such com pounds usually do not order magnetically. The essential feature is the existence of a narrow band- here the / one- pinned at the Fermi energy. A simple criterion to guide us to the determination of itinerant magnetism could be:
• a reduced order moment (in particular when incompatible with the effective moment in the crystal-field scheme),
• a large electronic specific heat coefficient (> lOmJ/mol-K^), • a reduced magnetic entropy (<C i? • ln2).
It should also be noted th at whilst it is convenient to treat the coupling of the 5 / electrons of the light actinides in the L5-coupling scheme, the coupling is in reality intermediate between L S and j j coupling. However, in general, assuming th a t L S coupling can be applied is a fair approximation.
We have studied a system in which there is a crossover between the limiting approaches of itinerant and localised behaviour. In U(Pdi_a;Pta; ) 3 we find proper
ties ranging from a pure localised behaviour, in which even crystal field transitions are observed (compounds closer to the UPdg end), to itinerant systems, heavy fermions (close to the UPts end).
Another system we have studied, this closer to the itinerant description, is the U2T2A', where T is a transition metal (Co, Rh, Ni, Pd, P t etc.) and X = In or
[1] J. Jensen and A. R. Mackintosh, Rare Earth Magnetism. Structures and Ex citations., The International Series of Monographs in Physics (Oxford Univer sity Press, Oxford, England, 1991).
[2] G. H. Lander, M. S. S. Brooks, and B. Johansson, Phys. Rev. B 43, 13672 (1991).
[3] E. C. Stoner, Proc. R. Soc. 165, 372 (1938). [4] J. Hubbard, Proc. R. Soc. A 277, 237 (1964). [5] B. Johansson, Phys. Rev. B 11, 2740 (1975).
[6] M. S. S. Brooks, B. Johansson, and H. L. Skriver, in Handbook on the Physics and Chemistry of the Actinides (Elsevier Science, Amsterdam, The Nether lands, 1985), Vol. 1, p. 153.
[7] J. M. Fournier, A. Blaise, W. Mller, and J. C. Spirlet, Physica B 86-88, 30 (1977).
[8] H. H. Hill, Plutonium 1970 and other Actinides (Metal Soc. AIME, New York, 1970).
C hapter 2
T h eory
This thesis is based on experimental findings. However, some theories relevant to magnetic properties of solids will be outlined in this chapter.
The magnetic properties of metallic materials can be quite well described in the framework of one of the two approaches, namely by the itinerant electron model, and on the other hand, the model in which localised magnetic moments are assumed. Both approaches have been the subject of discussions since their development for many years. They can be used in fact only in limiting cases. The itinerant electron system is characterised by strongly overlapping electron wavefunctions which may lead to small magnetically ordered moments in one hand and to high ordering tem peratures on the other. The situation with localised systems is opposite: the magnetic moments are fully developed as they would be in free atoms and the ordering is promoted indirectly via conduction electrons. The ordering tem peratures are usually low and magnetic structures are complex. This is because of the so different strengths of the interactions present in these systems. After the Coulomb interaction, which is clearly the dominant in both systems, the crystal field interaction is reponsible for quenching of the orbital moment in the transition metals and the spin-orbit interaction is the second strongest in the case of the 4 / systems.
For a particular system, it is usually possible to start from either the itin erant or the localised description and add either localisation or itinerancy as a perturbation. However there are magnetic systems, which comprise both limits, although at different temperatures. For instance, mixed valence or heavy fermion systems point to strongly correlated 5/-electron states pinned at the Fermi level at low tem peratures, whereas at higher tem peratures the magnetic susceptibility obeys the Curie- Weiss law with effective moments close to free ion values, which is usually taken as a sign of localised character.
2.1
C urie param agnetism
Param agnetism in actinide compounds arises from the incomplete 5 / shell. In the simplest case, the following relation is found for the susceptibility
X = ^ - « (2.1)
where T is the absolute tem perature, C is the Curie constant, 6 the Weiss constant and a is a tem perature-independent term which is often the small diamagnetic contribution of the electrons in filled shells. This is the Curie-Weiss law (when a is neglected). The experimental results are often expressed in terms of an effective m om ent per ion
Me// =
\l
(2.2)Chapter 2. Theory 28 field will be shifted upwards, and those with parallel components downwards. At therm al equilibrium there will be therefore fewer ions in the excited states and the distribution of ions over the several states averages at therm al equilibrium.
Considering a perfect gas of magnetic ions is a first approximation to the problem of the effect of a magnetic field to an array of ions, where we neglect the effects of the crystalline electric field (CEF) present in solids. Each state of a free ion is characterised by a quantum number, J , which measures the m agnitude of its total angular momentum. For a given value of J , say J ', there are (2 J '+ l ) such states each characterised by a different value of the magnetic quantum number M j, which may take the values + J ', + (J'-l),..., - (J '- l), -J '. They differ in th at, when a magnetic field is applied, they have different components of the permanent ionic dipole moment in the field direction. This component, p n , is determined by M j thus;
Ph = gM jpB (2.3)
where g is the Lande factor. The splitting by the field p n B is generally very much smaller than k s T except in the largest attainable fields and at very low tem peratures. The susceptibility of the system arises from the changing thermal population of each of these levels.
2J' + 1 ( 2J' + 1 ^ 1 f ^ \
(2.4)
j v g v y ( j + i) % c
^ SkeT ZksT T ^ ’
where peff = 9 T B y /J { J + 1) is the effective magnetic moment of each ion.
2.2
The crystal electric field
The magnetic moments are subject to the effect of electrostatic fields originating from the neighbouring atoms in the solid. The influence of the crystal electric field is, in the case of rare earths and actinides, a few orders of magnitude smaller than the spin orbit interaction and can be treated as a perturbation of the free ion Hamiltonian. In the presence of a crystal field the (2 J'+ 1 ) fold degenerate ground state is split into a sequence of crystal field levels. The Hamiltonian for the perturbation produced by the crystal field
4’Tfn — — _ f
has charges qj at distances Rj from the origin th at influence the unpaired elec trons, Qi and each component can be expressed as a radial function and a spherical harmonic [1].
Chapter 2. Theory 30
Hc f = Y . Y . ^ T O T [ J i ) (2.7)
i l,m
For low symmetries more terms are needed, while the simplest cubic can be ex pressed with two independent Stevens operators, see Appendix A for this simple case. For a full list of Stevens operators, see Hutchings [4]. The resulting eigen vectors of the Hamiltonian are expressed following the convention of Bethe [5].
The energy splittings between levels of the crystal field are often comparable to therm al energies and consequently physical quantities are strongly affected by the changing populations of these levels. Techniques more frequently used to determine the effect of the crystal field in metallic samples include heat capacity, susceptibility, magnetisation and neutron scattering. The magnetic contribution to the specific heat is given by
e x p{-/3E,) - E iexp (2.8)
where P = l/A:gT and the sum is taken over all (2J4-1) levels. This contains only the energies of the crystal field levels.
[7, 8] as
Xa{T) = ((fi
- 2 W E E ^ ^ K r , | J . | r , , l '
- { g f i s f P f e . (2.9)
When the ground state is not magnetic, the only contribution to the susceptibility at low tem peratures comes from the van Vleck coupling to the excited states.
To calculate the magnetisation in high magnetic fields, perturbation theory is no longer valid and a full Hamiltonian, including the Zeeman term, must be diagonalised. The magnetisation is then obtained from the magnetic moment of each eigenfunction, Ti
Ma{T) = ^ ^ ( r . / \Ja\Tj/) exp ( - P E J ) . (2.10)
2.2.1
C rystal field interactions
Let consider the simple model of two singlet states separated by an energy A, with energies Eq and E\ and population factors no and n% [9]. Eq is the ground state, and the levels are coupled in one direction only with a m atrix element between the levels Ma — |(11 Ja| 0)|. The non-interacting a-direction susceptibility, Xaa is w ritten in the mean field approximation as
Chapter 2. Theory 32
where J ’(q) is the Fourier transform of the the exchange. This gives a q dependent susceptibility
> . . ( « , (2. 13)
where Eg is the dispersion relation of the excitations between the two levels
= [A (A - 2 (no - % ) ^ (2.14)
This dispersion relation can be obtained from the position of the excitation peak observed with inelastic neutron scattering. If is large, then strong dispersion will occur even if the system has weak exchange.
2.3
Quadrupolar interactions
the magneto-elastic coupling and drive a quadrupolar ordering in the param ag netic phase. According to the sign of the quadrupolar pair interactions, ferro- or antiferroquadrupolar orderings have been observed [10].
This coupling is mediated by the conduction electrons which act as the medium through which the coupling is established between the / electrons localised on the ions, and is called indirect exchange. Ruderman and K ittel [11] calculated this coupling quantitatively for nuclear moments embedded in a free-electron gas. Kasuya [12] and Yosida [13] extended the treatm ent of this R K K Y interaction to localised moments. The starting point of the indirect exchange of the localised moments is the Heisenberg-Dirac exchange between the localised moments and the conduction electrons and leads to an effective Heisenberg interaction, see [9] for details.
In a form analogous to the Heisenberg coupling between magnetic dipoles, a two-ion coupling between quadrupoles is possible [14], for which evidence has been found in several rare earth intermetallic compounds [15]. The Heisenberg coupling can be expressed in terms of the molecular field approximation when the interaction between the two ions can be replaced with an ion under the efect of an average magnetic field
'Hex = ^ Bi • Ji- (2.15)
i
According to symmetry considerations, the corresponding quadrupolar Hamilto nian, in the molecular field approximation, may be w ritten as
%Q = -K -^ {{Ol)Ol + Z { 0 l ) 0 l ) - m y ) P . y + (Py,)Py. + (2,16)
Chapter 2. Theory 34
operators [4], and and are two-ion quadrupolar param eters corresponding to the two linear combinations of quadrupolar operators.
2.4
From “single im purity problem ” tow ards “in
teracting im purities”
2.4.1 A nderson m odel
This model was introduced [16] with the aim to describe the magnetic properties of a single magnetic impurity (here we will assume /-electron impurity) immersed in a non-magnetic metallic host lattice. It uses the concept of a resonant state, which can be occupied simultaneously by two interacting particles. The model includes the Coulomb repulsive interaction U between localised / states, their hybridisation with conduction-electron states described by m atrix element with dispersion e(^):
'HAnd = Ç + « / I T + U n / ^ n f i + Ç - I - % c ±
ka ^ ka
(2.17) where cr is a spin index (either / or j.), /+ and c+ ( / and c) are the creation (an nihilation) operators of the localised and conduction electron states, respectively. Ufff and rij^^ are the corresponding number operators.
the c?-shell state and form a magnetic 5' = | state. Due to the hybridisation both / states (spin t and 4^) are broadened, enabling partial occupancy, if all states up to Ey are filled. When the hybridisation is weak the occupancies for the occupied and unoccupied states are 1 and 0, respectively. In the strong hybridisation limit, the impurity level becomes broader, intersects the Fermi level and gets partially depopulated. In this case there is an additional contribution to the density of states at the Fermi level and hence also an enhanced specific heat.
Although the Anderson model explains qualitatively the im portant phenom ena related to the hybridisation between localised states and conduction electrons, it requires non-trivial extensions to become relevant to actinide materials: It ne glects orbital degrees of freedom, the periodicity of magnetic “im purities” and it is limited to a single conduction band. Although it is possible to construct a “periodic Anderson Hamiltonian” , there are reasonable doubts to such extension. First, the number of electrons released by the impurities could be a significant factor in changing the position of the Fermi level. Second, the strength of the hybridisation between the localised and conduction states is treated in the single-impurity model as constant, independent of the geometric details of the surrounding of the localised electron which is an im portant factor in a crystalline solid. Third, the Anderson model cannot predict or even account for cooperative phenomena at low tem peratures which are consequences of lattice periodicity and coherence.
However the Anderson model provides a good starting point for more elabo rate approaches and gives a clear idea concerning the infiuence of hybridisation on magnetic properties of solids.
2.4.2
K ondo m odel
Chapter 2. Theory 36
to another im portant type of Hamiltonian, which involves the interaction term given by
J* =
^
(2 .18)[(^/) (£/ + U)]
called the Kondo exchange parameter. The Kondo model involves, apart from the energy of conduction electrons, the interaction term
Hex = - 2 J * s - 5 (2.19)
which couples the localised moment (S) and the conduction electron spin mo ments (s] antiferromagnetically through the effective interaction param eter J*. Due to this interaction, in the ground state the impurity spin is completely screened and compensated by conduction electrons. The ground state is a non magnetic singlet. Such a type of ground state is characterised by a logarithmic increase of electrical resistivity below a characteristic tem perature given by
where Tp denotes the Fermi tem perature. There are also other significant con sequences of the formation of Kondo state on physical properties. The specific heat for instance becomes linear in tem perature well below T p and exhibits a maximum near it. The magnetic susceptibility shows in the vicinity of Tk also a maximum, but it becomes tem perature independent at lower tem peratures.
The interaction of localised moments with conduction electrons may lead to an effective interaction between localised moments themselves. This type of in teraction is of the RKKY-type.
B ibliography
[1] K. W. H. Stevens, Magnetic Ions in Crystals (Princeton University Press, Princeton, USA, 1997).
[2] K. W. H. Stevens, Proc. Phys. Soc. A 213, 237 (1952). [3] K. W. H. Stevens, Proc. Phys. Soc. 65, 209 (1951).
[4] M. T. Hutchings, in Point-Charge Calculations of Energy Levels of Magnetic Ions in Crystalline Electric Fields, Solid State Physics (Academic Press, San Diego, 1962), Vol. 16, pp. 227-273.
[5] A. Bethe, Annalen der Physik 3, 133 (1929).
[6] J. H. van Vleck, The theory of electric and magnetic susceptibilities (Oxford University Pres, Oxford, 1932).
[7] W. Matz, B. Lippold, E. A. Goremychkin, A. Andreeff, H. Greissman, and T. Frauenheim, in Crystalline Electric Field and Structural Effects in f-electron Systems, edited by J. E. Crow, R. P. Guertin, and T. W. Mihalisin (Plenum Press, New York & London, 1979), pp. 69-82.
[8] G. J. Cock, On the High-Field Magnetization of some Rare Earth Metals and Alloys Ph.D. thesis. University of Amsterdam, 1976.
[9] J. Jensen and A. R. Mackintosh, Rare Earth Magnetism. Structures and Ex citations, The International Series of Monographs in Physics (Oxford Uni versity Press, Oxford, England, 1991).
[10] P. Morin and D. Schmitt, in Quadrupolar Interactions and Magneto-Elastic Effects in Rare Earth Intermetallic Compounds, Ferromagnetic Materials (Elsevier Science, Amsterdam, The Netherlands, 1990), Vol. 5, pp. 1-132.
11
12
13 14 15 16 17 18
M. A. Ruderman and C. Kittel, Phys. Rev. 96, 99 (1954). T. Kasuya, Prog. Theor. Phys. 16, 45 (1956).
K. Yosida, Phys. Rev. 106, 893 (1957).
D. Schmitt and P. M. Levy, J. Magn. Magn. Mater. 49, 15 (1985).
P. M. Levy, P. Morin, and D. Schmitt, Phys. Rev. Lett. 42, 1417 (1979). P. W. Anderson, Phys. Rev. 124, 41 (1961).
C hapter 3
E xp erim en tal techniques
Two different types of techniques have been used in the present work. Firstly, macroscopic techniques in which a sample of the m aterial under study is probed with an external interaction (magnetic field, tem perature, pressure...) and we measure the changes in the various properties of the material. These techniques probe the bulk properties of the material and the effect has to be averaged to all the atoms th a t form the studied sample. Secondly, the microscopic techniques al low us to use atomic interactions of probe particles (photons, neutrons, muons...) with the sample, to study properties at an atomic level.
We have used in this work bulk magnetometry and neutron scattering.
3.1
M agnetom etry
Susceptibility and magnetisation studies have been made using Quantum Design SQUID magnetometers, mainly located at the Physics Department, Birkbeck College and at The Royal Institution of Great Britain, London.
The SQUID (Superconducting Quantum Interference Device) magnetome ter measures magnetic moments by moving the sample under a magnetic field through the centre of two sense coils, producing an output voltage proportional
to the current induced.
A SQUID is a small ring of superconducting m aterial (typically Niobium) interrupted by a thin layer of non-conducting m aterial ( “weak link” ) constituting a Josephson junction with a critical current of the order of 10//A. If the intensity of the current th a t crosses the junction exceeds this critical value then the flux trapped inside the ring can change by an integer number of flux quanta 0Q = h/2e (2.067X10“ ^^Wb). SQUID devices owe their extraordinary characteristics to the fact th a t the flux trapped inside the ring is quantised. A SQUID can measure very small changes of magnetic flux, by counting the flux quanta absorbed or released by the ring [1].
The standard measurement process consists in moving the sample over a dis tance of 4cm, passing through two counter-wound superconducting coils con nected to the SQUID input - two cycles are usually performed, and the coils provide an effective means to remove background noise. The sample is held at the centre of a 20cm clear plastic drinking straw, with kapton tape wrapped around the sample or either a small cylinder of Perspex inserted in the centre of the straw, to prevent it slipping downwards during the measurement. An au tom atic centring algorithm is provided in the control software to position the sample in the centre of the applied magnetic field. The magnetometer has a su perconducting solenoid th at provide magnetic fields up to 7T, and tem peratures between 2K and 300K are available.
3.2
N eu tron scattering
Chapter 3. Experimental techniques 42
properties of materials.
The neutron is composed of one up and two down quarks with charges of 2/3 and -1/3, respectively. The internal structure of the neutron leads to an electric charge distribution which is responsible of the magnetic moment and electric polarisability of the neutron [2]. Neutrons have four basic properties th a t make them unique for spectroscopy:
• The chargeless nature of neutrons leads to a high penetration depth and the possibility to come close to the nuclei. Hence they interact weakly with m atter via short range nuclear and magnetic interactions and first order perturbation theory -B orn approximation -is wholly adequate using an appropriate (Fermi) pseudo-potential. This also means th a t a neutron beam can penetrate a bulk sample without a severe loss of intensity and make possible the use of sophisticated environments like cryostats, furnaces, magnets. In constrast, with X-rays only an small amount of the surface is studied and the use of equipment around the sample is more limited. Ele mentary particle physicists are searching for a small electric dipole moment, which would correspond to an anisotropic charge distribution and hence to a finite electric net charge. The most accurate measurements give 10“ ^^e which is very tiny indeed.
• The mass of the neutron is such th at the de Broglie wavelength of ther mal neutrons (T = 300K) is of the order of interatomic distances (2Â) and its energy (25meV) is comparable to elementary excitations (phonons, magnons, solitons, ...). Sometimes is possible to have different m oderators and hence different ranges of wavelengths and energies.
• The fermionic nature of neutrons (S = 1/2) leads to a spin dependence of the scattering cross-section. Polarised neutron beams are used to study weak atomic moments or even nuclear magnetism at low tem peratures. Neutrons are produced in nuclear reactions and their use is restricted to large scale facilities. There are two types of sources: Steady State Reactors where neutrons are produced by fission of uranium and provide a continuous flux and Pulsed Accelerator Sources where neutrons are produced by Spallation which is a process th a t uses accelerated protons to spall (chop pieces off) a heavy-target nucleus and produces a pulsed beam of neutrons. The fact th at the beam is pulsed means th at the instruments are conceptually different to those at a reactor. Of course the beam can also be chopped in a reactor leading to a pulsed beam if required for a specific instrument. For more references on neutron sources, moderators, detectors I refer to [3, 4].
The use of neutrons for spectroscopy is expensive and the use of large scale facilities normally requires collaboration between countries. Thus neutrons are only used where no other technique can be used. Neutrons cannot be substituted by X-rays. Both techniques are complementary.
Chapter 3. Experimental techniques 44
F ig u r e 3.1: Geometry for a general scattering experiment.
We set up a neutron counter and measure the number of neutrons scattered in a given direction as a function of their scattered energy Ey. We define the partial differential cross-section as the number of neutrons scattered per second into a small angle dQ in the direction (j) with final energy between Ey and E y + d E y
per fiux, dH and dEy.
The partial differential cross-section has units of area and it is expressed normally in bams (10“ ^"^ cm^). In the Born approximation and assuming th a t the neutron is scattered just once by the target, we can write the partial differential cross-section for the general case [8]
a d E t d E
kf f mj^ \ 2
At , a.
E l ( T A / , a . , 5 ( 6 + E x , - E x , ) (3.1)
where A^,Ay denote the initial and final states of the scattering system, dy, dy the initial and final spin states of the neutron, pa^, p^, the occupation probabilities
Thus, via Fermi’s Golden Rule, the partial differential cross-section depends on the m atrix elements of the interaction potential between the neutron and the sample.
The elastic scattering term (for all neutron energies in the partial differential cross-section) is associated with the change in direction of the neutrons without loss of energy. Because of their undulatory nature, diffraction patterns can be measured and used to establish where the atoms are. The magnetic diffraction pattern can then show how the magnetic dipoles are oriented in magnetic crystals due to the magnetic dipole moment of neutrons th at makes them sensitive to magnetic forces.
The inelastic scattering is associated with the change of direction and energy of the neutron when they interact with m atter. They can then generate or annihilate atomic vibrations in crystals and liquids, or spin waves in magnetic materials.
3.2.1
E lastic scattering
As we are concerned with the scattering of thermal neutrons (E < O.leV), their energy is not sufficient to change the internal energy of the nucleus. The scatter ing by a single nucleus can be considered therefore as elastic, i.e., | ki | = | kf |,
|AJ = |Ay). Moreover, as the nuclear forces are short range compared with the neutron wavelength, the scattering process can be adequately described by s- waves in perturbation theory. The scattering is then isotropic and can be charac terised by a single param eter called the scattering length (6). Thus the interaction potential of a neutron with a nucleus at the position Ri can be w ritten as:
VN{f) = ( — ] bi 5 ( r - R.) (3.2)
Chapter 3. Experimental techniques 46
It is usual to introduce a scattering amplitude operator a{Q) defined as follows:
{X„af\a{Q)\\„ai) = ^ (3, 3)
where Q = ki - kf defines the scattering vector. Then from (3.1) and (3.3) the elastic scattering cross-section takes the very simple form:
(^)
^ (3.4)where ( . . . ) means the expected value calculated over the states |A) of the sample. From (3.3) it can be shown th at the scattering amplitude operator is proportional to the Fourier transform of the interaction potential:
a{Q) = ^ / e*^^V {r)ér (3.5)
Let us consider a sample built up from N individual scattering centres located at the positions The potential of the neutron-sample interaction can be decomposed in a sum of interactions between the neutron and the N scattering centres:
N
i=l

![Figure 4.5: Crystal field scheme calculated with the effective charges of Murrayand Buyers [ 6].](https://thumb-us.123doks.com/thumbv2/123dok_us/8612090.1401798/73.595.97.495.111.358/figure-crystal-scheme-calculated-effective-charges-murrayand-buyers.webp)
![Figure 4.6: Dispersion of collective excitations in UPda as in [5].](https://thumb-us.123doks.com/thumbv2/123dok_us/8612090.1401798/74.597.143.452.127.385/figure-dispersion-of-collective-excitations-in-upda-as.webp)