Distributional Hypernym Generation by Jointly Learning
Clusters and Projections
Josuke Yamane† Tomoya Takatani‡ Hitoshi Yamada‡ Makoto Miwa† Yutaka Sasaki†
†Toyota Technological Institute ‡Toyota Motor Corporation
†{sd16432,makoto-miwa,yutaka.sasaki}@toyota-ti.ac.jp ‡{tomoya takatani,hitoshi yamada aa}@mail.toyota.co.jp
Abstract
We propose a novel word embedding-basedhypernym generationmodel that jointly learns clus-ters of hyponym-hypernym relations, i.e., hypernymy, and projections from hyponym to hyper-nym embeddings. Most of the recent hyperhyper-nym detection models focus on ahypernymy classifi-cationproblem that determines whether a pair of words is in hypernymy or not. These models do not directly deal with a hypernym generation problem in that a model generates hypernyms for a given word. Differently from previous studies, our model jointly learns the clusters and pro-jections with adjusting the number of clusters so that the number of clusters can be determined depending on the learned projections and vice versa. Our model also boosts the performance by incorporating inner product-based similarity measures and negative examples, i.e., sampled non-hypernyms, into our objectives in learning. We evaluated our joint learning models on the task of Japanese and English hypernym generation and showed a significant improvement over an existing pipeline model. Our model also compared favorably to existing distributed hypernym detection models on the English hypernym classification task.
1 Introduction
Hypernym-hyponym relations, a.k.a. hypernymy, are important information for several NLP tasks such as question answering and ontology construction. Some manually-constructed semantic resources like WordNet contain hypernymy; however, they have limited coverage. Plenty of studies have been con-ducted to automatically detect hypernymy, e.g., (Hearst, 1992; Roller et al., 2014; Fu et al., 2015).
Hypernymy detection was traditionally often tackled with unsupervised methods using Hearst-style patterns (Hearst, 1992) or distributional inclusion hypothesis (Geffet and Dagan, 2005). These methods treat hypernymy pairs individually. Recent progress in the word representation allows to represent words in a shared low-dimensional vector space, and several models using the distributional word representation or word embeddings have been proposed for hypernymy detection (Roller et al., 2014; Weeds et al., 2014; Turney and Mohammad, 2015; Levy et al., 2015). Such models employ supervised learning. Most of the models focus on ahypernymy classificationproblem, i.e., whether a given word pair is in hypernymy or not, and they ignore a more practicalhypernym generationproblem to generate hypernyms for a given word.
Few studies have examined hypernym generation using word embeddings (Fu et al., 2015; Tan et al., 2015). Fu et al. (2015) proposed a two-step, pipeline model that partitions hypernymy pairs into several clusters and learns a projection matrix between words in a pair for each cluster separately. The projection matrix projects the embedding vector of a hyponym close to that of its hypernym. The incorporation of clustering allows representing several types of hypernymy and shows a higher performance than other traditional models in constructing semantic hierarchies. The clusters, however, may not be appropriate for hypernym generation since clustering is independent of hypernym generation.
This paper presents a novel hypernym generation model that jointly learns clusters of hypernymy and the projections from hyponyms to their hypernyms in the clusters . Unlike most previous supervised This work is licenced under a Creative Commons Attribution 4.0 International License. License details: http:// creativecommons.org/licenses/by/4.0/
models using word embeddings, we target the hypernym generation problem, not hypernymy classifi-cation. This paper has newly incorporated the following points into hypernym generation. First, our model performs the clustering of the relations with learning projection matrices jointly, to obtain ap-propriate clusters for hypernym generation. Second, motivated by DP-means (Kulis and Jordan, 2012), our model adjusts the number of clusters during training so that the model can fit the number of clus-ters to the training data. Third, the similarity measure in learning projection matrices is selected to be consistent with one in training word embeddings. Finally, we use sampled non-hypernym instances in learning projection matrices so that our model can distinguish hypernymy from non-hypernymy. We evaluated our model on hypernym generation tasks in Japanese and English, as well as a well-studied hypernymy classification task in English. Our joint learning model shows a significant improvement over a pipeline learning model (Fu et al., 2015) on the hypernym generation tasks. As for the hypernymy clas-sification, our model showed a comparable performance to the state-of-the-art hypernymy classification model (Levy et al., 2015).
2 Related Work
In the task of detecting hypernym, traditional approaches focused on Hearst-style lexical patterns that indicate hypernymy (Hearst, 1992; Snow et al., 2005; Kozareva and Hovy, 2010). For instance, from a sentence... works by such authors as Shakespeare ..., an “is-a” pair betweenShakespeareandauthorcan be detected by using a pattern that a wordAis a hypernym of another wordBwhenAandBare linked bysuch A as B. These methods typically show high precision but suffer from low recall because many hypernymy pairs are not explicitly mentioned in texts as such patterns.
To overcome the problems of the lack of explicit hypernymy mentions, several other traditional unsu-pervised methods are proposed based on distributional inclusion hypothesis. This hypothesis states that a term can only be used in contexts where its hypernyms can be used and that a term might be used in any contexts where its hyponyms are used (Geffet and Dagan, 2005; Kotlerman et al., 2010). These methods have shown limited performance because the hypothesis is not always correct and it cannot distinguish co-hyponymy and meronymy from hypernymy.
Recently, distributed word representation or word embeddings such as skip-gram (Mikolov et al., 2013) and ivLBL (Mnih and Kavukcuoglu, 2013) has been often employed for the task of detecting hypernymy, since such representation are shared among words. Most models using word embeddings focus on a hypernymy classification task where a model needs to predict whether a given word pair is in hypernymy or not. They take distributional vectors for a pair of a wordxand its candidatehypernymy
as input, calculate features from these vectors, and predict whether the pair is in hypernymy or not using a classifier like support vector machines (SVMs). For example, theconcatmodel (Baroni et al., 2012) uses the concatenation of hypernymy pairhx,yi, while thediff model (Roller et al., 2014; Weeds et al., 2014; Fu et al., 2015) useshy−xi. Here,xandyrepresent word embeddings ofxandy, respectively. These classification-based models, however, have not been evaluated on hypernym generation, where a model generates hypernyms for a given word.
Less work has been done on hypernym generation using word embeddings (Fu et al., 2015; Tan et al., 2015). Fu et al. (2015) proposed a model of using the projection matrices, each of which projectsx to
y. They proposed a two-step, pipeline algorithm to detect hypernym. The first step is clustering. They partitioned training pairs into clusters usingk-means so that pairs in each cluster are close in the sense of the differences (offsets) betweenxandy, i.e.,hy−xi. The second step is projection. They trained a projection matrixΦcfor each clusterc. Φcis obtained by using the least squares objective:
Φ∗c = arg min
Φc 1 Nc
X
(x,y)∈Pc
kΦcx−yk2, (1)
wherePcis a set of word pairs in c-th cluster andNc is the number of word pairs inPc. This model
performs clustering and projection separately, so the performance of clustering depends on the offsets
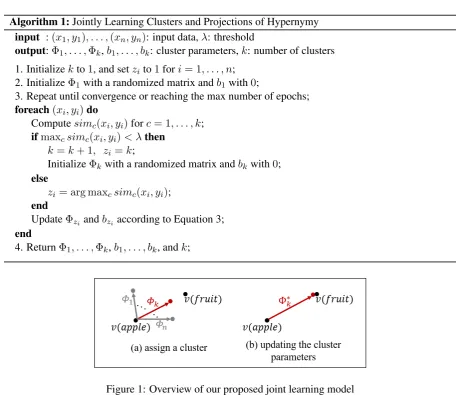
Algorithm 1:Jointly Learning Clusters and Projections of Hypernymy input :(x1, y1), . . . ,(xn, yn): input data,λ: threshold
output:Φ1, . . . ,Φk,b1, . . . , bk: cluster parameters,k: number of clusters
1. Initializekto1, and setzito1fori= 1, . . . , n;
2. InitializeΦ1with a randomized matrix andb1 with0;
3. Repeat until convergence or reaching the max number of epochs; foreach(xi, yi)do
Computesimc(xi, yi)forc= 1, . . . , k;
ifmaxcsimc(xi, yi)< λthen k=k+ 1, zi=k;
InitializeΦkwith a randomized matrix andbkwith0;
else
zi = arg maxcsimc(xi, yi);
end
UpdateΦzi andbzi according to Equation 3;
end
[image:3.595.68.525.51.446.2]4. ReturnΦ1, . . . ,Φk,b1, . . . , bk, andk;
Figure 1: Overview of our proposed joint learning model
the projection matrices are trained independently. Further, this model does not consider non-hypernymy pairs during training, so it is not clear how the model performs on non-hypernymy pairs.
3 Jointly Learning Clusters and Projections of Hypernymy
This paper proposes a novel model that learns projections from words to their hypernyms and clusters of hypernymy jointly. Our model automatically estimates the number of clusters, motivated by DP-means clustering (Kulis and Jordan, 2012) that automatically estimates the number of clusters during clustering unlikek-means.
In learning the projections and clusters, our model receivesd-dimensional word embeddings and train-ing word pairs as its input, clusters the pairs with updattrain-ing the cluster parameters (d×dprojection ma-trices and bias terms in a similarity measure), and produces cluster parameters as its output. After the parameters are learned, our model generates hypernyms for a given word by projecting a word by using the projection matrices and selecting words that have the highest similarities with the projected word.
We will detail the learning and hypernym generation processes in the rest of this section.
3.1 Joint learning
Our joint learning model starts learning with a single cluster that includes all the training pairs and learns projection matrices with automatically increasing the number of clusters during learning. The entire algorithm is shown in Algorithm 1.
cluster for the target pair and then updates the parameters of the cluster as in Figure 1.
To find an appropriate cluster for a training pair, our model first calculates the similarity between the words in the pair for all the clusters and adds the pair to a cluster that achieves the highest similarity. Our similarity measure is based on an inner product, which is used in learning word embeddings. The similarity is defined as:
simc(xi, yi) =σ(Φcxi·yi+bc). (2)
Here,Φc denotes ad×dprojection matrix forc-th cluster,bcdenotes bias ofc-th cluster, σ denotes a
logistic sigmoid function, andxi andyi are normalized word embeddings ofxi andyi. This similarity
measure calculates how close the matrixΦcprojectsxi toyi. Using the similarities, our model
catego-rizes the pair into a cluster with the highest similarity if the similarity is beyond a threshold λ. If all the similarities are below the threshold and no matrix projectsxclose enough to y, our model instead generates a new cluster and assign the cluster to the pair.
After a cluster is assigned to a pair, our model updates the cluster parameters (Φandb) of the cluster for projection matrix and similarity measure. During the update of the parameters, motivated by negative sampling (Mikolov et al., 2013), our model generates pseudo negative non-hypernyms and penalizes the parameters so that the model do not generate the non-hypernyms in prediction. Our model maximizes the following objective function:
J =Xk c=1
X
(x,y)∈Pc
log simc(x, y) + m X
i=1
log 1−simc x, y0i !
. (3)
Here,kis the current number of clusters,y0
i(6=y)denotes a negative sample, andmdenotes the number
of negative samples. For the negative samples, our model selects the most confusing words that show the highest similarities with xbecause this selection produced better results than uniform sampling in our preliminary experiment.
Although our model employs clustering and projection matrices, it is substantially different from Fu et al. (2015). Our model newly incorporates the following points into hypernym generation:
• our model jointly learns clusters of hypernymy and the cluster parameters, i.e., projection matrices
Φs and biasesbs, so that the clusters and their parameters are well tuned to hypernymy generation and the cluster parameters are tuned so that similarity measures are consistent among all the clusters.
• our model automatically determines the number of clusters based on the similarity thresholdλin order to determine the appropriate number of clusters for the target data set.
• our model employs the same similarity measure as that used in training word embeddings, in order to keep consistency of word similarity in our model and word embedding training.
• our model uses negative non-hypernymy instances during training, which allows the model not only to keep the projection of hyponym far from wrong hypernyms but also to deal with non-hypernymy instances in prediction.
3.2 Hypernym generation
Since we do not know which cluster a pair ofxandwbelongs to, we check all the clusters and select the most appropriate cluster that produces the highest similarity for the pair. When generating hypernyms for a wordx, we calculate the similarity score for each wordwin our vocabulary as follows:
scoregen(x, w) = maxc simc(x, w). (4)
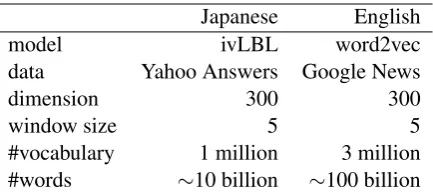
Japanese English
model ivLBL word2vec
data Yahoo Answers Google News
dimension 300 300
window size 5 5
#vocabulary 1 million 3 million
#words ∼10 billion ∼100 billion
Table 1: Data and parameters in learning word embeddings
Japanese (ALAGIN) English (Baroni)
#train 14,814 970 (2,011)
#validation 1,752 69 (223)
#test 4,598 346 (536)
#total 21,164 1,385 (2,770)
[image:5.595.190.407.61.158.2]#hypernyms / #hyponym ≈1 ≈1.22
Table 2: The number of hypernymy relations and the average number of hypernyms per hyponym in the hypernymy data sets. The numbers in parentheses show the total number of positive and negative pairs in the English data set.
4 Evaluation Settings
We evaluate our model on Japanese and English hypernymy data sets. We will first explain resources for these two language data sets, and then explain the task settings.
4.1 Data sets
Our model requires word embeddings and training data of hypernymy pairs.
We obtained word embeddings for Japanese by applying ivLBL (Mnih and Kavukcuoglu, 2013) to texts crawled from Japanese Yahoo Answers (Yahoo Chiebukuro)1. As for English, we used a
pre-trained Google News word embeddings2(Mikolov et al., 2013), which has shown high performance in
several word similarity tasks. Table 1 summarizes the settings in learning word embeddings. We use the words in the word embedding as our vocabularies.
To obtain supervision for training hypernymy, we used ALAGIN typed hierarchies for Japanese3, and
the data by Baroni et al. (2012) for English. The statistics of the data are shown in Table 2. Word pairs in ALAGIN were made by automatically extracting word hierarchy from Wikipedia (Sumida et al., 2008), selecting the top-level pairs, and manually cleaning the selected pairs. Since this data deal with not only words but phrases, we selected hypernymy pairs that include only words and split the pairs into training, validation, and test pairs. Word pairs of Baroni’s data were extracted from WordNet. While the data originally include 1,385 positives and 1,385 negatives that are from a random permutation of positive pairs, we used only positive pairs for training because our model generates negative pairs during training.
4.2 Task and evaluation settings
We optimized our model parameters with Adam (Kingma and Ba, 2015) with recommended parameters in their paper. We set the number of negative samplesmto 1, according to the preliminary experiment. We tuned other hyperparameters, e.g.,λin our model andkink-means, with the validation data. As a result of several preliminary experiments, we decided other hyperparameters as well. We consider only direct hypernymy in our experiment, differently from Fu et al. (2015). For instance, we consider only
1http://chiebukuro.yahoo.co.jp/
2https://code.google.com/archive/p/word2vec/
Japanese (ALAGIN) English (Baroni) pipeline joint pipeline joint
#clusters 5 19 1 2
[image:6.595.179.419.62.119.2]MRR 0.193 0.349 0.280 0.339
Table 3: MRR of our joint model and the pipeline model on the test parts of the Japanese ALAGIN data set and English Baroni’s data set.
(apple,fruit) and (fruit, plant) pairs for the hypernymy hierarchyapple−→
H fruit −→H plant, and do not
consider (apple,plant). Here,A−→
H Bmeans thatBis a hypernym ofA.
We evaluated our model on the task ofhypernym generationusing both the Japanese ALAGIN data set and the Baroni’s data set. We generate hypernyms from our vocabulary in word embeddings.
To compare our model with the existing projection matrix-based pipeline model of Fu et al. (2015), we implemented their pipeline model, i.e., k-means clustering and projection matrix learning with the least square objective as explained in Section 2, but we did not include indirect hypernymy and employed Adam instead of stochastic gradient descent to optimize the model parameters (projection matrices). In generating hypernyms for a wordx, we assigned a clustercto the pair(x, w)byk-means for each word
win our vocabulary. We then selected words that had the lowest least square distances as the hypernyms ofx. Here, the least square distances are defined as follows:
distancec(x, w) =kΦcx−wk2, (5)
wherewdenotes the word embedding ofw. We call this model as apipelinemodel, in contrast to our
jointmodel.
We use Mean Reciprocal Rank (MRR) for the evaluation of hypernymy generation.
MRR= N1 XN i=1
1
ranki, (6)
whereNis the amount of test data,rankiis the rank which correct hypernym is generated. MRR ranges
from 0 to 1, and higher MRR indicates better performance of the model.
We also used the Baroni’s data set to evaluate the performance of our joint model on a well-studied
hypernymy classificationtask. We compared our model with the state-of-the-art supervised distributional model by Levy et al. (2015). Since our model is not classification-based, we performed the following simple threshold-based classification in order to judge whether a given word pair is in hypernymy or not:
scoregen(x, w) (
≥0.5 ⇒ positive
otherwise ⇒ negative. (7)
5 Evaluation
We present the results of hypernym generation evaluation in section 5.1 and those of hypernymy classi-fication evaluation in section 5.2.
5.1 Hypernym generation
Japanese (ALAGIN) English (Baroni)
pipeline (least squares) joint (inner products) pipeline (least squares) joint (inner products)
[image:7.595.80.517.59.107.2]0.215 0.279 0.321 0.343
Table 4: MRR of our model with inner product-based similarity measure and the pipeline model with least squares-based similarity measure without clustering on the validation parts of the Japanese ALA-GIN data set and English Baroni’s data set.
λ 0 0.1 0.15 0.2
#clusters 1 5 19 44
[image:7.595.330.524.262.373.2]MRR 0.279 0.327 0.368 0.353
[image:7.595.80.271.263.388.2]Table 5: MRR and the number of clusters on the validation part of the Japanese ALAGIN data set.
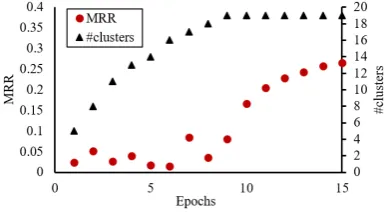
Figure 2: Learning curve of our joint model on the Japanese ALAGIN validation data set.
Figure 3: MRR on the validation set and the number of clusters of our joint model in the early learning stage on Japanese ALAGIN data set.
the English data set was about 6.5% of the Japanese data set in the number of positive instances as in Table 2.
We compare our model and the pipeline model without clustering on the Japanese validation data set in Table 4. Our model uses the inner product-based similarity in Equation 2 and negative sampling in Equation 3, while the pipeline model used the least square distance as in Equation 5. The results show that our model produces better results than the least square-based model.
The threshold of the clustering is a crucial parameter to decide the number of the clusters in our model. Table 5 shows the number of clusters and MRR on the Japanese validation data set when we varied the clustering thresholdλ.
Figure 2 shows the learning curve of our joint model with the best hyperparameter on Japanese val-idation data set. This learning curve is stable except for the initial stage of learning (#epochs≤9). To understand the behavior of the learning in the initial stage, we show MRR and the number of clusters in the first 15 epochs of learning our models in Figure 3. The number of clusters of our model increases in the initial learning stage (#epochs≤9), and it stops to increase after several iterations. Due to this increase of clusters, MRR is unstable in the initial stage of learning. MRR starts to improve constancy after the number of clusters is fixed.
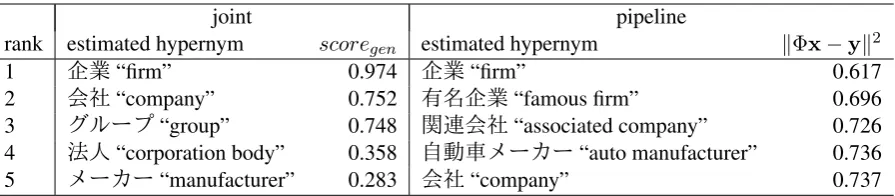
Our joint model and the pipeline model are different from other existing hypernymy classification models in that the former models can generate hypernyms from a given word. We present two examples of estimated hypernyms for given words in Tables 6 and 7.
5.2 Hypernym classification
joint pipeline
rank estimated hypernym scoregen estimated hypernym kΦx−yk2
1 m“firm” 0.974 m“firm” 0.617
2 >“company” 0.752 m“famous firm” 0.696
3 °ëüדgroup” 0.748 ¢# >“associated company” 0.726
4 Õº“corporation body” 0.358 êÕÊáü«ü“auto manufacturer” 0.736
[image:8.595.77.525.61.159.2]5 áü«ü“manufacturer” 0.283 >“company” 0.737
Table 6: Examples of estimated hypernyms for a wordÈè¿êÕÊ“Toyota Motor Co.”.
joint pipeline
rank estimated hypernym scoregen estimated hypernym kΦx−yk2
1 f“study” 0.987 fO“science” 0.645
2 Ö“theory” 0.730 ¹ÕÖ“methodology” 0.710
3 ·¹Æà“system” 0.692 (ž“technical term” 0.737
4 KÕ“method” 0.678 KÕ“method” 0.743
5 €S“technique” 0.504 ¢ë´êºà“algorithm” 0.768
Table 7: Examples of estimated hypernyms for a word_°fÒ“machine learning”.
measures and reported the state-of-the-artF1 score of 0.802. In this comparison, we did not tune our hypernym generation model for the classification task. Instead, we directly applied our best hypernymy generation model in Table 3 to the task by using the hypernymy generation scores as classification scores (see. Equation 7). According to the results, our joint model compares favorably to the state-of-the-art model.
6 Conclusions
This paper proposed a novel word embedding-based hypernym generation model that clusters hyponym-hypernym relations and learns the parameters for the projection from hyponyms to their hyponym-hypernyms in each cluster. Unlike many existing hypernym classification models, our proposed model can generate hypernyms from a given word. This generation will help to directly apply our model to several NLP tasks. Furthermore, the number of clusters is automatically determined according to the word embeddings and the training pairs.
We employ the inner product-based similarity measures so that word similarity can be consistent in training word embeddings and in our model. We also employ negative sampling so that the generated hypernyms can not be close to wrong hypernyms. We evaluate our model over Japanese and English data sets. Our proposed model significantly outperformed the other hypernym generation model on both Japanese and English data sets. We also evaluated our model on the hypernymy classification in English, and, without task-specific tuning, the result showed theF1score comparable to the state-of-the-art model. In future work, we aim to extend our model for indirect hypernyms or hyponymy generation. This extension can improve the model performance and also widen the application areas of our model.
References
Marco Baroni, Raffaella Bernardi, Ngoc-Quynh Do, and Chung-chieh Shan. 2012. Entailment above the word level in distributional semantics. InProceedings of the 13th Conference of the European Chapter of the As-sociation for Computational Linguistics, pages 23–32, Avignon, France, April. AsAs-sociation for Computational Linguistics.
Ruiji Fu, Jiang Guo, Bing Qin, Wanxiang Che, Haifeng Wang, and Ting Liu. 2015. Learning semantic hierarchies: A continuous vector space approach. IEEE/ACM Trans. Audio, Speech & Language Processing, 23(3):461–471.
Proceed-ings of the 43rd Annual Meeting of the Association for Computational Linguistics (ACL’05), pages 107–114, Ann Arbor, Michigan, June. Association for Computational Linguistics.
Marti A Hearst. 1992. Automatic acquisition of hyponyms from large text corpora. InProceedings of the 14th conference on Computational linguistics-Volume 2, pages 539–545. Association for Computational Linguistics. Diederik P Kingma and Jimmy Lei Ba. 2015. Adam: A method for stochastic optimization. InProceedings of the
3rd International Conference for Learning Representations.
Lili Kotlerman, Ido Dagan, Idan Szpektor, and Maayan Zhitomirsky-Geffet. 2010. Directional distributional similarity for lexical inference. Natural Language Engineering, 16(04):359–389.
Zornitsa Kozareva and Eduard Hovy. 2010. A semi-supervised method to learn and construct taxonomies using the web. InProceedings of the 2010 Conference on Empirical Methods in Natural Language Processing, pages 1110–1118, MIT, Massachusetts, USA, October. Association for Computational Linguistics.
Brian Kulis and Michael I Jordan. 2012. Revisiting k-means: New algorithms via bayesian nonparametrics. In Proceedings of the 29th International Conference on Machine Learning (ICML-12), pages 513–520.
Omer Levy, Steffen Remus, Chris Biemann, and Ido Dagan. 2015. Do supervised distributional methods really learn lexical inference relations? InProceedings of the 2015 Conference of the North American Chapter of the Association for Computational Linguistics: Human Language Technologies, pages 970–976, Denver, Colorado, May–June. Association for Computational Linguistics.
Tomas Mikolov, Ilya Sutskever, Kai Chen, Greg S Corrado, and Jeff Dean. 2013. Distributed representations of words and phrases and their compositionality. In C. J. C. Burges, L. Bottou, M. Welling, Z. Ghahramani, and K. Q. Weinberger, editors,Advances in Neural Information Processing Systems 26, pages 3111–3119. Curran Associates, Inc.
Andriy Mnih and Koray Kavukcuoglu. 2013. Learning word embeddings efficiently with noise-contrastive esti-mation. In C. J. C. Burges, L. Bottou, M. Welling, Z. Ghahramani, and K. Q. Weinberger, editors,Advances in Neural Information Processing Systems 26, pages 2265–2273. Curran Associates, Inc.
Stephen Roller, Katrin Erk, and Gemma Boleda. 2014. Inclusive yet selective: Supervised distributional hy-pernymy detection. InProceedings of COLING 2014, the 25th International Conference on Computational Linguistics: Technical Papers, pages 1025–1036, Dublin, Ireland, August. Dublin City University and Associa-tion for ComputaAssocia-tional Linguistics.
Rion Snow, Daniel Jurafsky, and Andrew Y Ng. 2005. Learning syntactic patterns for automatic hypernym discovery. InAdvances in Neural Information Processing Systems, pages 1297–1304.
Asuka Sumida, Naoki Yoshinaga, and Kentaro Torisawa. 2008. Boosting precision and recall of hyponymy relation acquisition from hierarchical layouts in wikipedia. In Nicoletta Calzolari (Conference Chair), Khalid Choukri, Bente Maegaard, Joseph Mariani, Jan Odijk, Stelios Piperidis, and Daniel Tapias, editors,Proceedings of the Sixth International Conference on Language Resources and Evaluation (LREC’08), Marrakech, Morocco, may. European Language Resources Association (ELRA).
Liling Tan, Rohit Gupta, and Josef van Genabith. 2015. Usaar-wlv: Hypernym generation with deep neural nets. In Proceedings of the 9th International Workshop on Semantic Evaluation (SemEval 2015), pages 932–937, Denver, Colorado, June. Association for Computational Linguistics.
Peter D Turney and Saif M Mohammad. 2015. Experiments with three approaches to recognizing lexical entail-ment.Natural Language Engineering, 21(03):437–476.