ISSN(Online) : 2319-8753
I
nternational
J
ournal of
I
nnovative
R
esearch in
S
cience,
E
ngineering and
T
echnology
(An ISO 3297: 2007 Certified Organization)
Vol. 3, Issue 8, August 2014
Effect of Thermal and Thermo-mechanical
Processing Parameters on the Microstructure
and Properties of the API Steel
Pramod Kumar1,*, V.C. Srivastava2, Binod Kumar3, G.K. Mandal2
M. Tech Scholar, Department of Materials Science & Engineering, National Institute of Foundry & Forge Technology,
Ranchi, India1
Scientist, CSIR-National Metallurgical Laboratory, Jamshedpur, India 2
Professor, Department of Materials & Metallurgical Engineering, National Institute of Foundry & Forge Technology,
Ranchi, India3
ABSTRACT: The properties of API steels can be remarkably improved through the proper selection of alloy composition and an appropriate thermo-mechanical controlled processing (TMCP) route. Present investigation aims at the study of the effect of thermal and thermo-mechanical processing on the evolution of microstructures and properties of an API steel at different cooling rates. This investigation mainly leads to better understanding of the influence of deformation, annealing conditions (time and temperature) and cooling rate on the microstructure and properties of the API X60 grade steel.
The experiments consist of heating the specimens to austenizing temperature, isothermal holding at this temperature, specific deformation and then cooling at various cooling rates. It has been observed that the final microstructures and hardness values are greatly influenced by the cooling rates as microstructural constituents change and average ferrite grain size decreases with increase in cooling rate.
KEYWORDS: Thermo-mechanical processing, Microstructure, Recrystallization, Microalloyed steel, Thermal simulation
I. INTRODUCTION
The development of high strength linepipe steels plays an important role for a large number of steel manufacturers. TMCP is one of the major determining factor in the development of high strength low alloy (HSLA) steels [1]. The main function of the linepipe steel is to improve the transport efficiency with higher pressure and transmission rate for long distances. Therefore, linepipe steels must have high strength and toughness at extremely low temperatures, which can be achieved in microalloyed steels. Microstructure of these steels generally consists of ultra-fine ferrite grains with some fraction of bainite [2]. These are usually obtained through the high nucleation rate of ferrite in highly deformed austenite with high dislocation density or high volume fraction of grain boundary in recrystallised austenite with ultra-fine grain size [3-5]. The mechanical properties of API steel can be remarkably improved through an appropriate TMCP parameters that refine and homogenize the final microstructure.
ISSN(Online) : 2319-8753
I
nternational
J
ournal of
I
nnovative
R
esearch in
S
cience,
E
ngineering and
T
echnology
(An ISO 3297: 2007 Certified Organization)
Vol. 3, Issue 8, August 2014
new strain free dynamically recrystallised grains will be formed on the elongated grain boundaries of the original grains and begins to grow [10]. Microalloyed steel having reduced carbon content and high cleanliness results in excellent field weldability [11-12]. During thermo-mechanical treatments, steels are heated up to austenitization temperature and soaked at these temperatures for certain time period, then strained on a multipass schedule under continuous cooling conditions, and cooled to room temperature.
II. EXPERIMENTAL PROCEDURE
In the present investigation, as-received API-X60 grade steel plate of 11.3 mm thickness served as the starting material for the experiments. The chemical composition (wt.%) of this material is shown in Table 1.
Table 1: Chemical composition of the material
C Mn S P Si Al Nb V N
0.063 1.28 0.005 0.018 0.27 0.026 0.024 0.045 0.008
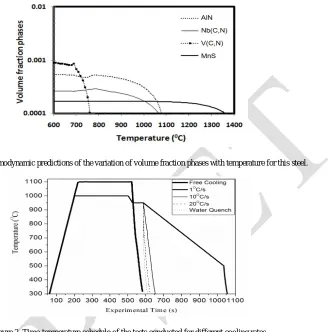
Small pieces of the dimension 20mm15mm11.3mm were machined from the as-received API-X60 grade steel plate. Thermal simulations at different cooling rates were carried out using GleebleTM 3800 thermomechanical simulation system available at CSIR-NML, Jamshedpur. Figure 1 shows the thermodynamic predictions of the variation of volume fraction of phases with temperature for this steel. This calculation was done using simulation software package Thermo-Calc. Figure 1 reveals that dissolution temperatures of V(C,N) and Nb(C,N) are about 760 and 1080˚C,
respectively. Based on the prediction, it can be concluded that all the V(C,N) and Nb(C,N) will be dissolved at the temperature of 1100˚C. Therefore, for thermal simulation, it is planned to heat the specimens to the temperature of
1100˚C for the dissolution of all the carbonitrides and then cooled to 950˚C and homogenized before cooling the
specimens at various cooling rates. However, all the specimens were heated to the temperature of 1000ºC at a rate of
5˚C/s expect one specimen, which was isothermally hold at 1100˚C. Specimens were heated at maximum temperature
of 1000˚C, mainly to avoid the damage of tooling materials due to non availability of some of the consumables during Gleeble experiments. It is also observed, from thermodynamic calculation that all the V(C,N) will be dissolved at the temperature of 1000˚C.
Predictions also reveal the partial dissolution of Nb(C,N) at this temperature.In these experiments, after holding the specimen at the temperature of 1000˚C for 300s, each specimen was free cooled to the temperature of 950˚C. After holding at this temperature for 60 s, specimens were immediately cooled at different cooling rates. Specimens were cooled at various linear rates of 1˚C, 10˚C and 20˚C/s. Some of the specimens were free cooled (FC) and water quenched (WQ). In one experiment, specimen was heated to the temperature of 1100˚C at 5˚C/s and held for 300 s and
ISSN(Online) : 2319-8753
I
nternational
J
ournal of
I
nnovative
R
esearch in
S
cience,
E
ngineering and
T
echnology
(An ISO 3297: 2007 Certified Organization)
Vol. 3, Issue 8, August 2014
Figure 1. Thermodynamic predictions of the variation of volume fraction phases with temperature for this steel.
Figure 2. Time-temperature schedule of the tests conducted for different cooling rates.
In another set of experiment, tests were conducted by applying different cooling rates after deformation of the samples to a strain of 0.5 at strain rate of 1 s-1. Figure 3. shows the time-temperature schedule of the deformation tests conducted for different cooling rates. Expanded region of the time temperature curve reveals the fluctuation in temperature due to the applied deformation load.
Free Cooling
1oC/s
ISSN(Online) : 2319-8753
I
nternational
J
ournal of
I
nnovative
R
esearch in
S
cience,
E
ngineering and
T
echnology
(An ISO 3297: 2007 Certified Organization)
Vol. 3, Issue 8, August 2014
III. RESULTS AND DISCUSSION
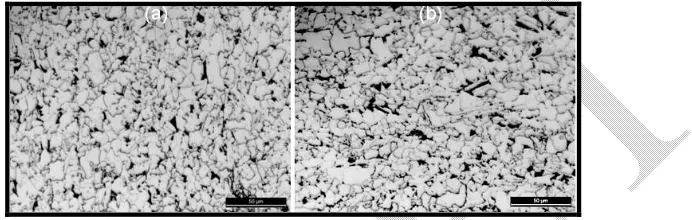
Optical micrographs of as-received specimen along the transverse and longitudinal cross-section are shown in Figs. 4(a) and (b). The micrographs were taken from the centre region of the specimen. Optical micrograph of the as received API X 60 materials shows predominantly polygonal ferrite with few pearlitic region (dark phase). However, elongation of ferrite grains is more in longitudinal section. SEM micrograph, at higher magnification, as shown in Fig. 5, depicts the lamellar structure of pearlite phase (marked as ‘p’) composed of alternating layers of ferrite and cementite.
Figure 4. Optical micrograph of as-received API X60 steel plate (a) Transverse section & (b) longitudinal section
Figure 5. SEM micrograph, at higher magnification depicting the lamellar structure of pearlite phase (marked as ‘p’)
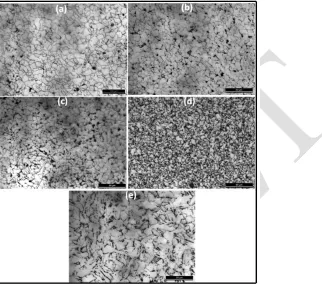
The optical micrograph of the specimens cooled at different cooling rate are shown in Fig. 6. These clearly reveal that final microstructure of the specimens are greatly influenced by cooling rate. The transformed microstructures of this steel are complex during the continuous cooling transformation processes.
For the cooling rate of 1o, 10o and 20oC/s (Figs. 6(a) to (c)), the microstructures reveal mainly polygonal ferrite and pearlite. However, with increase in cooling rate average ferrite grain size decreases. It is interesting to note that no formation of martensite in the microstructure was obtained in the water quenched specimen (Figs. 6(d)). In the water quenched specimen, the austenite transforms to mainly fine grained quasi-polygonal ferrite and acicular ferrite. Figure 6(e) depicts the microstructure of the specimen free cooled from 1100oC without holding at 950˚C. When the specimen
ISSN(Online) : 2319-8753
I
nternational
J
ournal of
I
nnovative
R
esearch in
S
cience,
E
ngineering and
T
echnology
(An ISO 3297: 2007 Certified Organization)
Vol. 3, Issue 8, August 2014
different at different holding temperatures. Micrograph in Fig. 6(e) mainly reveals the presence of quasi-polygonal ferrite, acicular ferrite and bainite.
ISSN(Online) : 2319-8753
I
nternational
J
ournal of
I
nnovative
R
esearch in
S
cience,
E
ngineering and
T
echnology
(An ISO 3297: 2007 Certified Organization)
Vol. 3, Issue 8, August 2014
131 144 155 170 179 100 120 140 160 180 200
1000 °C, 1°C/s 1000 °C, 10°C/s 1000 °C, 20°C/s 1000 °C, WQ 1100 °C, FC
V ic k er H a rd n es s N u m b er ( H V N )
Figure 7. Influence of cooling rate on average hardness values of the API-X60 steel specimens
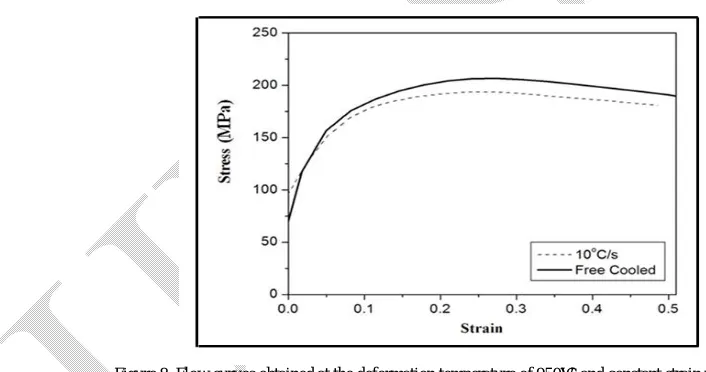
Figure 8 shows the flow curves obtained for the above mentioned deformation conditions. The figure illustrates reasonably good matching with stress-strain values for the two experiments conducted at identical conditions with varying cooling rates after hot deformation. At the deformation temperature of 950oC and constant strain rate of 1 s-1, flow curves display an increase in true stress with initial increase in true strain. A clear peak in the flow curve can be seen at a true strain of about 0.275, thereafter flow stress gradually decreases. Presence of peak in the flow curve indicates the occurrence of dynamic recrystallisation (DRX).
Figure 8. Flow curves obtained at the deformation temperature of 950˚C and constant strain rate of 1 s-1
ISSN(Online) : 2319-8753
I
nternational
J
ournal of
I
nnovative
R
esearch in
S
cience,
E
ngineering and
T
echnology
(An ISO 3297: 2007 Certified Organization)
Vol. 3, Issue 8, August 2014
Figure 9. Optical microstructures of deformed specimen cooled at 1˚c/s; (a) undeformed regions, (b) in between deformed and undeformed region, (c) deformed region
The cross-sectional SEM micrographs of deformed region along the thickness direction both for hot deformed specimens cooled at 1˚C/s as well as specimen allowed to cool freely after deformation are shown in Fig. 10(a) & (b), respectively. Comparison of SEM micrographs clearly reveals the larger ferrite grain size in the specimen cooled at constant cooling rate of 1oC/s in comparison to free cooled specimen.
Figure 10. SEM microstructures taken from deformed region along thickness direction of hot deformed specimens (a) Cooled at 1˚C/s after deformation, (b) Free cooled after deformation
IV.CONCLUSIONS
Based on the the results obtained in the present study, the following conclusions can be drawn:
1) As-received API X60 materials predominantly consisted of polygonal ferrite with few pearlitic regions. 2) The microstructures are greatly influenced by cooling rate. Microstructures of the specimens cooled at
different linear cooling rates up to 20˚C/s reveal mainly polygonal ferrite and pearlite. With increase in cooling rate average ferrite grain size decreases.
3) Hardness values also considerably affected by cooling rate. Water quenched and free cooled specimens have higher hardness values in comparison to the specimens cooled at different linear cooling rates up to 20˚C/s. 4) Flow curves of the hot deformed specimens, at strain of 0.5 and strain rate of 1 s-1, reveal initial work
ISSN(Online) : 2319-8753
I
nternational
J
ournal of
I
nnovative
R
esearch in
S
cience,
E
ngineering and
T
echnology
(An ISO 3297: 2007 Certified Organization)
Vol. 3, Issue 8, August 2014
REFERENCES
[1] API Specification 5L, "Specification for Line Pipe", 42nd Edition, 2000, American Petroleum Institute, USA. [2] Xiaoyong Zhang, Huilin Gao, Xueqin Zhang, Yan Yang, Materials Science and Engineering A 531 (2012) p. 84. [3] G. Zhu, S. V. Subramanian, Material science and engineering A 426 (2006) p. 235.
[4] Z. Q. Sun, W. Y. Yang, J.J Qi, Mater. Sci. Forum 475-479 (2005) p.49.
[5] E. V. Konopleva ,H. J. McQeen, V. M. Khlestov, Proceeding of the thermomechanical Processing of steels, London, UK, May 24-26 (2000) p.287.
[6] P. D. Hodgson, S. H. Zahiri, J .J .Whale, ISIJ International, 44 (2004) p. 1224.
[7] Ivani De S. Bott, Luis F. G. De Souza, Jose C.G. Teixeira, Paulo R.Rios, Metallurgical and Materials Transactions A 36A (2005) p. 443 [8] Manuel Gomez, Pilar Vells, Seastian F. Medina, Materials Science and Engineering A 528 (2011) p. 4761.
[9] Chengwu Zheng, Namin Xiao, Dianzhong Li, Yi Li, Computational Materials Science 44 (2008) p. 507. [10] C. Roucoules, P.D. Hodgson, S. Yue, J.J. Jonas, Metall. Trans. A 25 (1994) p. 389.
[11] S. Hertele, “Coupled Experimental-Numerical Framework for the Assessment of Strain Capacity of Flawed Girth Welds in Pipelines,” PhD Thesis, Ghent University, 2012.
[12] N. S. Mourino, “Crystallographically controlled mechanical anisotropy of pipeline steel,” PhD Thesis, Ghent University, 2010.
BIOGRAPHY
Pramod Kumar is a M.Tech scholar at NIFFT, Ranchi in Materials Science & Engineering Department. He has completed his B.Tech from Seacom Engineering College, Howrah in Mechanical engineering in 2012.
Dr. V. C. Srivastava is a Scientist in Metal Extraction and Forming division at CSIR-National Metallurgical Laboratory Jamshedpur.
Dr. Binod Kumar is a Professor in Materials and Metallurgy Department at NIFFT, Ranchi.