Article
Human motion recognition by textile sensor based on
machine learning algorithms
Chi Cuong Vu1and Jooyong Kim1*
1 Department of Organic Materials and Fiber Engineering, Soongsil University, Seoul 156-743, Republic of Korea; [email protected]
* Correspondence: [email protected]; Tel.: +82-010-8720-0631
Abstract: Wearable sensors for human physiological monitoring have attracted tremendous
interest from researchers in recent years. However, most of the research was only done in simple trials without any significant analytical algorithms. This study provides a way of recognizing human motion by combining textile stretch sensors based on single-walled carbon nanotubes (SWCNTs) and spandex fabric (PET/SP) and machine learning algorithms in a realistic applications. In the study, the performance of the system will be evaluated by identification rate and accuracy of the motion standardized. This research aims to provide a realistic motion sensing wearable products without unnecessary heavy and uncomfortable electronic devices.
Keywords: wearables; human motion monitoring; SWCNT; textiles; machine learning algorithm
1. Introduction
Wearable technology, especially wearable sensor, has become mainstream in these days, and received great interest from researchers. By focusing on revealing the multi-dimensional aspects of human life, the wearable tech can be prevailly applied in medical, healthcare, power source, flexible electronic components, etc. In the healthcare field, patients can be quickly diagnosed and treated for a variety diseases with the help of the devices [1]. In the sport, athletes' performance is monitored in order to detect abnormalities, construct plans for training, and tactics or protect them from injuries [2]. Through special structure, wearable electronics can be applied to the flexible battery [3,4], capacitive energy storage [5], data storage [1-6], or the fashion [7].
Most of the operating mechanism of the sensors are based on the relationship between physical quantity or chemicals such as temperature, pressure, stretch, light, sound, vibration, distance, humidity, pH, and electrical properties such as resistance, electromagnetic, capacitance of constituent conductive materials. According to the principle, the popular approach of designing wearable sensors is to integrate electronic devices including temperature, stretch gage, proximity, accelerometer, and pulse-oximeter into a small hard packet added on clothes, jewelry [2,8-11] or directly on the skin [12-14]. For example, Donghee Son et al. [1] developed bio-integrated systems for diagnosis and therapy of movement disorders. Takao Someya et al. [14] discussed the latest progress in the use of soft electronic materials and their related devices in biological interfaces. Hyunjae Lee et al. [15] researched a development of skin-mounted graphene-hybrid (GP-hybrid) device arrays capable of based glucose and pH monitoring in conjunction with a sweat-control layer. Wei Gao et al. [16] presented a mechanically flexible and fully integrated sensor array for multiplexed in situ perspiration analysis, which simultaneously and selectively measures sweat metabolites and electrolytes. Bruce H. Dobkin et al. [17] used gyroscopes, accelerometers, and other physiologic sensors to monitor distance, gait asymmetry, and smoothness of human movements. Xuewen Wang et al. [18] developed flexible pressure sensor based on polydimethylsiloxane (PDMS) films for monitoring physiological signals. Many other studies on the stretch sensor [19-21], e-skin [12-13], the temperature sensor [21-22], the pressure sensor [2,13,23] almost used graphene [23-24], carbon nanotubes (CNTs) [11-12,25]assensing materials. The resulting sensors effectively proved to be highly sensitive materials good for wearable devices. On the other hand, nanowires (NWs), such as gold NWs [1], Ge/Si-ZnO NWs [18], silver NWs [26-27] or compound mixtures [28] also showed
Preprints (www.preprints.org) | NOT PEER-REVIEWED | Posted: 13 July 2018 doi:10.20944/preprints201807.0230.v1
© 2018 by the author(s). Distributed under a Creative Commons CC BY license.
positive results. However, all above studies have at least one of the following disadvantages: hard electronic components making inconvenient while feeling or moving, the complex fabrication method or high-cost, missing the combination with signal processing algorithms to apply in an actual product.
The aim of this research is to develop a complete combination of the wearable sensor fabrication based on single-walled carbon nanotubes (SWCNT) [11,18,28-29], spandex fabric (PET/Spandex - PET/SP), and use machine learning algorithms [30] for analysis of sensing signals in order to apply to the real products in human motion monitoring application [31-35]. The conductive polyethylene terephthalate (PET/Spandex) fabrics were prepared by padding conductive ink (SWCNT) in order to construct textile fabric sensors. The performance of the fabricated textile sensors has been characterized in terms of the mechanical and electrical performance along with stretch ratio or stretch percent. Human motion data signals through the e-textile stretch sensor are processed by a specially designed circuit, digitizes and arranged into the custom format to be analyzed further. Then, the data would be transmitted via bluetooth to the mobile phone [36-39], tablet and desktop computer in real time for display or analysis based on machine learning algorithms in order to get the best classification of the 4 standdardized human motions predefined such as walking, running, sprinting, and jumping).
Machine learning (ML) algorithms have been applied frequently to a variety fields of the medical diagnosis, natural language processing, online search, smart cars, marketing personalization, etc. In particular, within the field of data analytics, machine learning algorithms are one of the promising methods used to devise complex models that lend themselves to prediction and classification with high accuracy. The paper has proposed some useful ML algorithms for classification such as random forest (RD) [40], support vector machine (SVM) [41], neural network (NN) [42-44] and deep neural network (DNN) [45]. The performance of the algorithms developed has been evaluated in terms of mechanical properties of the sensors and the accuracy of the applied algorithms under actual and realistic wearing test conditions. It have been proved that the textile sensors are extremely thin, lightweight, sensitive, and thus highly flexible with no offense, no irritation or allergies to the skin. In addition, it has been revealed that this method is highly preferable for mass production mainly due to simple process as well as highly accurate with high comfort.
2. Materials and Methods
2.1. Materials
This research used the PET/SP fabric with polyethylene terephthalate/spandex ratio = 76/24, item 16043A, 341 g/YD, 262 g/SQM, from SNT Co. Ltd, South Korea. The raw powder single-walled carbon nanotubes (SWCNTs) were obtained from KH Chemical Co. Ltd, South Korea. These SWCNTs were treated by acid solution in laboratory grade. The stirring machine, ultrasonication machine, auto dipping padding machine and two-way drying machine were prepared from Daelim Starlet Co. Ltd, South Korea. All other electronic components such as bluetooth module, microprocessor, lithium battery, etc. were used as purchased.
2.2. Methods
2.2.1. Textile sensor fabrication
The PET/SP fabrics known for exceptional elasticity were prepared by co-weaving of spandex with polyester. The spandex keeps smaller quantity in the final fabric so that therefore may retains most of the look and feel of PET fibers. The PET/SP fabric is very resilient and can withstand a good deal of wear and tear, waterproof and less wrinkling. These attributes make this spandex fabric widely applied in the industry to produce products such as clothing, household furniture, industrial fabrics. The structure of the PET/SP fabric is composed of conventional PET/SP
Preprints (www.preprints.org) | NOT PEER-REVIEWED | Posted: 13 July 2018 doi:10.20944/preprints201807.0230.v1
multifilament yarns with high elasticity and recovery. These fibers could be converted into conductive fibers via coating, padding, and surface treatment.
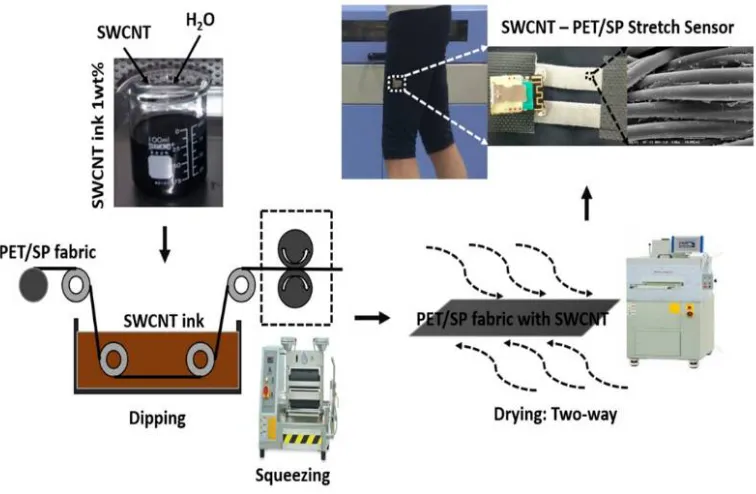
Figure 1. Summary of fabrication process and application of SWCNT stretch sensors
In order to fabricate the fabric sensor (Figure 1), carbon powder ink was applied by water-based single-walled carbon nanotube (SWNT) solution with nanotubes with 1.0 ~ 1.3 nm diameter and 0.1 wt% concentration. The SWCNT powder was treated by acid solution (HNO3:H2SO4 = 3:1),
dispersed in H2O, SDBS (Sodium dodecyl-benzenesulfonate), and ultra-sonificated (2 hr, 19.990 Hz)
in the stirring machine (60 ~ 80 ℃, 1000 rpm, 24 hr). The PET/SP fabrics were prepared and immersed in SWCNT ink within the bath of the automatic dipping padding machine. The impregnating process would keep the conditions that allow the SWCNT particles to penetrate well (pressure roll speed: 1.0 m/min, air cylinder pressure: 3 bar (0.3 MPa) over). This process would make the SWCNT particles adhered to the fabric surface after dipping and squeezing. After that, the two-way drying machine was used in order to get rid of the excess water in the fabrics. The vacuum dried conditions were optimized at the time of drying: 1 – 3 mins, the range of temperature: 180 ~ 200 ℃, and the speed of circulation fan: 1500 rpm. Finally, it was maintained for 3 ~ 5 hours under normal room temperature condition. The fabric sensors were cut to form smaller specimens for further experimentals.
2.2.2. Human motion analysis
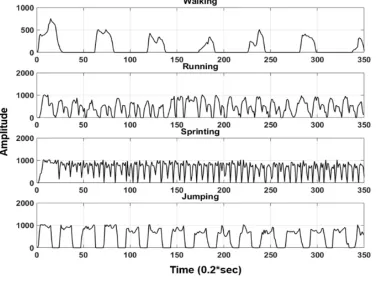
Actual muscle pants equipped with the fabricated textile sensor have been prepared for wearing test including motion analysis. During the test, the partipicants were asked to wear the smart muscle pants while moving. 4 types of motions predefined are shown in Figure 2. A processing circuit digitized and sent motion data signals, and transmitted them via Bluetooth to a mobile phone in real time. Motion data signals would be analyzed in order to generate 3 input parameters such as the average of amplitude (AMP), the standard deviation of amplitude (STD), and the average cycle (CYC) for further processing.
Preprints (www.preprints.org) | NOT PEER-REVIEWED | Posted: 13 July 2018 doi:10.20944/preprints201807.0230.v1
Figure 2. Types of human motion signals
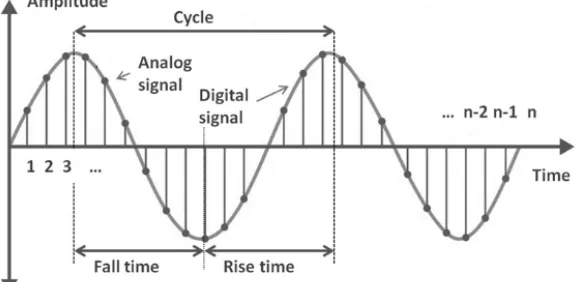
Average of amplitude: The average of amplitude (AMP) is commonly used terms to indicate the magnitude of a periodic signal and determined by the ratio between the sum of the magnitude of all instantaneous values and the number of considered instantaneous values. Considering a signal as shown in Figure 3, A1, A2, A3, etc. were magnitudes of the signal at
instants of 1, 2, 3, etc., respectively. The AMP could be calculated as follows:
AMP = ⋯ (1)
Standard deviation of amplitude: Standard deviation (STD) is a measure of the dispersion of data from its mean. It is calculated as the square root of variance by determining the variation between each data point relative to the mean. A low STD indicates that the data points tend to be close to the mean of the set data, while a high STD indicates that the data points are spread out over a wider range of values. Besides the average of amplitude, the STD evaluates the other aspect of the signal.
STD = ∑| ̅| (2)
Where A represents an individual value, ̅ represents the mean value, and n represents the total number of values.
Average cycle: This is the most important parameter for motion classification which proposed in this research. In the general fields of science and life, the cycle is defined by the shortest period in which action is repeated. Average cycle (CYC) includes process time, during which a unit was acted upon to bring it closer to an output, and delay time, during which a unit of work was spent waiting to take the next motion. The CYC could be calculated as shown in Figure 3.
Preprints (www.preprints.org) | NOT PEER-REVIEWED | Posted: 13 July 2018 doi:10.20944/preprints201807.0230.v1
Figure 3. The parameters of the signal
2.2.3. Machine learning algorithms
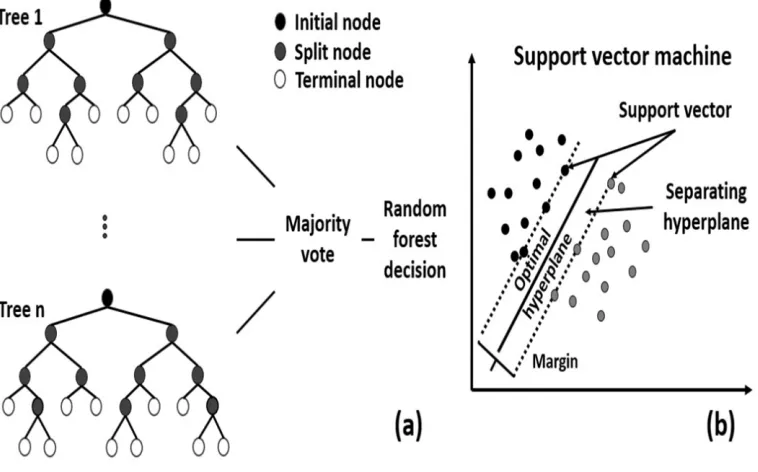
1. Random forest: Random forests or random decision forests (RD) are supervised classification algorithm for classification, regression, and other tasks. As shown in Figure 4, the random forest constructs a multitude of decision trees at training time. In the classified application, each tree represents a classification, which could be called by the tree "votes" for that class. The forest would choose the classification having the most votes (over all the trees in the forest). The operation of random forest algorithm can split into two stages. The first one is random forest creation. And the other is to make a prediction from the random forest classifier created in the first stage. In the first stage, randomly select m from total M input variables where m << M. The best split on this m is used to split the node. This process would repeat the number of times "n" to create the number "n" of the tree. The value of m is held constant during forest creating. Finally, these randomly created trees form the random forest. In the second stage, the test features are taken through the rules of each randomly created decision trees. It used to predict the result and stores the predicted result. Each random forest would predict the different result for the same test feature. And then, the final prediction of the random forest algorithm would calculate by considering the high voted predicted of each outcome.
2. Support vector machine: Support vector machine (SVM) (Figure 4) is based on statistical learning theory by Cortes and Vapnik. This is a supervised machine learning algorithm which could be used for both classification or regression challenges. Basically, the SVM looks for the optimal separating hyperplane between the two classes by maximizing the margin between the classes’ closest points. The points lying on the boundaries are called support vectors, and the middle of the margin is optimal separating hyperplane. When facing a multi-classification task, SVM proposes mainly two schemes. Firstly, the original SVM model is modified in order to solve the multi-classification problem directly. The parameter optimization is very complicated and the calculation is very large. Secondly, an n-class problem is converted into n two-class problems in order to solve easier. This method is usually used in practical applications. The maximum margin of separation between data trained in a space (kernel space) would be obtained by a transformation function.
Preprints (www.preprints.org) | NOT PEER-REVIEWED | Posted: 13 July 2018 doi:10.20944/preprints201807.0230.v1
Figure 4. Structure of random forest algorithm (a) and support vector machine algorithm (b)
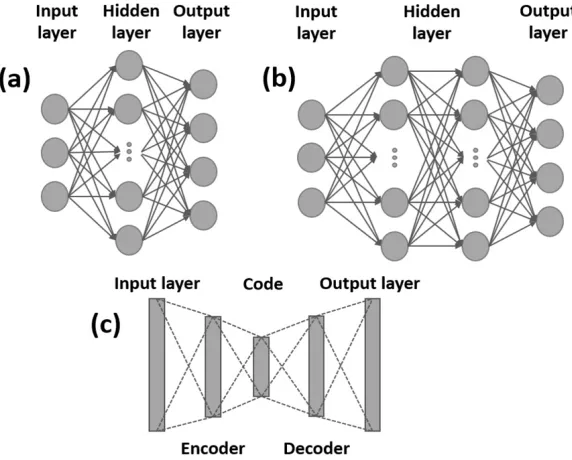
3. Artificial neural network: Artificial neural networks (ANNs) or connectionist systems are computing systems inspired by the biological neural networks that constitute the human brain. The neural network is composed of multiple nodes connected with coefficients (weights) which constitute the neural structure in order to perform certain specific tasks like as clustering, classification, pattern recognition, estimator, prediction, etc. In Figure 5, an ANN is constituted by an interconnected group of nodes. Each node represents an artificial neuron. Each arrow represents a connection from the output of one neuron in the previous layer to the input of one neuron in the next layer. The output at each node is called its activation or node value. Such the system uses the examples in order to automatically infer rules for progressively improving the performance of the application on a degree of acceptable error, without task-specific programming.
4. Multi-hidden layers neural network: Deep neural networks (DNNs) are neural networks with the certain level of complexity. DNNs distinguished from the more commonplace single hidden layer neural networks by their depth. In the technical term, deep is a strictly defined. That mean, the ANNs have more than three hidden layers (including input and output layer) qualifies as “deep” learning. Each layer of nodes performs a distinct set of features based on the previous layer’s output like as a “feature hierarchy”. DNNs currently provide better solutions than ANNs to many applications in the recognition field. But this structure also increases the complexity of the algorithm. Figure 5 shows a multi-hidden layers neural network (M-ANN) with 2 hidden layers and 10 nodes for each layer.
5. Autoencoders: As shown in Figure 5, autoencoder (AE) is the artificial neural network used for unsupervised learning based on the efficient coding. The main aim of autoencoder is to create a representation (encoding) for a set of data for dimensionality reduction. An AE is composed of two half networks that typically have some shallow layers representing the encoding half of the net and some other shallow layers that make up the decoding half. AE attempts to replicate its input at its output. So, the size of its input will be same as the size of its output. When the number of neurons in the hidden layer is less than the size of the input, the AE will learn a compressed representation for the input. This paper would construct a deep network using autoencoders.
Preprints (www.preprints.org) | NOT PEER-REVIEWED | Posted: 13 July 2018 doi:10.20944/preprints201807.0230.v1
Figure 5. Structure of one hidden layer neural network algorithm (a), multi-hidden layers neural network algorithm (b) and autoencoders algorithm (c)
3. Results and Discussion
3.1. Structure of the stretch textile sensor
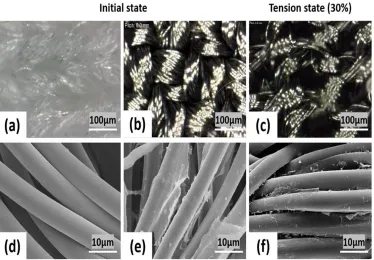
Scanning electron microscopy (SEM) was employed to characterize morphological changes of the PET/SP fabric stretch sensor at different steps of the synthesis of the conductive fabric through the present approach. Figure 6 shows SEM image of the standard PET/SP fabric with the magnified view showing no coating on the fiber and the coated PET/SP fabric with SWCNT. In that figure, this paper showed the surface morphology of PET/SP fabric at high and low magnification, at initial state and tension state (30 %), respectively. The diameter of the filaments is about 10µm and loosely twisted and ample of free space between the microfiber bundles. The particles could be observed in the form of the thin coatings, and stuck randomly onto PET/SP fibers with 80 % coated rate.
Preprints (www.preprints.org) | NOT PEER-REVIEWED | Posted: 13 July 2018 doi:10.20944/preprints201807.0230.v1
Figure 6. Surfaces of the fabricated sensors : (a) untreated (b) treated (c) treated and stretched (under lower magnification) (d) untreated (e)treated, and (f) treated and stretched (higher magnification)
The method for recognizing specific motion is strongly based on the relationship between mechanical and electrical properties of the sensor fabrics. The resistance would change according to stretching or releasing by responsive mechanism of crack propagation. The cracks originate and propagate in the thin conductive layers coated on the PET/SP fibers during continuous mechanical stretching. They are released under the accommodated stress at the stress concentrated areas and recover to their initial states after releasing the stretch force imposed on the fabrics. Edges of the cracks would reconnect at this point, ensuring complete recovery of the electrical resistance. The performance of the stretch sensor will be extremely sensitive and flexible based on this mechanism.
3.2. Stretchability (yield point) and sensitivity (gauge factor)
The stretch-ability of a stretch sensor depends on the materials, micro/nanostructures, and the fabrication process used in the syoudy. Figure 7 shows the average resistance- stretch relationship of 3 sensor samples. The structure of the PET/SP fabric is one of the main reasons of the high stretchability (yield point, εy ≈ 50 %) resistive type sensor reported in this research. If the stretch is
applied beyond a certain amount (ε > 50 %), the PET/SP fabric would be yielded so that the fabrics will lose their sensing capability. The stretch-ability ensures the wide range of stretch sensing enough for realistic applications.
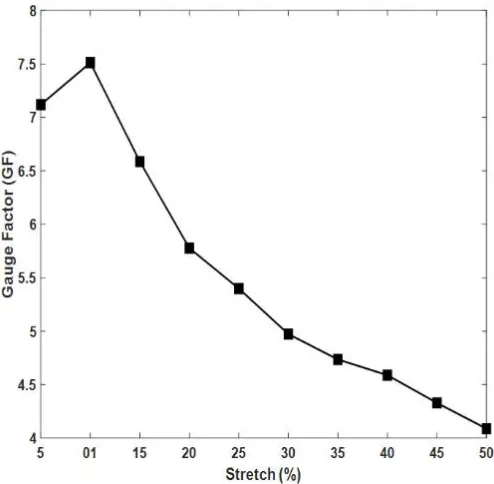
As shown in Figure 8, the average sensitivity or gauge factor (GF) of 3 stretch sensors is defined as the ratio of a relative change in resistance (ΔR/R) and stretch (ε), and could be wrote as GF = (ΔR/R)/ε and ε = ΔL/L. It is clear that the resistance increases along with the stretch increases, and vice versa. For the fabricated stretch sensor, the value of GF depends mainly on the nanostructures of SWCNT. The results show that the GF ranges from 4.1 to 7.5, and depends on the stretch ratio (%). As calculated GF values, the stretch sensor is sensitive and fits into applications in this research.
Preprints (www.preprints.org) | NOT PEER-REVIEWED | Posted: 13 July 2018 doi:10.20944/preprints201807.0230.v1
Figure 7. Stretch-ability of the SWCNT fabric sensors
Figure 8. Sensitivity (gauge factor) of the SWCNT fabric sensors
3.3. Current – Voltage (I-V) curves
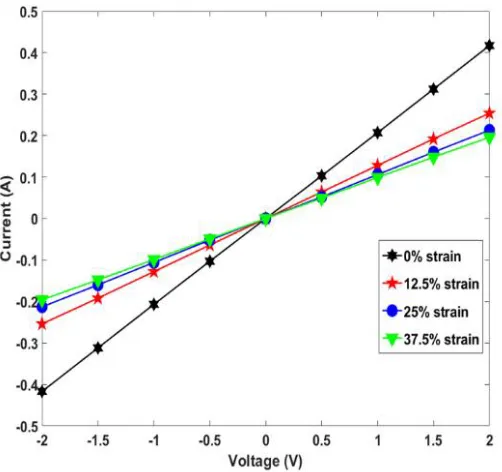
The I-V curve is one of the important parameters for characterizing the stretch sensors. Figure 9 shows a set of graphical curves which are used to define the operation of the sensor under different static stretchs from 0 – 37.5 % within the system. The applied voltage from -2 V to 2 V indicated the resistance of stretch sensor was constant with an Ohmic behavior. The slope of the I-V curves reduces with an increase of applied stretch, from 0 % - 12.5 % - 25 % and 37.5 %, indicating that an increase in applied stretch leaded to an increase in the sensor’s resistance.
Preprints (www.preprints.org) | NOT PEER-REVIEWED | Posted: 13 July 2018 doi:10.20944/preprints201807.0230.v1
Figure 9. Current-voltage curves according to stretch rate (%)
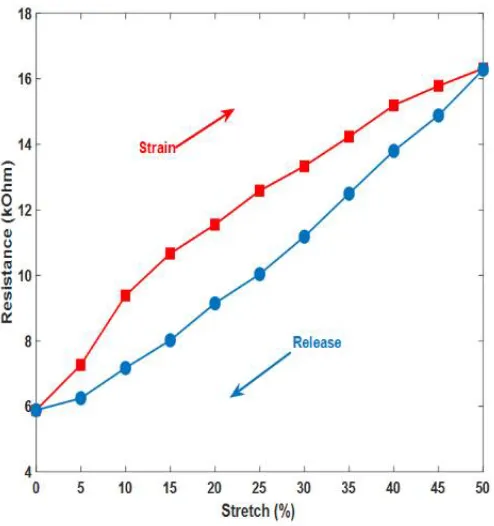
3.4. Hysteresis
Hysteresis is defined as a behavior whose output does not only depend on the current input but also on the history of the input. The hysteresis becomes important when the stretch sensor is used in the dynamic applications such as human motion monitoring, ECG monitoring, healthcare, etc. Hysteresis behaviors are mainly caused by the elastic properties of PET/SP fabric, the interaction between SWCNT and PET/SP fibers, as well as reconnected ability of the thin coatings after upon release of the applied stretch. Strong interfacial binding between nanostructure of SWCNT and PET/SP fibers gave the good stretch sensing performances. The average hysteresis behaviors of 3 samples is shown in Figure 10, indicating a linear rise in resistance when applying stretch and only a small hysteresis.
Preprints (www.preprints.org) | NOT PEER-REVIEWED | Posted: 13 July 2018 doi:10.20944/preprints201807.0230.v1
Figure 10. Hysteresis of the SWCNT fabric sensors
3.5. Response and recovery time
Response time is the time taken to initially react to a given input. The response delay exists in the sensor is mainly caused by the viscoelastic nature of PET/SP fabric. The results of experimental showed the response time of 200ms at = 30 %. Recovery time is another important parameter of the stretch sensor in order to evaluate performance in the dynamic application. The recovery time of this fabricated stretch sensor is 220ms at = 30 %. The recovery time is affected by the friction force and the reconnected ability between the SWCNT coatings with PET/SP fibers. The fast self-recovery process of SWCNT ensures rapid recovery of the electrical property of the stretch sensor and avoids the degradation of the device performance during the large deformation.
Preprints (www.preprints.org) | NOT PEER-REVIEWED | Posted: 13 July 2018 doi:10.20944/preprints201807.0230.v1
Figure 11. Response and recovery time of the SWCNT fabric sensors
3.6. Durability
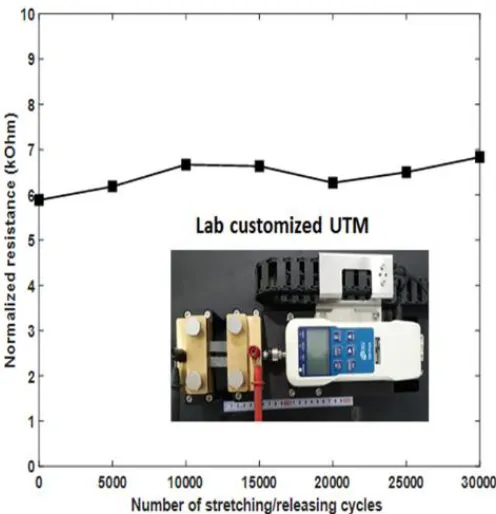
The dyanamic durability is the stable electrical functionality and mechanical integrity of the stretch sensor in the stretching/releasing cycles. This parameter depends on the fatigue and plastic deformation of the PET/SP fibers under high stress which causes damage to the fibers (PET) and the sensing nanomaterials (SWCNT). The durability performed under Lab customized UTM clearly revealed that the dyanamic durability was enough for realistic applications. Resulting fabric surface was kept intact after 30,000 stretching/releasing cycles, that means repeated stretch under 30 % my not affect the sensor performance within 30,000 cycles. Figure 12 showed the average resistance of 3 sensors in the tension test. The resistance was measured every 5,000 cycles, and all results of each sample were uniform. All samples showed resistance changes of less than 10 % after 30,000 cycles of 30 % tension.
Figure 12. The results of 30,000 cycles of dynamic tension test (30 %)
3.7. Human motion classification
The application capability of the fabricated stretch sensor would be evaluated by the testing on four human motions such as walking, jumping, running, and sprinting. The result of the experimental was shown in the comparison between the output of the system and the actual motion. Statistical indices, which percent accuracy and confusion matrix are two important elements to evaluate the computational efficiency of this research. The accuracy is determined by Equation 3 where N here represents the total number of motions and P represents the correct classified values. In Figure 13, five algorithms obtained a mean performance accuracy of 90 % with the random forest, 84 % with the support vector machine, 85 % with one hidden layer neural network, 88 % with multi-hidden layers neural network, and 87 % with autoencoder. The accuracy of the random forest algorithms (90 %) shows that there is a good agreement between the measured and classified values.
A = x 100 % (3)
Preprints (www.preprints.org) | NOT PEER-REVIEWED | Posted: 13 July 2018 doi:10.20944/preprints201807.0230.v1
Figure 13. Comparison of the correct classification motions of the models (RD, SVM, ANN, M-ANN, AE) with actual motions
Confusion matrix or error matrix is a specifically parameter in the field of statistical classification of machine learning. This is a specific table layout that allows visualization of the performance of algorithms. Each row of the matrix represents the instances in a classified value while each column represents the instances in an actual value. The confusion matrix of algorithms is shown in Figure 14, 15, 16, 17, 18. Where number 1 represents the walking, number 2 represents the jumping, number 3 represents the running and number 4 represents the sprinting. The diagonal elements represent the number of cases for which the classified motion is equal to the actual motion, while off-diagonal elements are those that are mislabeled. The higher the diagonal values of the confusion matrix the better, it indicates many correct classifications. Accordingly, it is clear that the walking and sprinting motions are easy to classify with all algorithms such as RD(100 % - 88.9 %), SVM(100 % - 100 %), ANN(100 % - 95.5 %), M-ANN(100 % - 92.3 %), and AE(100 % - 95.8 %), respectively. However, the jumping and running motions are easy to confusing such as RD(88 % - 82.6 %), SVM(77.3 % - 64.5 %), ANN(82.6 % - 66.7 %), M-ANN(83.3 % - 76 %), and AE(80 % - 73.1 %). Especially, the precision of the running motion in the support vector machine and the one hidden neural network algorithms are lowest.
Preprints (www.preprints.org) | NOT PEER-REVIEWED | Posted: 13 July 2018 doi:10.20944/preprints201807.0230.v1
Figure 14. The accuracy of random forest algorithm
Figure 15. The accuracy of support vector machine algorithm
Preprints (www.preprints.org) | NOT PEER-REVIEWED | Posted: 13 July 2018 doi:10.20944/preprints201807.0230.v1
Figure 16. The accuracy of one-hidden layer neural network algorithm
Figure 17. The accuracy of multi-hidden layers neural network algorithm
Preprints (www.preprints.org) | NOT PEER-REVIEWED | Posted: 13 July 2018 doi:10.20944/preprints201807.0230.v1
Figure 18.The accuracy of autoencoders algorithm
The research has demonstrated that the random forest, multi-hidden layers neural network and the autoencoders algorithms were superior to the support vector machine and the one hidden layers neural network in terms of accuracy of classification in this realistic application. The results obtained from the random forest and the multi-hidden layers neural network algorithms were similar in terms of classification rate, and the random forest was marginally better than the multi-hidden layers neural network.
4. Conclusions
This research developed a complete combination of the wearable application based on SWCNT - PET/SP and machine learning algorithms to analysis sensing signals on a real product. The paper showed two highlights: The fabrication process of the stretch sensor is simple, stretchable and flexible. And the performance of the monitoring model was enhanced by machine learning algorithms. Through the statistical indices, the high accuracy demonstrated that this system could be applied as an intelligent device for recognizing human motions in real time. This research also showed an ability to bring the product from experimental to daily life with a high economic efficiency.
Acknowledgments: The research was supported by Soongsil University.
Author Contributions: J.K. and C.C.V. conceived and designed the experiments; J.K. and C.C.V. designed the prototype, performed the experiments and analyzed the data; C.C.V. wrote the paper.
Conflicts of Interest: The authors declare no conflict of interest.
References
1. Son, D.; Lee, J.; Qiao, S.; Ghaffari, R.; Kim, J.; Lee, J.E.; Song, C.; Kim, S.J.; Lee, D.J.; Jun, S.W.; Yang, S.; Park, M.; Shin, J.; Do, K.; Lee, M.; Kang, K.; Hwang, C.S.; Lu, N.; Hyeon, T.; Kim, D.-H. Multifunctional wearable devices for diagnosis and therapy of movement disorders. Nat. Nanotechnol. 2014, 9, 397–404. 2. Majumder, S.; Mondal, T.; Deen, M.J. Wearable Sensors for Remote Health Monitoring. Sensors 2017, 17,
130.
3. Zamarayeva, M.A.; Ostfeld, A.E.; Wang, M.; Duey, J.K.; Deckman, I.; Lechêne, B.P.; Davies, G.; Steingart, D.A.; Arias, A.C. Flexible and stretchable power sources for wearable electronics. Sci. Adv. 2017, 3, 1602051.
Preprints (www.preprints.org) | NOT PEER-REVIEWED | Posted: 13 July 2018 doi:10.20944/preprints201807.0230.v1
4. Wen, Z.; Yeh, M.-H.; Guo, H.; Wang, J.; Zi, Y.; Xu, W.; Deng, J.; Zhu, L.; Wang, X.; Hu, C.; Zhu, L.; Sun, X.; Wang, Z.L. Self-powered textile for wearable electronics by hybridizing fiber-shaped nanogenerators, solar cells, and supercapacitors. Sci. Adv. 2016, 2, 1600097.
5. Yu, D.; Goh, K.; Wang, H.; Wei, L.; Jiang, W.; Zhang, Q.; Dai, L.; Chen, Y. Scalable synthesis of hierarchically structured carbon nanotube–graphene fibres for capacitive energy storage. Nat. Nanotechnol. 2014, 9, 555–562.
6. Geier, M.L.; McMorrow, J.J.; Xu, W.; Zhu, J.; Kim, C.H.; Marks, T.J.; Hersam, M.C. Solution-processed carbon nanotube thin-film complementary static random access memory. Nat. Nanotechnol. 2015, 10, 944-948.
7. Choi, S.; Kwon, S.; Kim, H.; Kim, W.; Kwon, J.H.; Lim, M.S.; Lee, H.S.; Choi, K.C. Highly Flexible and Efficient Fabric-Based Organic Light-Emitting Devices for Clothing-Shaped Wearable Displays. Sci. Rep. 2017, 7, 6424.
8. Servati, A.; Zou, L.; Wang, J.Z.; Ko, F.; Servati, P. Novel Flexible Wearable Sensor Materials and Signal Processing for Vital Sign and Human Activity Monitoring. Sensors 2017, 17, 1622.
9. Wang, C.; Li, X.; Gao, E.; Jian, M.; Xia, K.; Wang, Q.; Xu, Z.; Ren, T.; Zhang, Y. Carbonized Silk Fabric for Ultrastretchable, Highly Sensitive, and Wearable Strain Sensors. Adv. Mater. 2016, 28, 6640–6648.
10. Wang, Y.; Wang, L.; Yang, T.; Li, X.; Zang, X.; Zhu, M.; Wang, K.; Wu, D.; Zhu, H. Wearable and Highly Sensitive Graphene Strain Sensors for Human Motion Monitoring. Adv. Funct. Mater. 2014, 24, 4666–4670. 11. Stoppa, M.; Chiolerio, A. Wearable Electronics and Smart Textiles: A Critical Review. Sensors 2014, 14,
11957–11992.
12. Hammock, L.M.; Chortos, A.; Tee, C.K.B.; Tok, B.H.J.; Bao, Z. 25th Anniversary Article: The Evolution of Electronic Skin (E-Skin): A Brief History, Design Considerations, and Recent Progress. Adv. Mater. 2013, 25, 5997–6038.
13. Ho, D.H.; Sun, Q.; Kim, S.Y.; Han, J.T.; Kim, D.H.; Cho, J.H. Stretchable and Multimodal All Graphene Electronic Skin. Adv. Mater. 2016, 28, 2601–2608.
14. Someya, T.; Bao, Z.; Malliaras, G.G. The rise of plastic bioelectronics. Nature 2016, 540, 379–385.
15. Lee, H.; Choi, T.K.; Lee, Y.B.; Cho, H.R.; Ghaffari, R.; Wang, L.; Choi, H.J.; Chung, T.D.; Lu, N.; Hyeon, T.; Choi, S.H.; Kim, D.-H. A graphene-based electrochemical device with thermoresponsive microneedles for diabetes monitoring and therapy. Nat. Nanotechnol. 2016, 11, 566–572.
16. Gao, W.; Emaminejad, S.; Nyein, H.Y.Y.; Challa, S.; Chen, K.; Peck, A.; Fahad, H.M.; Ota, H.; Shiraki, H.; Kiriya, D.; Lien, D.-H.; Brooks, G.A.; Davis, R.W.; Javey, A. Fully integrated wearable sensor arrays for multiplexed in situ perspiration analysis. Nature 2016, 529, 509–514.
17. Dobkin, H.B. Wearable motion sensors to continuously measure real-world physical activities. Curr. Opin. Neurol. 2013, 26, 602–608.
18. Wang, X.; Gu, Y.; Xiong, Z.; Cui, Z.; Zhang, T. Silk-Molded Flexible, Ultrasensitive, and Highly Stable Electronic Skin for Monitoring Human Physiological Signals. Adv. Mater. 2014, 26, 1336-1342.
19. Sarwar, M.S.; Dobashi, Y.; Preston, C.; Wyss, J.K.M.; Mirabbasi, S.; Madden, J.D.W. Bend, stretch, and touch: Locating a finger on an actively deformed transparent sensor array. Sci. Adv. 2017, 3, 1602200. 20. Pang, C.; Lee, G.-Y.; Kim, T.; Kim, S.M.; Kim, H.N.; Ahn, S.-H.; Suh, K.-Y. A flexible and highly sensitive
strain-gauge sensor using reversible interlocking of nanofibers. Nat. Mater. 2012, 11, 795-801.
21. Amjadi, M.; Kyung, K.; Park, I.; Sitti, M. Stretchable, Skin-Mountable, and Wearable Strain Sensors and Their Potential Applications: A Review. Adv. Funct. Mater. 2016, 26, 1678-1698.
22. Hsu, P.-C.; Liu, C.; Song, A.Y.; Zhang, Z.; Peng, Y.; Xie, J.; Liu, K.; Wu, C.-L; Catrysse, P.B.; Cai, L.; Zhai, S.; Majumdar, A.; Fan, S.; Cui, Y. A dual-mode textile for human body radiative heating and cooling. Sci. Adv. 2017, 3, 1700895.
23. Mao, C.; Zhang, H.; Lu, Z. Flexible and wearable electronic silk fabrics for human physiological monitoring. Smart Mater. Struct. 2017, 26, 095033.
24. Ren, J.; Wang, C.; Zhang, X.; Carey, T.; Chen, K.; Yin, Y.; Torrisi, F. Environmentally-friendly conductive cotton fabric as flexible strain sensor based on hot press reduced graphene oxide. Carbon 2017, 111, 622-630.
25. Wang, L.; Loh, J.K. Wearable carbon nanotube-based fabric sensors for monitoring human physiological performance. Smart Mater. Struct. 2017, 26, 055018.
26. Kim, K.K.; Hong, S.; Cho, H.M.; Lee, J.; Suh, Y.D.; Ham, J.; Ko, S.H. Highly Sensitive and Stretchable Multidimensional Strain Sensor with Prestrained Anisotropic Metal Nanowire Percolation Networks. Nano Lett. 2015, 15, 5240-5247.
Preprints (www.preprints.org) | NOT PEER-REVIEWED | Posted: 13 July 2018 doi:10.20944/preprints201807.0230.v1
27. Amjadi, M.; Pichitpajongkit, A.; Lee, S.; Ryu, S.; Park, I. Highly Stretchable and Sensitive Strain Sensor Based on Silver Nanowire–Elastomer Nanocomposite. ACS Nano 2014, 8, 5154-5163.
28. Guo, X.; Huang, Y.; Zhao, Y.; Mao, L.; Gao, L.; Pan, W.; Zhang, Y.; Liu, P. Highly stretchable strain sensor based on SWCNTs/CB synergistic conductive network for wearable human-activity monitoring and recognition. Smart Mater. Struct. 2017, 26, 095017.
29. Roman, C.; Helbling, T.; Hierold, C. Single-Walled Carbon Nanotube Sensor Concepts. In Springer Handbook of Nanotechnology, 3rd ed.; Bhushan, B. Eds.; Springer: Berlin, Germany, 2010; pp. 403-425, ISBN 978-3-642-02525-9.
30. Bengio, Y.; Courville, A.; Vincent, P. Representation Learning: A Review and New Perspectives. IEEE Trans. Pattern. Anal. Mach. Intell. 2013, 35, 1798-1828.
31. Lara, D.O.; Labrador, A.M. A Survey on Human Activity Recognition using Wearable Sensors. IEEE Commun. Surv. Tutor. 2012, 15, 1192-1209.
32. Lopez, N.H.I.; Munoz, M.A. Wearable Inertial Sensors for Human Motion Analysis: A Review. IEEE Sens. J. 2016, 16, 7821-7834.
33. Guo, F.M.; Cui, X.; Wang, K.L.; Wei, J.Q. Stretchable and compressible strain sensors based on carbon nanotube meshes. Nanoscale 2016, 8, 19352-19358.
34. Jiao, Y.; Young, C.W.; Yang, S.; Oren, S.; Ceylan, H.; Kim, S.; Gopalakrishnan, K.; Taylor, P.C.; Dong, L.; Wearable Graphene Sensors With Microfluidic Liquid Metal Wiring for Structural Health Monitoring and Human Body Motion Sensing. IEEE Sens. J. 2016, 16, 7870-7875.
35. Chetty, G.; White, M. Body sensor networks for human activity recognition. In Proceedings of the 3rd International Conference on Signal Processing and Integrated Networks (SPIN), Noida, India, 11-12 February 2016; pp. 660-665.
36. He, Z.; Bai, X. A wearable wireless body area network for human activity recognition. In Proceedings of the 2014 Sixth International Conference on Ubiquitous and Future Networks (ICUFN), Shanghai, China, 8-11 July 2014; pp. 115-119.
37. Sairam, K.V.S.S.S.S.; Gunasekaran, N.; Redd, S.R. Bluetooth in wireless communication. IEEE. Commun. Mag. 2002, 40, 90-96.
38. Schilingovski, P.; Vulfin, V.; Sayfan, A.S.; Shavit, R. Wearable antennas design for wireless communication. In Proceedings of the 2017 IEEE International Conference on Microwaves, Antennas, Communications and Electronic Systems (COMCAS), Tel-Aviv, Israel, 13-15 November 2017; pp. 1-3. 39. Akyildiz, I.F.; Su, W.; Sankarasubramaniam, Y.; Cayirci, E. A survey on sensor networks. IEEE Commun.
Mag. 2002, 40, 102-114.
40. Biau, G.J. Analysis of a random forests model. Mach. Learn. Res. 2012, 13, 1063-1095.
41. Brereton, G.R.; Lloyda, R.G. Support Vector Machines for classification and regression. Analyst 2010, 135, 230-267.
42. Dias, M.F.; Antunes, A.; Mota, M.A. Artificial neural networks: a review of commercial hardware. Eng. Appl. Artif. Intell. 2004, 17, 945-952.
43. Granitto, P.M.; Verdes, P.F.; Ceccatto, H.A. Neural network ensembles: evaluation of aggregation algorithms. Artif. Intell. 2005, 163, 139-162.
44. Ojha, K.V.; Abraham, A.; Snasel, V. Metaheuristic design of feedforward neural networks: A review of two decades of research. Eng. Appl. Artif. Intell. 2017, 60, 97-116.
45. Schmidhuber, J. Deep learning in neural networks: An overview. Neural Netw. 2015, 61, 85-117.
Preprints (www.preprints.org) | NOT PEER-REVIEWED | Posted: 13 July 2018 doi:10.20944/preprints201807.0230.v1