DOI: 10.18488/journal.aefr/2016.6.2/102.2.100.108
ISSN(e): 2222-6737/ISSN(p): 2305-2147 © 2016 AESS Publications. All Rights Reserved.
100
IS THE EXCHANGE RATE OF BANGLADESH MEAN REVERTING? A PANEL UNIT
ROOT APPROACH
S. M. Woahid Murad1 1
Assistant Professor, Department of Economics, Bangladesh University of Business and Technology (BUBT), Mirpur-2, Dhaka, Bangladesh
ABSTRACT
This paper evaluates whether the exchange rate of Bangladesh is mean reverting or not by applying first-generation and second-generation panel unit root test approaches. The paper considers annual data from 1986 to 2011 of major twenty-two trading partners of Bangladesh. Although some inconclusive outcomes emerge from the first-generation tests, the second-generation test reconciles the controversy and confirms that the weak form of PPP is relevant for Bangladesh. Consequently, the bilateral exchange rate of Bangladesh is mean reverting and the PPP hypothesis can be considered as an exchange rate determinant in the long-run.
© 2016 AESS Publications. All Rights Reserved.
Keywords:
Purchasing power parity, Panel unit root test, Bangladesh.JEL Classification:
F31, F37, C23.Contribution/ Originality
This study uses newly developed panel data approaches in the framework of purchasing power parity (PPP) in the context of Bangladesh. Unlike prior studies on the PPP theory of Bangladesh, this paper incorporates a number of panel unit root tests to obtain unambiguous outcome.
1. INTRODUCTION
The Purchasing Power Parity (PPP) hypothesis postulates that in the long-run exchange rate between two currencies is equal to the ratio of corresponding national price indices, i.e., the movements in the nominal exchange rate should be proportional to the ratio of national price indices. The theory has a long historical background of several centuries, for instance, Wheatley (1807) and Ricardo (1821). Afterward of the First World War, the theory has emerged in a specific form in Cassel (1918;1922;1928) for determining the nominal exchange rates among the developed economies in the presence of large-scale inflations. Moreover, the post-Bretton woods, period, analysis of the PPP gets more concentration. At that time a large number of studies have been done to investigate whether the PPP truly holds or not in the real world, for instance, Dornbusch (1976); Dornbusch and Krugman (1976); Frenkel (1976) and Frenkel (1981); Frenkel and Johnson (1976) and Roll (1979). The studies on PPP conducted in the 1970s have found little evidence for purchasing power parity in the long-run. However, from the 1980s, the unit root approach has been inaugurated in testing the theory. Seemingly, due to the low power of the test, the econometricians failed to reject the null hypothesis of a unit root for major industrialized economies or did not provide strong empirical support for the theory, for instance, Adler and Lehmann (1983); Taylor (1988) and Mark (1990). From the beginning of the 1990s, panel unit root approaches have been applied to test stationarity of the real exchange rate.
Asian Economic and Financial Review
ISSN(e): 2222-6737/ISSN(p): 2305-2147© 2016 AESS Publications. All Rights Reserved.
101 However, a large number of studies provide empirical evidence for the strict form of the PPP theory by incorporating the panel unit root test, such as Wu (1996); Frankel and Rose (1996); Papell (1997); Meier (1997); Kalyoncu and Kalyoncu (2008). However, the results vary with sample periods, perfection of money market, integration of economies and underlying assumptions of the panel unit root test.
Although PPP theory is frequently reevaluating all over the world using panel unit root approaches from 1990s, there is no seminal study on the theory of PPP incorporating such techniques in the context of Bangladesh.1 To cover the literature gap, this paper attempts to reexamine the PPP theory in the perspective of Bangladesh using panel unit root approaches. Here both first-generation and second-generation tests are incorporated to obtain an impartial result. To conduct the study, major twenty-two trading partners of Bangladesh are considered.
In the next section, theoretical framework of the PPP theory is developed. The subsequent section presents data sources and methodology. The empirical results are presented in the fourth section and finally the fifth section covers the concluding remarks.
2. THEORETICAL FRAMEWORK
The bilateral real exchange rate of Bangladesh ( ) with respect to its trading partner is constructed using the following formula:
( ⁄ ) (2.1)
Where, is the real exchange rate, is the nominal exchange rate, is consumer price index (CPI) for Bangladesh and is CPI for trading partner . Taking the natural log in both sides, we have,
(2.2)
The PPP would hold if the series of is stationary at level. If the unit root exists, the real exchange rate would not be mean reverting and the weak form of PPP hypothesis would not hold. More specifically, the mean reverting real exchange rate model can be developed as
(2.3)
Where is a mean zero covariance stationary process and specifies possible deterministic factors e.g., as a constant or trend. If the estimated value of is not statistically significant, the weak form of PPP would not hold.
3. DATA SOURCE AND METHODOLOGY
3.1. Data SourceIn this paper, the major twenty-two trading partners of Bangladesh are considered, more specifically, Australia, Belgium, Brazil, Canada, China, Denmark, France, Germany, Hong Kong, India, Ireland, Italy, Japan, Malaysia, Netherlands, Pakistan, Poland, Singapore, Sweden, Turkey, United Kingdom, and the United States. The nominal exchange rate of Bangladesh, nominal exchange rates of the twenty-two trading partners against the US dollar and consumer price indices of all economies were obtained from World Development Indicators (WDI) published by the World Bank over the sample period 1986 to 2011. International Financial Statistics (IFS) CD-ROM published by the IMF was also used in some cases where data was not available in the WDI. The cross exchange rate formula was incorporated to obtain the bilateral exchange rate between Bangladesh and its trading partners.
1 A large number of studies have already done in the context of Bangladesh following time series properties, for instance, Ahmed (2005); Shams and Murad (2010). By
© 2016 AESS Publications. All Rights Reserved.
102 3.2. Methodology
The unit root approach in panel data is an extension of the univariate unit root tests of time series analysis. Since univariate unit root tests have low power in rejecting the null hypothesis of a unit root, applied researchers, nowadays, are inclined to panel unit root approaches. In this paper, the Levin et al. (2002) (hereafter write LLC) test, the Im et al. (2003) (hereafter write IPS) test, the Breitung (2000) test, the Hadri (2000) (hereafter write H-LM) test and the
Pesaran (2007) (cross-sectionally augmented IPS, hereafter write CIPS) test are incorporated. To begin with, let us assume the following simple panel data model for real exchange rate ( ) with a standard autoregressive ( ( )) component:
(3.1)
where, is the cross-section dimension; is the time dimension; is a stationary error term the term may contain vector of panel-specific means, panel-specific means and a time trend, or nothing, depending on the options specified in the panel unit root tests and indicates corresponding vector of coefficients of . Equation (3.1) can be expressed as
(3.2)
Therefore, the null hypothesis is for all and the alternative hypothesis . However,
Hadri (2000) H-LM test instead assumes the null hypothesis that all panels are stationary while the alternative is that at least some of the panels suffer from unit root problems. Among the five panel unit root tests, Breitung test, H-LM test and LLC test use common unit root approach, IPS test and CIPS test use individual unit root approach.
3.2.1. The LLC Test
Since the individual unit root test has limited power against the alternative hypothesis with highly persistent deviation from equilibrium, LLC incorporates common unit root process. The null and alternative hypotheses of the test are respectively and .
The LLC test proceeds in three main steps:
First, augmented Dickey-Fuller (ADF) test is occupied for each cross-section by extending the model (3.1) and (3.2) with additional lags of the dependent variable:
∑ (3.3)
In the second step, two auxiliary regressions are estimated:
on (for ) and to obtain the residuals ̂ and
on and to find out the residuals ̂ .
To control the panel-level heterogeneity across , measure
̃ ̂ ⁄ ̂ (3.4)
̃ ̂ ⁄ ̂ (3.5)
Where ̂ denotes estimated standard error from each ADF regression for .
In the third step, the pooled OLS regression is run:
̃ ̃ ̃ (3.6) The standard -statistic for is measured as
̂ ⁄ ( ̂) (3.7)
© 2016 AESS Publications. All Rights Reserved.
103 ̃ ̂ ( ̂) ̃
̃ ⇒ ( ) (3.8)
where ̃ and ̃ are adjustment terms of the mean and standard deviation, ̃ ̅ with ̅ ∑ , and
̂ ∑ ̂
with ̂ ̂ ⁄ ̂ .
3.2.2. The IPS Test
The LLC test is more restrictive in the sense that it requires that to be homogeneous across , which may not conform economic principle (Banerjee et al., 2005). Im et al. (2003) realize such drawback found in the LLC test and allow heterogeneous autoregressive parameter in a panel. Such case frequently appears in empirical studies. The econometric framework of the IPS test can be started from the following ADF regression for each cross section:
∑ (3.9)
The null hypothesis for all and the alternative hypothesis permits some panels to have unit roots, i.e.,
{ (3.10)
The group-mean -bar statistic can be constructed as the average of the individual augmented Dickey-Fuller statistics as follows:
̅ ∑ ( ) (3.11)
Where is the individual –statistic for testing , ̅ after adjustment for mean and variance for all in (3.10) and denote lag lengths.
In the general case where for some cross-sections, Im et al. (2003) show that a standardized ̅ has an asymptotic standard normal distribution:
̅
√ { ̅ } ∑ ( ̅( ))
√ ∑ ( ̅( ))
⇒ ( ) (3.12)
Where mean and variance of the ADF regression -statistics, ( ̅( )) and ( ̅( )), are provided by Im et al. (2003) for various values of and . ̅( ) has standard normal limiting distribution as followed by
while very negative values generate doubt on .
3.2.3. The Breitung (2000) Test
There are several shortcomings found in the LLC and IPS tests. These tests require should be small enough relative to . Im et al. (2003) found that both LLC and IPS have size distortions when becomes larger relative to . It was also found that both tests suffer from a dramatic loss of power if individual-specific trends are included
(Baltagi, 2005). However, Breitung develops an approach that does not occupy a bias adjustment and since Breitung incorporates Monte Carlo experiments, the power of the test is significantly higher than the power of the LLC and the IPS tests. Furthermore, the Breitung test ensures good power even at lower and .
The Breitung test statistics can be obtained from the following steps:
When the number of lags is specified and the trends are not included, the regressions of and on
are run, where . Here standard deviation would be
© 2016 AESS Publications. All Rights Reserved.
104
Therefore,
∑ ∑ ⁄
√∑ ∑
( )⁄
(3.14)
is asymptotically distributed ( ) as followed by . In case of with trend option and when the number of lags is specified, then
∑ ∑
√∑ ∑
( )⁄
(3.15)
where √
( ∑
)
( ) ̅̅̅
∑ ̂
and ∑ ̂
is asymptotically distributed ( ) as followed by and very negative values of generate doubt on .
3.2.4. Hadri (2000) Test
The H-LM test is a residual-based Lagrange multiplier (LM) test, which converts the Kwiatkowski-Phillips-Schmidt-Shin (KPSS) test from time series data to panel data.
To find out the approach of the H-LM test considers the following regression model: With trend: (3.16a)
Without trend: (3.16b)
Since ̂ are the estimated residuals obtained from (3.16a) and (3.16b), then
̂
∑ ∑
̂ (3.17)
where ∑ ̂
̂
́∑ ∑ ̂
and ́ when the trend is specified and ́ otherwise. Subsequently,
√ ( ̂ )⇒ ( ) (3.18)
where ⁄ and ⁄ if the model incorporates trend and ⁄ and ⁄ otherwise. is asymptotically distributed ( ) as followed by and very positive values of generate doubt on . To get a variant of the test that is robust to the heteroscedasticity and serial correlation across panels, in (3.17) ̂ would be
̂ ∑ ( ∑ ̂ ∑ ( ) ∑ ̂ ̂ ) (3.19)
© 2016 AESS Publications. All Rights Reserved.
105 3.2.5. (Pesaran, 2007) Test
Pesaran augmented the conventional ADF regression model with the lagged cross-sectional average and its first difference to obtain the cross-sectionally augmented Dickey-Fuller (CADF) test:
̅̅̅̅̅ ̅̅̅̅̅ (3.20)
Where ̅̅̅̅̅ is the mean at time of all observations. If serial correlation present in of (3.20), then (3.20) must be augmented in the following fashion:
̅̅̅̅̅ ∑ ̅̅̅̅̅ ∑ ̅̅̅̅̅ (3.21)
From estimating the CADF regression for each cross-sections, -statistics are obtained and subsequently the CIPS statistic can be found from the mean value of the -statistics:
∑ (3.22)
The CIPS test yields more precise and reliable results in the presence of cross-sectional dependence than those of the first generation tests discussed earlier in the section.
4. EMPIRICAL RESULTS
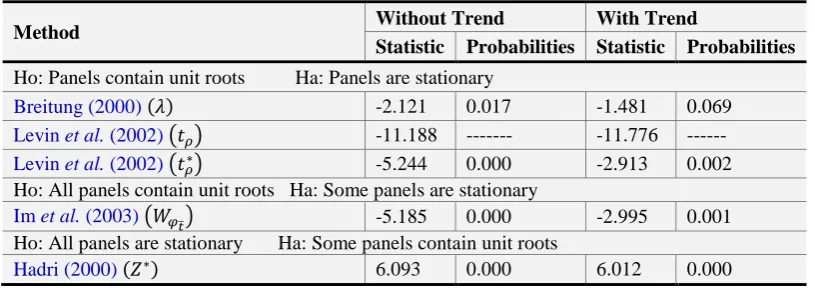
Since there are some drawbacks found in different approaches, only one approach may mislead findings of the paper. Therefore, in order to obtain comprehensive results, several panel unit root approaches have been employed in this paper. The empirical results are presented in Table 1, 2 and 3. Table 1 presents results that are not considered cross sectional dependence, while Table 2 presents results considering the cross sectional dependence. Table 3 shows the CIPS test results.
Table-1. First Generation Panel Unit Root Test Results: Disregarding Cross-Sectional Dependence
Method Without Trend With Trend
Statistic Probabilities Statistic Probabilities Ho: Panels contain unit roots Ha: Panels are stationary
Breitung (2000)( ) -2.012 0.022 -1.511 0.065
LLC Test ( ) -9.835 --- -12.017 ---
LLC Test( ) -3.690 0.000 -3.461 0.000
Ho: All panels contain unit roots Ha: Some panels are stationary
(Im et al., 2003)( ̅) -3.085 0.001 -4.374 0.000
Ho: All panels are stationary Ha: Some panels contain unit roots
Hadri (2000)( ) 6.9855 0.000 4.4016 0.000
Note: Akaike Information Criterion (AIC) determines optimal lag lengths with a maximum lag length of five for the LLC test and the IPS test. For the Breitung test and H-LM test, lag length is automatically selected by , which is available in the Stata software. Width of Bartlett-kernel window set to five.
According to Table 1, the Breitung test, the LLC test and the IPS test provide evidence that are stationary
at level with intercept at 1% or 5% significance level. The tests also provide evidence that are also stationary with intercept and trend at 1% or 5% except the Breitung test. The test rejects the null hypothesis of common unit root at 10% significance level rather than 1% or 5%. However, contrary to the prior three results, the H-LM test rejects the null hypothesis i.e., all panels are stationary with intercept as well as with intercept and trend at 1% significance level. Since among the major trading partners have many analogous features, the obtained results presented in Table 1 may be influenced by the cross-sectional correlation in real exchange rate. To eliminate such impact, the cross-sectional means may be subtracted from time series data.2
2 Suppose, ́
© 2016 AESS Publications. All Rights Reserved.
106 Table-2. First Generation Panel Unit Root Test Results: Considering Cross-Sectional Correlation
Method Without Trend With Trend
Statistic Probabilities Statistic Probabilities Ho: Panels contain unit roots Ha: Panels are stationary
Breitung (2000)( ) -2.121 0.017 -1.481 0.069
Levin et al. (2002)( ) -11.188 --- -11.776 ---
Levin et al. (2002)( ) -5.244 0.000 -2.913 0.002
Ho: All panels contain unit roots Ha: Some panels are stationary
Im et al. (2003)( ̅) -5.185 0.000 -2.995 0.001
Ho: All panels are stationary Ha: Some panels contain unit roots
Hadri (2000)( ) 6.093 0.000 6.012 0.000
Note: Akaike Information Criterion determines optimal lag lengths with a maximum lag length of five for the LLC test and the IPS test. For the Breitung test and H-LM test, lag length is automatically selected by , which is available in the Stata software. Width of Bartlett-kernel window set to five.
Table 2 shows the results regarding cross-sectional dependence. However, the results obtained from demeaned version again produce inconclusive outcomes i.e., the Breitung test, the LLC test and the IPS test provide evidence that the foreign exchange rate of Bangladesh is mean reverting while the H-LM test does not support it. Hlouskova and Wagner (2006) using their large scale simulation study found that the H-LM test seems to reject the null hypothesis often even when true and may contradict the findings those obtained from other tests. Baltagi (2005) also found that the H-LM test contradicted other findings obtained from the three tests. Therefore, ignoring the findings obtained from the H-LM test, the rest of the tests assert that the bilateral real exchange rate of Bangladesh is mean reverting and deviation of domestic and foreign price indices are reflected in nominal exchange rate movements.
Although the first-generation tests (for instance, the LLC test, the IPS test, the H-LM test and the Breitung test) are not capable to meet all potential problems of exchange rate dynamics, the second-generation tests (for instance, the Pesaran (2007)) test) are able to deal well and yield more reliable and precise result. Therefore, Pesaran (2007)
CIPS test is incorporated in the paper to eliminate the controversy arises from Table 1 and 2.
Table-3. Second Generation Panel Unit Root Test Results
Method Without Trend With Trend
Statistic Probabilities Statistic Probabilities Ho: All panels contain unit roots Ha: Some panels are stationary
Pesaran (2007) -1.862 0.031 -2.134 0.016
Note: The optimum lag length is one.
According to the Pesaran CIPS test result presented in Table 3, the null hypothesis of all panels contain unit roots is rejected at the 5% significance level. The result straightens the findings of the Breitung test, the LLC test and the IPS test that at least the weak form of PPP theory holds for Bangladesh. The result is comparable to Chowdhury (2007) where the author postulates that the PPP theory holds for Bangladesh.
5. CONCLUSIONS
© 2016 AESS Publications. All Rights Reserved.
107 Although some ambiguous results have been appeared in the first-generation tests, the second-generation test resolves the ambiguity and confirms that the exchange rate of Bangladesh is mean reverting and disturbance of the price level ratio of Bangladesh and her trading partner is reflected in the nominal exchange rate movements. Therefore, the PPP theory can be considered as a determinant of the exchange rate of Bangladesh in the long-run.
REFERENCES
Adler, M. and B. Lehmann, 1983. Deviations from purchasing power parity in the long run. Journal of Finance, 38(5): 1471–1487.
Ahmed, M., 2005. Purchasing power parity based on capital account, exchange rate volatility and cointegration: Evidence from
some developing countries. Applied Econometrics and International Development, 5(3): 105-116.
Baltagi, B.H., 2005. Econometric analysis of panel data. 3rd Edn., England: John Wiley and Sons Ltd, The Atrium, Southern Gate,
Chic ester, West Sussex PO19 8SQ.
Banerjee, A., M. Marcellino and C. Osbat, 2005. Testing for PPP: Should we use panel methods? Empirical Economics, 30(1): 77–
91.
Breitung, J., 2000. The local power of some unit root tests for panel data, in: B. Baltagi (ed.), Nonstationary panels, panel
cointegration, and dynamic panels, advances in econometrics. Amsterdam: JAI, 15: 161-178.
Cassel, G., 1918. Abnormal deviations in international exchanges. Economic Journal, 28(112): 413–415.
Cassel, G., 1922. Money and foreign exchange after 1914. New York: Macmillan.
Cassel, G., 1928. Post-war monetary stabilization. New York: Columbia University Press.
Chowdhury, I., 2007. Purchasing power parity and the real exchange rate in Bangladesh: A nonlinear analysis. Journal of the Asia
Pacific Economy, 12(1): 61-75.
Dornbusch, R., 1976. Expectations and exchange rate dynamics. Journal of Political Economy, 84(6): 1161–1176.
Dornbusch, R. and P. Krugman, 1976. Flexible exchange rates in the short run. Brookings Papers on Economic Activity, 1(3):
537–575.
Frankel, J.A. and A.K. Rose, 1996. A panel project on purchasing power parity: Mean reversion within and between countries.
Journal of International Economics, 40(1–2): 209-224.
Frenkel, J.A., 1976. A monetary approach to the exchange rate: Doctrinal aspects and empirical evidence. Scandinavian Journal of
Economics, 78(2): 200–224.
Frenkel, J.A., 1981. The collapse of purchasing power parity during the 1970s. European Economic Review, 16(1): 145– 165.
Frenkel, J.A. and H.G. Johnson, 1976. The monetary approach to the balance of payments. London: Allen and Unwin.
Hadri, K., 2000. Testing for stationarity in heterogeneous panel data. Econometrics Journal, 3(2): 148–161.
Hlouskova, J. and M. Wagner, 2006. The performance of panel unit root and stationarity tests: Results from a large scale
simulation study. Econometric Reviews, 25(1): 85-116.
Im, K.S., M.H. Pesaran and Y. Shin, 2003. Testing for unit roots in heterogeneous panels. Journal of Econometrics, 115(1): 53–74.
Kalyoncu, H. and K. Kalyoncu, 2008. Purchasing power parity in OECD countries: Evidence from panel unit root original
research article. Economic Modelling, 25(3): 440-445.
Levin, A., C.F. Lin and C. Chu, 2002. Unit root tests in panel data: Asymptotic and finite-sample properties. Journal of
Econometrics, 108(1): 1–24.
Mark, N., 1990. Real and nominal exchange rates in the long run: An empirical investigation. Journal of International Economics,
28(1-2): 115–136.
Meier, C.P., 1997. Assessing convergence to purchasing power parity: A panel study for 10 OECD countries. Review of World
Economics, 133(2): 297–312.
Papell, D.H., 1997. Searching for stationarity: Purchasing power parity under the current float. Journal of International Economics,
© 2016 AESS Publications. All Rights Reserved.
108
Pesaran, M.H., 2007. A simple panel unit root test in the presence of cross section dependence. Journal of Applied Econometrics,
22(2): 265–312.
Ricardo, D., 1821. Principles of political economy and Taxation, G. Bell and Sons. In E. C. Connor, Eds. London: G. Bell and
Sons 1911.
Roll, R., 1979. Violations of purchasing power parity and their implications for efficient international commodity markets. In M.
Sarnat and Alan M. Taylor and Mark P. Taylor (Eds). International finance and trade. G. P. Szego, Eds., Cambridge.
Mass: Ballinger. pp: 133–76.
Shams, M.N.A. and S.M.W. Murad, 2010. Purchasing power parity (PPP) in the long-run: A cointegration approach.
Jahangirnagar Economic Review, 21(June): 1-7.
Taylor, M.P., 1988. An empirical examination of long-run purchasing power parity using cointegration techniques. Applied
Economics, 20(10): 1369–1381.
Wheatley, J., 1807. An essay on the theory of money and principles of commerce. London: Printed for T. Cadell and W. Davies,
by W. Bulmer and Co., 2: 1807-1822.
Wu, Y., 1996. Are real exchange rates nonstationary? Evidence from a panel data test. Journal of Money, Credit and Banking,
28(1): 54–63.