Language and Dialect Discrimination Using Compression-Inspired
Language Models
Paul McNamee
Johns Hopkins University
Human Language Technology Center of Excellence
Abstract
The DSL 2016 shared task continued previous evaluations from 2014 and 2015 that facilitated the study of automated language and dialect identification. This paper describes results for this year’s shared task and from several related experiments conducted at the Johns Hopkins University Hu-man Language Technology Center of Excellence (JHU HLTCOE). Previously the HLTCOE has explored the use of compression-inspired language modeling for language and dialect identifi-cation, using news, Wikipedia, blog, and Twitter corpora. The technique we have relied upon is based on prediction by partial matching (PPM), a state of the art text compression technique. Due to the close relationship between adaptive compression and language modeling, such com-pression techniques can also be applied to multi-way text classification problems, and previous studies have examined tasks such as authorship attribution, email spam detection, and topical classification. We applied our approach to the multi-class decision that considered each dialect or language as a possibility for the given shared task input line. Results for testset A were in accord with our expectations, however results for testsets B and C were notably worse.
1 Introduction
Automated language identification (LID) can be defined as the task of predicting the dominant language being used by the author of a text. Often the decision task is formulated as selecting one language from a fixed inventory of languages, although it is not uncommon to extend the problem to indicating “none of the above” when it is believed that the text is not written in one of the listed languages. For comparatively large input texts (i.e.,texts longer than a sentence or two), choosing between only a few languages, or when it is diverse languages that are being considered, high levels of accuracy can be achieved (i.e.,over 99%).
TheDiscriminating between Similar Languages(DSL) shared task was started in 2014 and it is now in its third year. The DSL’16 task (Malmasi et al., 2016) is focused on distinguishing between highly related languages, which is a more challenging problem than the general case. Examples include distinguishing between mutually-intelligible variants of a regional language (e.g.,Bosnian, Croatian, and Serbian vari-ants of Serbo-Croatian) or among dialects of imperial languages (e.g.,between African, European, and South American Portuguese).
A variety of approaches have been used for language identification since the increased availability of multilingual corpora in the early 1990s. These include vector comparisons (e.g., cosine similarity) (Damashek, 1995), language modeling (Dunning, 1994; Grefenstette, 1995), and supervised machine learning (Baldwin and Lui, 2010; Zampieri, 2013).
In recent years, there has been increased interest in LID due to the the growth of international (i.e., multilingual) social media platforms. Such user-generated texts tend to be short, less grammatical, and contain highly variable spellings and the frequent use of abbreviations, shorthands, emoticons, and other confounding phenomena which can complicate language identification.
This work is licensed under a Creative Commons Attribution 4.0 International License. License details: http:// creativecommons.org/licenses/by/4.0/
In this paper we discuss the use of compression-inspired language models for predicting the language of texts. In Section 2 we describe classification using the prediction by partial matching algorithm. In Section 3 we report experiments on language identification. In Section 4 we discuss our participation in the DSL’16 challenge and briefly summarize results. Section 5 briefly mentions a few related studies.
2 Prediction by Partial Matching
Prediction by Partial Matching (PPM) is a data compression algorithm developed in the early 1980s when RAM, external storage, and network bandwidth were considerably less abundant than is the case today.
2.1 Overview
Cleary and Witten described the algorithm (1984) and presented two methods for smoothing probabil-ity estimates (termed Methods Aand B). A few years later Moffat investigated engineering improve-ments to the algorithm and introduced a set of parameter estimation enhanceimprove-ments collectively known as MethodC(or PPM-C).
PPM is based on a variable-order Markov language model that contains a parameterN which is the maximal order. When used to compress data files, observations from previously seen data are used to estimate the likelihood of observing a symbol1 in a given context. Generally longer contexts are used when available, starting with the maximal orderN. However, the method backs off to use shorter contexts when a symbol has not been observed in a longer context. Crucially, a context-dependent penalty2is applied when backing off is required.
As an example, seeing a ‘z’, ’t’, or ’c’ is not uncommon following a left-context of “[space] q u i” in English. But an ’h’ would be very unlikely. To represent ‘h’ after “q u i” it will be necessary to back-off using the estimates from shorter contexts such as “u i”. If an ’h’ has never been observed after “u i” then the process continues, with an additional penalty, and further recursive backoff for ’h’ after a context of a single symbol (‘i’).
The A/B/C/D variants of PPM differ in how they model backoff, or “escape” probabilities. The later variants of PPM (e.g.,PPM-C or PPM-D) are considered to achieve more compact codes than the earlier versions.
2.2 Compression-inspired Classification
Adaptive compression is concerned with representing symbols in a minimal number of bits, based on a model trained from a given history (or dataset). This approach can be turned on its head in the follow-ing way. Given several models M1, M2, ..., Mn, each trained from different datasets, and a input text
fragmentT, choose the model that will encodeT in the fewest number of bits. This type of analysis is commonly used with traditional Markov language models (e.g.,Dunning (1994)).
PPM and related compression techniques have been applied to a variety of classification tasks. Frank et al. (2000) used PPM for topical text classification tasks using the Reuters 21578 dataset; their results were not at the level of the state of the art.
The earliest use of entropy-based compression techniques for language identification can probably be attributed to Teahan (2000). He examined several large texts in six Western European languages; his illustration of the method was simplistic, but clear. In the same study he conducts additional experiments in authorship attribution and topic identification.
Between 2005 and 2007, the NIST Text REtrieval Conference (TREC) ran an evaluation of email spam detection. Methods based on compression-inspired language models such as PPM and Dynamic Markov Compression (DMC) were among the top performing approaches (Bratko et al., 2006; Cormack, 2008).
One explanation for why compression-based methods succeed for authorship attribution, language identification, and spam detection, is that decisions can be informed based on short contexts (e.g., char-acter n-grams of lengths 3 to 7). Tasks like topic classification would appear to be a less good fit.
0.84 0.86 0.88 0.9 0.92 0.94 0.96 0.98 1
ar as bg bn ca cs da de el en es et fa fi fr gu hi hr hu it jp ko ks lt lv mk ml mr mt nl no or pa pl pt ro si sk sl sq sr sv ta te th tr ur
F1
-s
co
[image:3.595.72.538.64.212.2]re
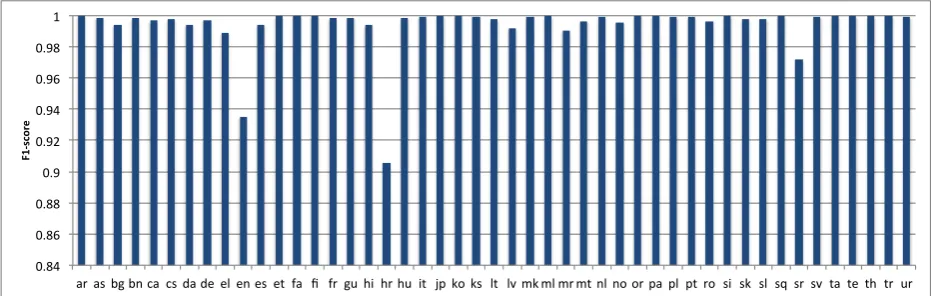
Figure 1: F1 score by language for 47-way LID classification. Data are single sentences. Both training and test exemplars were drawn from ”high quality” corpora (e.g., Europarl, EMILLE, Leipzig, and other national corpora).
3 LID Experiments
In these experiments we use PPM-A, a decision that was undertaken based on the fact our existing software (Bergsma et al., 2012) relies on hash-tables to store frequency counts. Refactoring the source code to use suffix trees would make it easier to adopt the parameter estimate techniques in PPM-C, but we did not have time before this year’s evaluation to consider such a change.
3.1 Initial Testing
For some very preliminary experiments, we begain by assembling a 47-language collection from extant corpora, including well-known sources such as Europarl (v5), the Leipzig corpus, the EMILLE corpus, and other available national corpora. Using 90k sentences for training, and 10k sentences for testing, we attempted the 47-way classification task using PPM-A with ordern= 4, attaining a macro-averagedF1 score of 99.4%. This seemed promising. Furthermore, the majority of the mistakes were in Bosnian, Croatian, and English data, and much of the error was due to mis-labelled data. The per-language F1 scores are shown in Figure 1.
The use of Wikipedia text was considered for training and experimentation in a greater number of languages. However, there are a great many instances of code switching or ”English pollution”, where articles in a given language’s Wikipedia contain much text written in other languages, especially English. For these and other pragmatic reasons, we encourage caution when using Wikipedia corpora for language identification training or testing.
3.2 DSL ’15
To prepare for the DSL’16 shared task, we experimented with the shared task data from 2015 (DSLCC version 2.0, test set A). We sought to investigate the effects of the PPM maximal order, the use of case normalization, the directionality of scoring text, additional text normalizations, and the use of outside data.
In the sections below we report our findings using the accuracy scores reported by the evaluate.py script released with the 2015 data. Because the compression-based classifier does not require tuning hyper-parameters, both thetask1-trainandtask1-devfiles were used to build a model and scoring was done against thetask1-testfile.
3.2.1 Maximal order
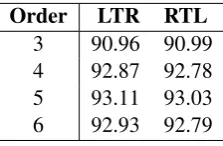
Maximal orders ofn= 4orn= 5often seem to work well. To consider a wider range of possibilities, we looked at values ofnfrom 3 to 6. In this first trial, no normalization of case, punctuation, etc... was performed. Each input line was scored in two ways, either from left-to-right (LTR) or from right-to-left (RTL). Results are shown in Table 1.
Order LTR RTL
3 90.96 90.99
4 92.87 92.78
5 93.11 93.03
[image:4.595.243.355.142.215.2]6 92.93 92.79
Table 1: Comparison of PPM order and direction of processing.
Using a maximal order ofn= 5achieved the overall best result, andn= 3was notably worse.
3.2.2 Case normalization
Next transformation of the input texts to lower-case was examined. Results are shown in Table 2. Some-what surprisingly, a slight decline in performance occurs when case information is removed. An order ofn= 5is still the best choice.
Order LTR RTL
3 89.75 89.96
4 92.85 92.85
5 92.96 92.89
[image:4.595.242.356.335.406.2]6 92.80 92.67
Table 2: Comparison of PPM order and case-folding. Performance drops without case information.
3.2.3 Digit conflation and bidirectionality
Arguably Roman digits should not be very indicative of language. Therefore we explored mapping the digits[1−9]to the digit1(chosen as a representative). Also, rather than score the input text in only one direction, we also considered bidirectional scoring. To produce a bidirectional score the forward (i.e., LTR) and backward (i.e.,RTL) probabilities were combined. The bidirectional probability was computed as follows:
pbi=√pltr×prtl (1)
Table 3 shows a very slight adjustment from conflating digits compared to the results in Table 1 when scoring in only one direction. However, combining evidence from both directions seems to help materially.
[image:4.595.223.373.646.715.2]A score of 93.34 would have been ranked 7th if it were an official submission in 2015 according to Table 5 in Zampieriet al.(2015).
Order LTR RTL Both
3 91.01 91.01 91.06
4 92.92 92.82 93.04
5 93.13 93.16 93.34
6 92.99 92.79 93.15
3.2.4 External Data
Generally with supervised learning using greater amounts of data to build models leads to higher levels of performance. Therefore we tried one additional experiment where 20k sentences were added to the training set. We used 20k sentences from Wikipedia text for Bosian, Croatian, Serbian, Indonesian, and Malaysian. We used newspaper sources for Iberian Spanish (EFE), Brazilian Portuguese (Folha), and European Portuguese (Publico). No data were added for Czech, Slovakian, Bulgarian, Macedonian, Argentine Spanish, or the unknown category “xx”.
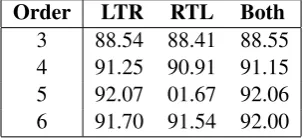
The results in Table 4 were disappointing; an average of about 1.3 points in accuracy were lost. One possible conjecture could be that the test data are drawn from a similar distribution as the training data. Were that to be the case, then adding external data that is noti.i.d. to the training and test data could be expected to be more harmful than helpful.
Order LTR RTL Both
3 88.54 88.41 88.55
4 91.25 90.91 91.15
5 92.07 01.67 92.06
[image:5.595.223.375.226.295.2]6 91.70 91.54 92.00
Table 4: Augmenting training data using external corpora – compare results to Table 3. The use of additional data degrades performance.
4 Participation in DSL’16
As a result of the trials reported in Section 3 we anticipated that our best results would be obtained using an order ofn= 5, preserving case, conflating digits, and scoring text bidirectionally. As use of external corpora had not improved in our earlier results, we did not submit any “open” results, restricting models to using the provided training data.
We spent approximately one day working with the DSL’15 data in preparation for the current evalua-tion. About 3 hours was spent working on the DSL’16 task and preparing submissions.
4.1 Submitted Runs
Table 5 describes the characteristics of the submitted runs. The B1 and B2 partitions were treated iden-tically to each other.
Task Run Conditions
A 1 - closed PPMA (5), bidirectional, case preserved, digit-folding
A 2 - closed PPMA (5), bidirectional, lower-cased, all non-letter, non-whitespace characters deleted B 1 - closed PPMA (5), bidirectional, case preserved, digit-folding
B 2 - closed PPMA (5), bidirectional, lower-cased, all non-letter, non-whitespace characters deleted C 1 - closed PPMA (4), bidirectional, no text normalization
C 2 - closed PPMA (5), bidirectional, no text normalization C 3 - closed PPMA (6), bidirectional, no text normalization
Table 5: Characteristics of submitted runs.
Results for each run are given in Table 6 below.
4.2 Discussion 4.2.1 Test Set A
Test Set Track Run Accuracy F1 (micro) F1 (macro)
A closed run1 0.8772 0.8772 0.8769
A closed run2 0.8727 0.8727 0.8729
B1 closed run1 0.5300 0.5300 0.5101
B1 closed run2 0.5460 0.5460 0.4934
B2 closed run1 0.5100 0.5100 0.4965
B2 closed run2 0.5540 0.5540 0.5132
C closed run1 0.4123 0.4123 0.4111
C closed run2 0.3870 0.3870 0.3803
[image:6.595.149.450.61.202.2]C closed run3 0.3909 0.3909 0.3858
Table 6: Results for all hltcoe runs.
lowest score was 0.8253. With twelve classes, a purely random baseline would have an accuracy of only 0.083; however, most languages or dialects only have one or two other confusable classes, so it is natural to expect performance above 0.33 or 0.50.
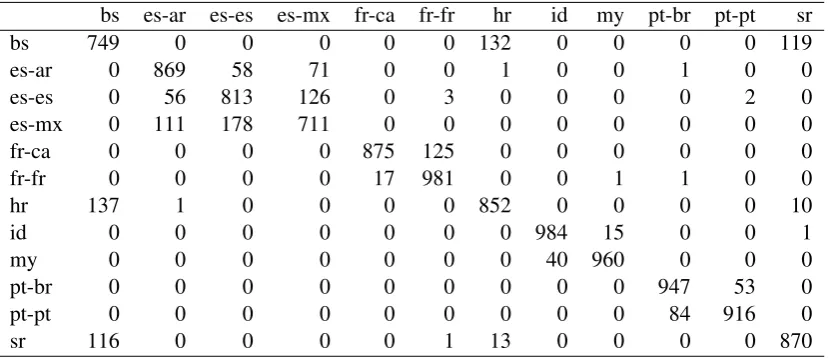
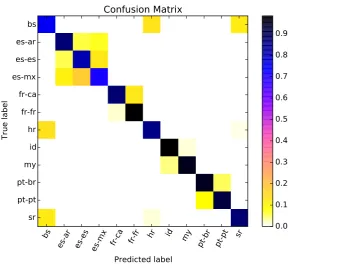
From Table 6 we can compare the effectiveness of our two Task-1 submissions. Run 1 (case preserved, minimal normalization) was marginally more effective than Run 2 which employed more aggressive text normalization. The confusion matrix3 for Run 1 is given below in Table 7 and graphially in Figure 2. Bosnian and Mexican Spanish proved to be the most challenging classes.
bs es-ar es-es es-mx fr-ca fr-fr hr id my pt-br pt-pt sr
bs 749 0 0 0 0 0 132 0 0 0 0 119
es-ar 0 869 58 71 0 0 1 0 0 1 0 0
es-es 0 56 813 126 0 3 0 0 0 0 2 0
es-mx 0 111 178 711 0 0 0 0 0 0 0 0
fr-ca 0 0 0 0 875 125 0 0 0 0 0 0
fr-fr 0 0 0 0 17 981 0 0 1 1 0 0
hr 137 1 0 0 0 0 852 0 0 0 0 10
id 0 0 0 0 0 0 0 984 15 0 0 1
my 0 0 0 0 0 0 0 40 960 0 0 0
pt-br 0 0 0 0 0 0 0 0 0 947 53 0
pt-pt 0 0 0 0 0 0 0 0 0 84 916 0
sr 116 0 0 0 0 1 13 0 0 0 0 870
Table 7: Confusion maxtrix for hltcoe run 1 (test set A – closed training).
4.2.2 Social Media data
As the DSL’15 data had been single sentences from journalistic texts, we had expected the DSL’16 social media data to be single tweets with one message per line. We were preparing submissions just hours before the deadline, and it came as quite a surprise upon unpacking the test-set zip file to find that the data contained multiple tweets per line, and that a given user’s tweets could be in multiple languages. Due to time limitations it wasn’t feasible for us to do anything other than treat the input like the data in Test Set A and simply ignore this phenomena. Thus, the input line was treated as one, possibly long message.
Additionally, we did not remove any hashtags, URLs, or other potentially English-looking twitter phenomena. Together these two factors contributed to our very low ranking on this test set (i.e.,last of 14 systems).
[image:6.595.93.508.351.530.2]bs
es-ar es-es es-mx fr-ca fr-fr
hr id my
pt-br pt-pt
sr
Predicted label
bs
es-ar
es-es
es-mx
fr-ca
fr-fr
hr
id
my
pt-br
pt-pt
sr
True label
Confusion Matrix
[image:7.595.142.486.75.343.2]0.0
0.1
0.2
0.3
0.4
0.5
0.6
0.7
0.8
0.9
Figure 2: Graphical depiction of the confusion matrix for hltcoe run 1 (test set A – closed training).
4.2.3 Task 2 / Test Set C dataset
It also came as a last-minute surprise to find that the dialectal Arabic dataset was phonetically encoded and not expressed in native orthography. We had previously worked with written dialect identification using the test sets produced by Zaidan and Callison-Burch (2011; 2014). Working with automatically produced phonetic representations is undoubtably a more challenging task, but not one that we were prepared for. In hindsight, it would have been worthwhile to examine the training data beforehand. Our runs were ranked 15th of 18 systems.
5 Related Work
Use of character-level n-grams for LID is not new. Cavnar and Trenkle (1994) developed the TextCat system, which has served as a publicly available LID baseline for over two decades.
Information-theoretic and compression-based techniques have been used for LID for some time. Be-sides Teahan’s early work (2000), such approaches were “rediscovered” by Benedetto et al. (2002), generating some controversy in the computational linguistics community (Goodman, 2002).
Bobicev submitted results to the DSL’15 shared task using the PPM-C variant (2015). Our results appear similar to her published results on the 2015 task; we suspect that her use of PPM-C vs. our use of PPM-A is probably responsible for her higher score (94.14 vs. 93.34) on that dataset.
Other recent work in language detection includes: (Baldwin and Lui, 2010; Gottron and Lipka, 2010; Lui and Baldwin, 2011; Tromp and Pechenizkiy, 2011; Bergsma et al., 2012; Carter et al., 2013; Brown, 2014).
6 Conclusions
evaluation was on par with our expectations given our post-hoc testing with the DSL’15 dataset. In future work we would like to determine whether different methods for estimating escape probabilities, such as PPM-C, can yield superior results.
References
Timothy Baldwin and Marco Lui. 2010. Language identification: The long and the short of the matter. InProc.
HLT-NAACL, pages 229–237.
Dario Benedetto, Emanuele Caglioti, and Vittorio Loreto. 2002. Language trees and zipping. Physical Review
Letters, 88(4):2–5.
Shane Bergsma, Paul McNamee, Mossaab Bagdouri, Clayton Fink, and Theresa Wilson. 2012. Language identi-fication for creating language-specific twitter collections. InProceedings of the second workshop on language in social media, pages 65–74. Association for Computational Linguistics.
Victoria Bobicev. 2015. Discriminating between similar languages using ppm. InJoint Workshop on Language
Technology for Closely Related Languages, Varieties and Dialects, page 59.
Andrej Bratko, Gordon V. Cormack, Bogdan Filipic, Thomas R. Lynam, and Blaz Zupan. 2006. Spam filtering using statistical data compression models. JMLR, 6:2673–2698.
Ralf D Brown. 2014. Non-linear mapping for improved identification of 1300+ languages. InEmpirical Methods
in Natural Language Processing.
Simon Carter, Wouter Weerkamp, and Manos Tsagkias. 2013. Microblog language identification: Overcoming the limitations of short, unedited and idiomatic text. Language Resources and Evaluation, 47(1):195–215.
William B. Cavnar and John M. Trenkle. 1994. N-gram-based text categorization. In Proc. Symposium on
Document Analysis and Information Retrieval, pages 161–175.
John G. Cleary, Ian, and Ian H. Witten. 1984. Data compression using adaptive coding and partial string matching.
IEEE Transactions on Communications, 32:396–402.
Gordon V. Cormack. 2008. Email spam filtering: A systematic review. Found. Trends Inf. Retr., 1(4):335–455,
April.
Marc Damashek. 1995. Gauging similarity with n-grams: Language-independent categorization of text. Science,
267(5199):843.
Ted Dunning. 1994. Statistical identification of language. Technical Report 94-273, Computing Research Labo-ratory, New Mexico State University.
Eibe Frank, Chang Chui, and Ian H. Witten. 2000. Text categorization using compression models. InProc.
DCC-00, IEEE Data Compression Conference, Snowbird, US, pages 200–209. IEEE Computer Society Press.
J. Goodman. 2002. Extended Comment on Language Trees and Zipping. eprint arXiv:cond-mat/0202383,
Febru-ary.
Thomas Gottron and Nedim Lipka. 2010. A comparison of language identification approaches on short, query-style texts. InProc. ECIR, pages 611–614.
Gregory Grefenstette. 1995. Comparing two language identication schemes. InProc. Third International
Confer-ence on Statistical Analysis of Text.
Marco Lui and Timothy Baldwin. 2011. Cross-domain feature selection for language identification. InProc.
IJCNLP, pages 553–561.
Shervin Malmasi, Marcos Zampieri, Nikola Ljubeˇsi´c, Preslav Nakov, Ahmed Ali, and J¨org Tiedemann. 2016. Discriminating between Similar Languages and Arabic Dialect Identification: A Report on the Third DSL
Shared Task. In Proceedings of the 3rd Workshop on Language Technology for Closely Related Languages,
Varieties and Dialects (VarDial), Osaka, Japan.
William John Teahan. 2000. Text classification and segmentation using minimum cross-entropy. InProc. RIAO, pages 943–961.
Erik Tromp and Mykola Pechenizkiy. 2011. Graph-based n-gram language identication on short texts. InProc.
20th Machine Learning conference of Belgium and The Netherlands, pages 27–34.
Omar F. Zaidan and Chris Callison-Burch. 2011. The arabic online commentary dataset: an annotated dataset of informal arabic with high dialectal content. InProc. ACL, pages 37–41.
Omar F Zaidan and Chris Callison-Burch. 2014. Arabic dialect identification. Computational Linguistics,
40(1):171–202.
Marcos Zampieri, Liling Tan, Nikola Ljubeˇsic, J¨org Tiedemann, and Preslav Nakov. 2015. Overview of the DSL
shared task 2015. InJoint Workshop on Language Technology for Closely Related Languages, Varieties and
Dialects, page 1.
Marcos Zampieri. 2013. Using bag-of-words to distinguish similar languages: How efficient are they? In