To Investigate Sensitivity Behavior of
Reliability Indices Simultaneously for
Development Planning
Majid Ghani Varzaneh
1, Reza Dashti
2, Vahid Amir
3M.Sc, Dept. of Electrical Engineering, Islamic Azad University, Jasb, Iran1
Assistant Professor, Dept. of Electrical Engineering, Iran University of Science and Technology, Tehran, Iran2
Assistant Professor, Dept. of Electrical Engineering, Islamic Azad University, Kashan, Iran3
ABSTARCT: In this paper, a new index is defined as a product of multiplying some reliability indices and then concurrent behavior of these indices regarding the load growth is investigated. A distribution system from reliability viewpoint is developed to improve one or more reliability indices. In this paper, in order to widen the study scope, an index is defined which may be affected by any kind of development in the system. Multiple Index (MI) which indicates three different index reliability categories simultaneously is a proper suggestion. From reliability viewpoint, since the amounts of reliability indices depend on the number of customers, consumption energy, failure rate, and outage time of load points; development in today and the load growth phenomena in the future will change the amounts of reliability indices and divert distribution system from optimal status. In this paper Multiple Index sensitivity regarding load growth is applied to investigate load growth effects on the development. At the end, the status of all load points from sensitivity viewpoint is recognized after applying development process and load growth, and it is proved that the load point which Multiple Index has the most amount in it, is the optimum location for investment from sensitivity viewpoint regarding the load growth.
KEYWORDS: Distribution System, Development, Reliability, Load Growth, Sensitivity.
Ι. INTRODUCTON
In this paper, the result of multiplying a number of distribution system reliability indices is used. The aim of this definition is to consider any kind of development in distribution systems. To calculate this index, reliability indices of the distribution system should be calculated. [1-3] have proposed the calculation methods for distribution system reliability indices.
Reconfiguration occurs when a sub-branch of a distribution system is taken for another distribution system to improve the reliability, power factor, and voltage level. This paper has focused on factors such as the first two factors of load growth. Thus, firstly the studies are only valid in short-term; and secondly load growth point is always considered on one distribution system's load point. In other words, load growth is not studied concurrently in two or more place of the study.
Development activities in a distribution system are carried out regarding different aims such as reliability improvement, loss reduction, power factor improvement, etc. In this regard, different activities like placement and installing distributed generation units, switch placement, repairing and maintenance, etc. are carried out. All development activities aiming at improving the reliability in a distribution system are done to reduce failure rate or customers outage time. Thus in this paper development activities are divided into two categories. The first category includes activities which improve customers' outage time and the second one includes activities which reduce their failure rate.
Distributed generation unit placement as a development activity in distribution system can be performed with different goals and different methods. Some references have carried out this activity with the aim of optimization of losses and by using different methods; for instance [4-7] have used Genetic algorithm, Digsilent software, Ant Colony algorithm, and an Improvement Analysis (IA) method respectively for optimization purposes. Other system variables can also be considered; like [8] which has done distributed generation unit placement using continuous power flow method for voltage level sustainability. In some references a number of system variables are optimized; like [9] which losses and power factor are optimized concurrently using a Bees algorithm, [10] optimizes loss sensitivity and voltage level using Migrating Birds algorithm, [11] optimizes loss sensitivity and voltage level using continuous power flow, and [12] which optimizes voltage level, loss, distribution system reliability using Bees algorithm. None of the [4-12] has studied load growth in the future and definitely there is no guarantee that the variables used in these references remain optimized in future as well.
Another activity which leads to reduction in failure rate and customers' outage time of distribution system is repairing and maintenance. In this regard, reference [13] optimizes repairing and maintenance plans using risk management in the long-term. In this method a real model of device failures and failure results are shown. By doing this method on a given distribution system, expected costs are lowered and the risk of important operation costs is minimized. [14] has applied Markov method for finding the number of required inspections. For this purpose the system's Markov model is drawn and then the possible states are studied and by defining the costs of inspection, repairing and outage are found as the target function and solving that leads to inspection frequency. [15] describes repairing methods with focus on reliability. Implementing this method is done in three stages. At the end of the third stage, a target function with focus on reliability is prepared and optimizing that using Genetic algorithm optimized repairing plan is recognized. [16] finds a repairing plan by making a balance between predictive repairing and corrective repairing. Target function in this reference is the costs of repairing and outage and is optimized using Migrating Birds algorithms. [17] is recognized cutting and pruning of trees and Weed. Optimization is carried out in such a way that distribution system reaches the maximum reliability. Running this method on a real distribution system results in reaching the maximum reliability and minimum cost. [18] optimizes predictive repairing using Migrating Birds algorithm by allocating the budget to repairing and maintenance activities, customers outage cost reaches its minimum. Again in this framework, none of the [13-18] has considered load growth in an optimization trend in the future and so their current studies may face sever changes or became invalid in the future.
Switch placement in a distribution system is also another development activity. By proper placement, failure rate and outage time for a number of load points can be reduced. [19] optimizes system reliability and costs of buying the switches at the same time. The target function in this reference is described as a fuzzy membership function which is optimized using Ant Colony algorithm. In this reference, future load growth which leads to changes in reliability indices amounts are not studied in target function calculation and thus system optimization will be temporary.
asset management of a distribution system and successfully indicated that carrying out these studies cause to profitability of distribution companies.
The references which have considered distribution system reliability, either single or in accompany with other system variables have used one or two categories of the three indices described in the abstract; but in this paper by defining Multiple Index which is a production of three reliability indices based on time, frequency, and energy, and also studying its sensitivity behavior to future load growth, different system behaviors after running development process and load growth are analyzed and the system optimum point for investment is found. At next sections modeling the distribution system, designing development index, and sensitivity analysis are addressed.
ΙΙ. MODELING DISTRIBUTION SYSTEM AND SENSITIVITY
In this paper, there is no limitation for topology type of a distribution system and customers' arrangements, and further results will hold for different distribution systems with different load arrangements. Hence the topology of distribution system can be of any kind, i.e. radial, circular, etc. Since different variables of a distribution system like failure rate, outage time, number of customers, etc. are used in the next section of the paper, a total topology for distribution system should be presented. Fig.1 shows the total topology of a radial distribution system. This topology is extracted from [3].
Fig. 1 Topology of a distribution system [3]
Distribution system in Fig.1 can include a desirable number of distributed generation units in desirable points with desirable power. Also, the indicated topology in Fig.1 can be of circular kind or etc. In Fig.1, the contour between two bus bar in the main path, section and the contour between a bus bar to load point is called Lateral Distributor. After
every bus bar, a sectionner key is located in the main path and a fuse in lateral distributor. LP1 to LPn are customer's
locations. A circuit breaker key is located at the beginning of the feeder. There is always an outage removal office in every distribution system which its duty is to fix outages, and usually is located at the beginning of the feeder. System analysis in Fig.1 is presented in [3].
Distribution system development can lead to improve one or more reliability indices. Since not any development activity essentially improves all the indices, thus Multiple Index can be a proper suggestion for showing any development leading to system reliability improvement. In this paper in order to investigate simultaneous behavior of indices based on time, frequencies and energy; MI which is a production of three indices of reliability indices is used. In the past, distribution system status from utilization viewpoint and development based on one or more reliability index was taken into account; however by defining this index, any development may lead to a MI index change. Multiple Index is defined according to (1):
Fuse Outage Removal
Office 63/20 Substation
LP1 LP2 LP3 LP4 LPn
Fourth Section
First Lateral Distributor
Disconnector
Fourth Load Point Circuit
(1)
AENS SAIFI SAIDI
MI = . .
AENSbase SAIFIbase SAIDIbase
SAIFI, SAIDI, and AENS are frequency-based, time-based and energy-based index respectively which are described in [1-3] completely. SAIFIbase, SAIDIbase, AENSbase are basic amounts of related indices. Since the product of three indices
leads to a quantity with a non-standard unit; so before applying multiplication, the division of each index by the basic amount of the same index the Multiple Index will be without a unit. Basic amounts can be previous system indices before applying development and load point or any other kind which depends on analyst's point of view. However since the aim of this research is investigating MI than to load growth; according to what will be said basic amounts have no significance and will not be appeared in sensitivity statement.
This index has significance advantages compared to other indices which may probably be defined. A partial indication of customer satisfaction and distribution company profits is one of the advantages of this index. Regarding the fact that Energy not Supplied (ENS) is an index of distribution company loss, it can be concluded due to Average Energy not Supplied Index (AENS), multiple index is a coefficient of distribution company loss profit. At one hand, since Average Energy not Supplied Index (AENS) is used rather than Energy not Supplied Index(AENS) it can be concluded that in this index, at the same time of indication of loss profit of distribution company, the customer dissatisfaction of the system is also indicated. Using SAIDI and SAIFI indices is also an indication of distribution company profit and customer satisfaction simultaneously. Since the increase in amount of these two indices causes customer discouragement for electrical energy from the related company (in structured systems), thus the existence of this two indices in multiple index in fact is the indicator of distribution and customer satisfaction. Each distribution system is working regards the special condition of weather, social culture, tree growth and forage, etc. So it can be concluded that basis amounts for the two distribution systems working in different conditions can be different. With this description, one can say one of the other advantages of Multiple Index is comparison ability between two distribution systems with different basic amounts.
Since the amounts of reliability indices are changed with the load growth in the system, so it can be concluded that MI amount is changed with the existence of this phenomenon.
The issue to be addressed in this paper is that how and where the system should be developed so that the MI sensitivity to load growth reaches the minimum in the future? By doing that one can be sure that if in the future the system faces the load growth, then the amount of MI showing the system status get the least diversion from the original amount. For this purpose, sensitivity index is defined according to (2):
(2)
Sensitivity =
[Maximum MI(with considering load growth)
-MI(without considering load growth)]
/MI(without considering load growth)
With the calculation of sensitivity amount according to (2), the rate of MI diversion will be gained after the occurrence of load growth. In other words, amount of (2) shows the possible diversion for MI; this analysis can be done after the development in the system too. It may be possible that distribution companies consider different plans for development in the systems. In this way the company can get the system statues regarding MI after load growth using (2) for all plans, and then choose the plan with the least sensitivity. By doing this, the distribution company can claim the development after load growth has the least diversion from developed amount. Simplifying (2) makes the analysis simpler.(3) is the simplification of (2).
(3)
Sensitivity =
[Maximum SDI(with considering load growth)
ΙΙΙ. SENSITIVITY ANALYSIS
In figure1 which shows a radial distribution system, if the number of customers at ith location is shown by Ni, failure
rate of ith load point is shown by λ, outage time of ith load point by Ui and the average consumed power of ith load point
by Ei; reliability indices required for the system are defined according to 4, 5, 6 [1], [2], [3].
(4)
n
E U
i i
E U +E U +...+E U
i=1
1 1
2 2
n
n
AENS =
=
n
N +N +...+N
1
2
n
Ni
i=1
(5) n
N λi i
N λ +N λ +...+N λ
i=1 1 1 2 2 n n
SAIFI = =
n N +N +...+N1 2 n
Ni i=1
(6) n
N Ui i
N U +N U +...+N U
i=1 1 1 2 2 n n
SAIDI = =
n N +N +...+N1 2 n Ni
i=1
If the system faces with load growth, the reliability indices showed in relations 4, 5, 6 will change. It is assumed that the maximum amount of MI in the existence of load growth is due to the state which in the system has faced the load growth in load point x. This point is called critical load point. Now if ΔL is the number of customer added to the system and ΔE is the average consumed power added to the load growth in the system, reliability indices introduced in 4, 5, 6 in existence of load growth at load point x will be in the form of 7, 8, 9.
(7) n
E Ui i i=1 AENS =
n Ni i=1
E U +...+(E +ΔE)U +...+E U1 1 x x n n =
N +N +...+N +ΔL1 2 n
(8) n
N λi i i=1 SAIFI =
n Ni i=1
N λ +...+(N1 1 x+ΔL)λ +...+N λx n n =
N +N +...+N +ΔL1 2 n
(9) n
N Ui i i=1 SAIDI =
n Ni i=1
N U +...+(N +ΔL)U +...+N U1 1 x x n n =
N +N +...+N +ΔL1 2 n
In calculation of sensitivity according to 3, basic amounts in numerator and denominator of the first term are simplified and thus they are not appeared in the sensitivity relation. For simplification of relation 5, first the following assumptions should be considered:
(10)
α = N +N +...+N
1
2
n
(11)
β = N U +N U +...+N U
1 1
2
2
n
n
(12) θ = N λ +N λ1 1 2 2+...+N λn n
(13)
= E U +E U +...+E U
1 1
2
2
n
n
Replacing relations 4, 5,…, 13 in relation 3 and simplification leads to:
(14)
(β + ΔLU )(θ + ΔLλ )( + ΔEU )
x
x
x
3
(α + ΔL)
Sensitivity =
1
βθ
3
α
First, for simplification, relation 14 can be simplified assuming load growth is less than 10 percent of total number of
customers(∆𝐿 ≤ %10𝛼):
(15)
(β + ΔLU )(θ + ΔLλ )( + ΔEU )
x
x
x
Sensitivity =
1
βθ
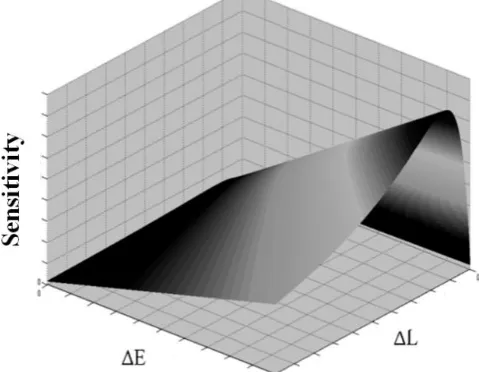
Fig. 2 Sensitivity curve than to ΔL and ΔE for (∆𝐿 ≤ %10𝛼)
As it can be observed from Fig.2, sensitivity curve for (∆𝐿 ≤ %10𝛼) has a second-order behavior than to ∆𝐿 , and has
a first-order behavior than to ∆E . If the amount of ∆L is more than 10 percent of total numbers of feeder customers (relation 14) it can be said that sensitivity curve has a similar behavior like Fig.3.
Fig. 3 Sensitivity curve than to ΔL and ΔE for all ΔL amounts
As it is obvious from Fig.3, for all ΔL amounts, sensitivity curve is not ascending and for ΔL, sensitivity amount begins to decrease from a special point.
From this point all studies are done using relation 15. This is only for simplification of calculation and as it will be said further, proved statements for all ΔL amounts will hold. Extension of relation 15 leads to:
(16)
2
2
2
Sensitivity = [(ΔL ΔEU
x
λ + ΔL U λ
x
x x
+ ΔLΔEU (λ β + θU ) + ΔL (λ β + θU )
x
x
x
x
x
+ ΔEβ U ) / β θ]-1
x
Relation 16 shows that MI sensitivity to load growth is always a positive amount and as it is also obvious in Fig.3, sensitivity relation is a second-order relation than to ΔL, and a first-order one than to ΔE. This relation can be analyzed when the distribution company intends to develop the system in order to investigate the states occurs after load growth in the system. This relation reveals that if the system which is developed by development index introduced in relation 3 faces with load growth with the number of ΔL and the average consumption power ΔE; then how much the development index amount will be diverted from the original calculated amount.
As it was denoted, investment in distribution systems is done in order to improve reliability and to reduce failure rate and outage time of load point. It is tried to find out which load point's outage time or failure rate will be improved so
that if the system faces load growth in the future, MI index amount will have the least amount. If the system developed
in this way, it can be concluded that load growth has the least impact on the development. Optimum investment from multiple index sensitivity means prioritization of load points for outage time reduction with failure rate so that sensitivity reaches the least possible amounts.
Regarding the fact that numerator and denominator of the relation 16 are dependents to outage time and failure rate of load points, reducing outage time and failure rate of load point leads to reduction in numerator and denominator. For finding direction and severity of sensitivity changes than to outage time changes and failure rate of load point, relation 16 should be partial derivative.
First the changes of outage time of load point are investigated. Deriving relation 16 leads to outage time of load points:
(17)
(Sensitivity)
2
= [-θ(N + E β)(ΔL ΔEU
i
i
x
ui
i
x
2
2
+ ΔL U λ + ΔLΔEθU
x x
x
)
2 2
2 2
2
- θ
ΔLU N - ΔLβ θ U E ]/(β θ)
x i
x i
All terms of relation 17 have negative amounts and so it can be concluded that reducing outage time leads to increase in non-critical load points of sensitivity amount. If it a assumed that sensitivity amount is Sensitivity(0) before applying the development in the system, and Sensitivity(1) after applying the development, then according to differential relation and assuming all variables to be constant except for outage time of load point, relation 18 can be proposed:
(18)
(Sensitivity)
Sensitivity(1) - Sensitivity(0) =
.(ΔU )
i
ui
Relation 17 and 18 show that a development activity which leads to reducing outage time of ith load point (i≠x), will
also lead to increase the sensitivity. On the other hand it can be seen that derivative of sensitivity than to outage time of
load points (17) depends on Ni and Ei, and increasing Ni and Ei leads to sensitivity increase will be more for each
amount reduction. Regarding the fact that the load point which has more Ni has more Ei; it can be concluded that the
(19)
(Sensitivity)
2
2
[(2 L
EU
x x
L
x
(
E U )
x x
Ui
i=x
L E(
x x
N
)+ L (
x x
N
)
LE (
x
x
U )+ E ( +U N ))
x
x x
2
2
2
- (N
x
E )( L
x
EU
x x
L U
x x
+ L E(
x
U ) L(
x
x
U )
x
2
+ E
U )] / (
x
)
Relation 19, with the current appearance can not be analyzed easily and should be simplified. Simplifying relation 19 leads to relation 20:
(20)
(Sensitivity)
2
[(2
U (N
x
x
E
x
))( L
EU
x x
)
Ui
2
i=x +(
U (N
x
x
E
x
))( L
x
)
+(
U (N
x
x
E
x
))( L E(
x
U ))
x
2
+( L
(
N U ))
x x
E
N U
x x
+(
U (N
x
x
E
x
))(
L)
2
+ L E
U (N
x
x x
)] / (
)
Regarding the fact that amounts of (2𝛽𝜙 − 𝑈𝑋 𝑁𝑋𝜙 + 𝐸𝑋𝛽 , 𝛽𝜙 − 𝑈𝑋 𝑁𝑋𝜙 + 𝐸𝑋𝛽 and (β − NXUX) are always
positive, it can be concluded that all terms of relation 20 have always positive amounts; thus derivative of sensitivity with respect to outage time of load point is a positive amount. So according to 18 it can be concluded that trying to reduce outage time of critical load point leads to reduce sensitivity and since this point is a critical load point and needs investment for outage time reduction from sensitivity viewpoint, it is in investment priority than to load growth. There is a similar analysis for failure rate reduction of load point. Deriving of sensitivity function with respect to failure rate of load point (except for the critical load point) leads to:
(21)
(Sensitivity)
2
= [-N (ΔLΔEU
i
x
λ + ΔL U λ
x
x x
λi
2
i
x +ΔLΔEβU λ + ΔL βλ )]/βθ
x x
x
All terms in numerator of relation 21 has negative amounts and the denominator term is always positive; so reducing failure rate of non-critical load point leads to sensitivity increase. Again if it is assumed that sensitivity amount is Sensitivity(0) before applying development in the system and Sensitivity(1) after development apply, according to differential relation , assuming all variables to be constant except for failure rate of load point, relation 22 can be stated as following:
(22)
(Sensitivity)
Sensitivity(1) - Sensitivity(0) =
.(Δλ )
i
i
As it is obvious from relation 21, the load point which has less Ni, will cause less increase for a definite reduction in its
failure rate amount. Thus it can be concluded that among non-critical load points, the load point which has a less Ni, its improvement will cause less sensitivity to load growth. So among non-critical load points, the load point with the least
Ni is placed in investment priority.
Now it is the time to investigate sensitivity behavior than to failure rate reduction. Deriving relation 15 than to failure rate of critical load point:
(23)
(Sesitivity)
2
2
2
[ ( L EU
x
L U
x
i
i
x
L EU (
x
N U )
x x
L (
N U )
x x
2
2
2
+ E N U ) N ( L EU
x x
x
x
x
L U
x x
+ L EU (
x
x
U )
x
L (
x
U )
x
+
E
U ] /
2
x
Simplification of relation 23 leads to:
(24)
(Sesitivity)
2
2
2
[(
N
x x
)( L
EU
x
L U
x
i
2
i=x + L EU
x
L
)] /
All terms of relation 24 are always positive, thus it can be said that derivative of sensitivity with respect to failure rate of load point leads to MI sensitivity reduction.
Until now development in direction of failure rate reduction or repairing time of load points has been investigated completely. In doing calculations, it was assumed that development in any time improves only one of load points but these conditions may not hold in real world; in other words one can say improvements in one load point may lead to improvements of other points. Also development process may be made to failure rate reduction and outage time simultaneously. In these conditions differential relation should be considered according to relation 25 assuming all variables including outage time and failure rate of all load points.
(25)
(Sensitivity)
(Sensitivity)
d(Sensitivity)
.dU
i
.d
i
Ui
i
1
2
In relation 25, coefficients of 1 and 2 are derivative amounts which were calculated in relations 17, 20, 21, and 24 completely.
It was assumed that in all analysis that the number of load growth are less or equal to 10 percent of total number of feeder customers; this principle may not hold in practice and the number of load growth customers may be more than 10 percent of total number of feeder customer. In this state it can be said the applied estimation in relation 15 does not
affect the proved statements, and would be only a constant coefficient in derivation process if the assumption (∆L ≤
(26)
3
(β + ΔLU )(θ + ΔLλ )( + ΔEU )
α
x
x
x
Sensitivity = (
)(
) 1
3
βθ
(α + ΔL)
In order to prove described subjects in previous paragraph, one can say that in relation 26, the coefficient 𝛼
3
(𝛼 +Δ𝐿)3
does not depend on outage time and failure rate of load points and thus will appear as a constant coefficient in derivative (derivative of sensitivity with respect to outage time and failure rate of load points) and thus it can be said all stated
statements about sensitivity and investment priority, etc will also hold for(∆𝐿 ≤ %10α).
To sum up, it can be said not only critical load point needs investment from development viewpoint, but also has an investment priority from viewpoint than to load growth. Depending on investment amounts will be consumed in critical load points, it can be decided than which item, outage time or failure rate will have investment priority. Investment in critical load point will be made until this load point will be converted to a non-critical load point. After this step, it is investment's turn in critical load point. This process will continue to the end,
ΙV. NUMERICAL STUDIES
In this section, the proposed theories regarding the load growth behavior in distribution system for development program has been studied numerically using Matlab software. For this purpose, a single branch radial distribution system is considered according to Fig.1 which has been extracted from [3]. The system characteristics are as follows:
1) The system has 9 bus bars.
2) Failure rate of load points equals to 6.5 f/km-yr which is in accordance with system topology. Outage time of the
first, second…, last load point equals to 1, 5, 9, 13, 18, 23, 25, 30, 40 hours respectively. For better understanding of the research, the amounts considered for outage time are a bit more than real amounts.
3) The average consumption power for any customer of 50 Watts and the number of customers of load growth (ΔL)
equals to 12 customers with 600 Watts consumption power.
4) In the system of Fig.1, since there is one circuit breaker which is located at the beginning of feeder, for each error in
the system all load points face outage, and failure rate in all load points are equal. Regarding this and according to relations 7, 8, and 9 it can be said that critical load point in this system is located in load point which has the most outage time. As it is obvious, in this system the last location has the most outage time and so this load point is the critical load point. This principle does not depend on load arrangement, failure rate, repairing time, etc in this system. To investigate the same in accompanying the main subject, six different load distributions are considered for the distribution system of Fig.1 according to Fig.4. In all arrangements shown in Fig.2, the total number of customers is 603. Table.1 shows the number of customers in each load distribution.
Fig. 4 Six different distribution load for distribution system of Fig.1 [3] Table. 1 The number of customers in each load point for load distribution in Fig.3 [3]
0 20 40 60 80 100 120
140 1Load Point
Load Point
2
Load Point
3
Load Point
4
Load Point
5
Load Point
6
Load Point
7
Load Point
8
Load Point
First sensitivity amounts in each load distribution are calculated without considering development. Table.2 shows the amounts obtained from this analysis.
Table. 2 Sensitivity amount in each distribution load without development in the system 0.0456
Load Distribution 1
0.0850 Load Distribution 2
0.0639 Load Distribution 3
0.0468 Load Distribution 4
0.0275 Load Distribution 5
0.0259 Load Distribution 6
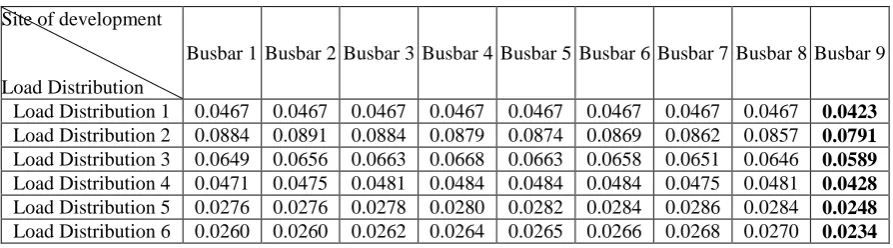
Now, outage time of load points, each are reduced as 2 hours and then the sensitivity amounts in each load distribution are obtained. Note that outage time reduction in each time is only done for a load point. These amounts are shown in Table.3.
As it is obvious from the last columns of Table.3, in each load distribution, outage time reduction of the last load point causes system sensitivity reduction than to load growth (compared to the amounts in Table.2). In the case of all other load points, as it can be seen outage time reduction leads to system sensitivity increase than to load growth and in each
load distribution, the load points having less Ni and Ei, outage time reduction causes less change in sensitivity amount
than to the time there is no development in the system (Table.2).
Table. 3 Sensitivity amount after reducing load points intrruption time
Busbar 9 Busbar 8 Busbar 7 Busbar 6 Busbar 5 Busbar 4 Busbar 3 Busbar 2 Busbar 1 Site of development
Load Distribution 0.0423 0.0467 0.0467 0.0467 0.0467 0.0467 0.0467 0.0467 0.0467 Load Distribution 1
0.0791 0.0857 0.0862 0.0869 0.0874 0.0879 0.0884 0.0891 0.0884 Load Distribution 2
0.0589 0.0646 0.0651 0.0658 0.0663 0.0668 0.0663 0.0656 0.0649 Load Distribution 3
0.0428 0.0481 0.0475 0.0484 0.0484 0.0484 0.0481 0.0475 0.0471 Load Distribution 4
0.0248 0.0284 0.0286 0.0284 0.0282 0.0280 0.0278 0.0276 0.0276 Load Distribution 5
0.0234 0.0270 0.0268 0.0266 0.0265 0.0264 0.0262 0.0260 0.0260 Load Distribution 6
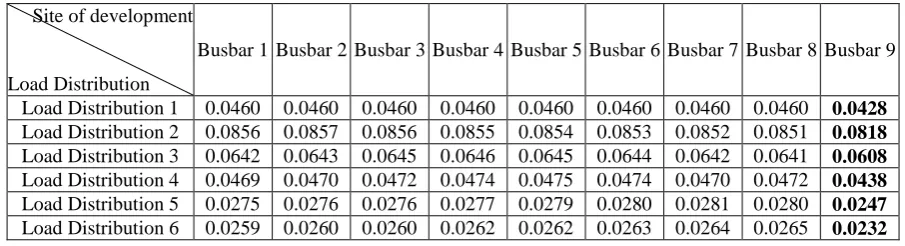
Now the failure rate reduction for load point in different load distribution is investigated. For this purpose, failure rate of load point each is reduced one unit and sensitivity amounts are calculated. Table.4 shows sensitivity amounts in this experiment.
As it is obvious from the last column of Table.4, in each load distribution, failure rate reduction of the last load point which is critical load point leads to system sensitivity reduction than to load growth compared to the time there is no development in the system (Table.2). In case of all other load points, as it can be seen in each load distribution, the load points which has less Ni, its failure rate reduction causes less change in sensitivity amount then than to the time there is no development in the system (Table.2).
Total 9 8 7 6 5 4 3 2 1 Load Point Load Distribution 603 67 67 67 67 67 67 67 67 67
Load Distribution 1
603 15 20 36 57 70 85 100 120 100 Load Distribution 2
603 10 30 50 80 101 121 101 70 40
Load Distribution 3
603 20 80 40 101 121 101 80 40 20
Load Distribution 4
603 80 101 121 101 80 55 35 20 10
Load Distribution 5
603 100 120 100 85 70 57 36 20 15
Note that in simulation, relation 14 or 15 are not simulated anyway. In other words in each state using direct search method, SAIFI, SIADI, the average lost energy indices are calculated and then replacing the results in relation 1 sensitivity amount are obtains and as it was seen, numerical calculation with direct search with quality analysis of non linear relations obtained in this research is matched.
Table. 4 Sensitivity amount after reducing load points failure rate
Busbar 9 Busbar 8 Busbar 7 Busbar 6 Busbar 5 Busbar 4 Busbar 3 Busbar 2 Busbar 1 Site of development
Load Distribution 0.0428 0.0460 0.0460 0.0460 0.0460 0.0460 0.0460 0.0460 0.0460
Load Distribution 1
0.0818 0.0851 0.0852 0.0853 0.0854 0.0855 0.0856 0.0857 0.0856
Load Distribution 2
0.0608 0.0641 0.0642 0.0644 0.0645 0.0646 0.0645 0.0643 0.0642
Load Distribution 3
0.0438 0.0472 0.0470 0.0474 0.0475 0.0474 0.0472 0.0470 0.0469
Load Distribution 4
0.0247 0.0280 0.0281 0.0280 0.0279 0.0277 0.0276 0.0276 0.0275
Load Distribution 5
0.0232 0.0265 0.0264 0.0263 0.0262 0.0262 0.0260 0.0260 0.0259
Load Distribution 6
V. CONCLUSION
All development activities in a distribution system from reliability viewpoint are performed with two goals. The first goal is reducing outage time of load points, and the second one is reducing failure rate of load points. Both goals lead to reliability indices improvement. However another phenomenon comes after system development in the future which occurrence is very probable. This phenomenon is load growth, which regards as a problem from reliability viewpoint. Load growth causes calculation done in a specific time face changes or invalidity in the future. So considering this problem in any time, especially in the development time in system is of importance. All development processes lead to one or more reliability indices improvement. Reliability indices are divided into three categories; energy-based, frequency-based and time-based. By presenting Multiple Index according to (1) one can be sure that any development in the system causes change in this index. On the other hand, for analysis of diversion of this index due to load growth after development, one can use index sensitivity regarding to load growth according to 2 and 3. the aim of this research was that what points of distribution system develop that the system sensitivity after development than to load growth is reduced.
By doing necessary analysis the obtained result was that the system sensitivity for all load growth amounts has a relation like (14) and when the number of customers of load growth is less than 10 percent of total number of feeder customers, it has a relation like (15). Relations (14) and (15) are non-linear relations regarding to ΔL and ΔE.
Sensitivity in (15) which(∆L ≤ %10α), is a second-order relation regarding ΔL and a first-order relation regarding ΔE.
Three-dimensional curve relating (15) is shown in Fig.2. Fig.2 shows that an increase in ΔL leads to increase in sensitivity, and the more is the amount of ΔE, the more is sensitivity increase for a definite increase in ΔL. Three-dimensional curve relating to (14) which is related to all ΔL amounts is shown in Fig.3. Fig.3 shows sensitivity amount is not increased with ΔL increase, and increase in sensitivity amount is stopped at a definite amount of ΔL.
As it is obvious from the last columns of Table.3, in each load distribution, outage time reduction of the last load point causes system sensitivity reduction than to load growth (compared to the amounts in Table.2). In the case of all other load points, as it can be seen outage time reduction leads to system sensitivity increase than to load growth and in each
load distribution, the load points having less Ni and Ei, outage time reduction causes less change in sensitivity amount
than to the time there is no development in the system (Table.2).
Investigating change pace of sensitivity relation than to outage time reduction and failure rate of load points showed that sensitivity derivation than to outage time of critical load point (relation 20) and to failure rate of critical load point (relation 24) is always positive and thus development process in direction of failure rate reduction and outage time of this load point leads to system sensitivity reduction to load growth. In spite of that, according to (17) and (21) which indicate negativeness of sensitivity derivation to outage time and failure rate of non-critical load points, it is concluded failure rate reduction and outage time of critical load points will increase system sensitivity. In the case of non-critical load point it can be said that the less Ni has the load point, investment in failure rate will cause less sensitivity in sensitivity amount. In the case of outage time reduction of non-critical load point can it can be said that load points
which has Ni and Ei, its outage time reduction increase in sensitivity.
With increase of investigation for critical load point, the load point may get out of critical state; thus the investment in load location is done until the give load point will be critical.
REFERENCES
[1] Bie, Zhaohong, Zhang, Peng, Li, Gengfeng, "Reliability Evaluation of Active Distribution Systems Including Microgrids", IEEE Transactions on Power Systems, vol. 27, no. 4, pp. 2342-2350, 2012.
[2] Billinton, R., Allan, R. N., "Reliability Evaluation of Power Systems", 2nd ed., New York, Plenum Press, 1996.
[3] Chaiyabut, N., Damrongkulkamjorn, P. "Impact of customer scattering on distribution system reliability with distributed generation", IEEE Region 10 Conference, pp. 568-573, 2010.
[4] Talaat, H.E.A., Al-Ammar, E., "Optimal allocation and sizing of Distributed Generation in distribution networks using Genetic Algorithms", International Conference on Electrical Power Quality and Utilisation, pp. 1-6, 2011.
[5] Saraisuwan, P., Jirapong, P., Kalankul, A., "Allocation planning tool for determining the optimal location and sizing of distributed generations in provincial electricity authority of Thailand", International Conference on Utility Exhibition on Power and Energy Systems, pp. 1-8, 2011.
[6] Sheidaei, F., Shadkam, M., Zarei, M., "Optimal Distributed Generation allocation in distirbution systems employing ant colony to reduce losses", Universities Power Engineering Conference, pp. 1-5, 2008.
[7] Hung, Duong Quoc, Mithulananthan, N., " Multiple Distributed Generator Placement in Primary Distribution Networks for Loss Reduction", IEEE Transactions on Industrial Electronics, vol. 60, no. 4, pp. 1700-1708, 2011.
[8] Ettehadi, M., Ghasemi, H., Vaez-Zadeh, S., "Voltage Stability-Based DG Placement in Distribution Networks", IEEE Transactions on Power Delivery, vol. 28, no. 1, pp. 171-178, 2012.
[9] Abu-Mouti, F.S., El-Hawary, M.E., "Optimal Distributed Generation Allocation and Sizing in Distribution Systems via Artificial Bee Colony Algorithm", IEEE Transactions on Power Delivery, vol. 26, no. 4, pp. 2090-2101, 2011.
[10] Cui, Hong, "Optimal Allocation of Distributed Generation in Distributed Network”, Power and Energy Engineering Conference, pp. 1-4, 2012. [11] Hedayati, H., Nabaviniaki, S.A., Akbarimajd, A., "A Method for Placement of DG Units in Distribution Networks," IEEE Transactions on , Vol. 23, No. 3, pp. 1620–1628, 2008.
[12] Hussain, I., Roy, A.K., "Optimal distributed generation allocation in distribution systems employing modified artificial bee colony algorithm to reduce losses and improve voltage profile", International Conference on Advances in Engineering, Science and Management, pp. 565-570, 2012. [13] Janjic, A.D., Popovic, Dragan S., "Selective Maintenance Schedule of Distribution Networks Based on Risk Management Approach", IEEE Transactions on Power Systems, vol.22, no.2, pp. 597-604, 2007.
[14] Kuntz, P.A., Christie, R.D., Venkata, Subrahmanyam S., "A reliability centered optimal visual inspection model for distribution feeders", IEEE Transactions on Power Delivery, vol. 16, no.4, pp. 718-723, 2001.
[15] Dehghanian, P., Fotuhi-Firuzabad, M., Aminifar, F., Billinton, R., "A Comprehensive Scheme for Reliability Centered Maintenance in Power Distribution Systems ", IEEE Transactions on Power Delivery, vol. 28, no.2, pp. 761-770, 2013.
[16] Hilber, P. Miranda, V. Matos, M.A. Bertling, L. "Multiobjective Optimization Applied to Maintenance Policy for Electrical Networks",Power Systems, IEEE Transactions on Power Systems, vol. 22, no. 4, pp. 1675-1682, 2007.
[17] Hilber, P., Miranda, V., Matos, M.A., Bertling, L., "Optimal vegetation maintenance scheduling of overhead electric power distribution systems", IEEE Transactions on Power Delivery, vol. 22, no. 4, pp. 1675-1682, 2002.
[18] Phoothong, N., Vanittanakom, P., Teera-achariyakul, N., Rerkpreedapong, D., "Optimal preventive maintenance budget setting for electric power distribution utilities", 5th International Conference on Electrical Engineering/ Electronics, Computer, Telecommunications and Information Technology, vol. 2, pp. 957-960, 2008.
[19] Falaghi, H., Haghifam, M., Singh, C., "Ant Colony Optimization-Based Method for Placement of Sectionalizing Switches in Distribution Networks Using a Fuzzy Multiobjective Approach", IEEE Transactions on Power Delivery, vol. 24, no. 1, pp. 268-276, 2009.
[20] Ghani Varzaneh, M., Dashti, R., Amir, V., " Asset Management Based Distributed Generation Placement from Load Growth Viewpoint", Computational Intelligence in Electrical Engineering, vol. 5, no. 3, pp. 55-68, 2014.
BIOGRAPHY
Reza Dashti was born in Booshehr, Iran. He graduated from Tehran University, in B.Sc course. He recived M.Sc of Electrical Engineering in Tarbiat Modares University (TMU) and PhD of Electrical Engineering in branch of Energy Management from Tehran University.
He has been Manager of Booshehr Electric Distribution Office for few years and now he is Assistant Professor in Department of Electrical Engineering in Iran University of Science and Technology (IUST).
![Fig. 4 Table. 1 Six different distribution load for distribution system of Fig.1 [3] The number of customers in each load point for load distribution in Fig.3 [3]](https://thumb-us.123doks.com/thumbv2/123dok_us/7784822.1287444/11.595.177.426.577.746/table-different-distribution-distribution-number-customers-point-distribution.webp)