On The Role of Supercapacitors towards
Characterization of PV Generators
T. Belel
1, S. Basu Pal
2,
K. Das (Bhattacharya)
3,
D. Mukherjee
4 Department of Electronics Engineering, IIEST, Shibpur, West Bengal, India1Department of Electrical Engineering, IIEST, Shibpur, West Bengal, India2
Department of Electrical Engineering, IIEST, Shibpur, West Bengal, India3
Department of Electronics Engineering, IIEST, Shibpur, West Bengal, India4
ABSTRACT: A very precise and inexpensive method of I-V characterisation is possible by capacitor charging for a PV generator. Application of transient analysis on the circuit permits determination of characterization times for various capacitor sizes. Following the above trend, authors of this paper uses various sizes of supercapacitor instead of capacitor as load to PV cell and modules. This ensures smother characterization without noise and also accurate control over the characterization time. Based on a piecewise linear break-up of PV characteristic, authors have derived a much more accurate method of characterization time involving the four basic electrical parameters defining a PV curve. Experimental validation indicates excellent agreement with actual curve plotting time.
KEYWORDS: I-V characterisation, PV Generator, Data Acquisition System, Supercapacitors.
I.INTRODUCTION
Several Methods to plot the I-V characteristics of a PV cell/module automatically have been published [1-5]. Such plots alone can be analysed to estimate the essential electrical PV parameters of interest [5].Since the deployment of large size PV arrays have currently invaded the urban scenario, the role of on-line, simple and inexpensive I-V curve tracers is expanding outside the academic laboratories also. Simple analog approaches [1] face several obvious constraints such as (a) Need of extrapolation in the plotting, leading to inaccurate estimate of shunt(Rsh) and series(Rs)resistances (b) Possibility of a thermal influence on the curve in case of longer periods of characterization. Hardware independent tool kits [4] perform forward bias I-V characterization using Lab-VIEW software depending on prior acquired data and are hence useless for real time applications. One high-end set-up designed and commissioned by the solar Laboratory of the Wroclaw University of Technology, Poland uses class A solar simulator [5]and meets all requirements of IEC-60904-3 and 60904-9 standards. But such a set-up is too sophisticated to suit the needs of an on-line characterisation in PV labs and workshops. PV performance models like solar Advisor Model Simulation Software used for commercial purposes are too sumptuous to be used in academic laboratories and testing levels. A recent effort by S.K. Ghosh et.al [6] has employed an Arduino Integrated development board (IDE) through serial bus and PLX-DAQ software for automatic and fast plotting. But the yielded characteristics are too noisy in nature to be used for parametric evaluation. Of late, there is an effort by Marwan.M.Mahmoud et al [7] enabling the selection of correct value of a capacitor as the load to a PV cell/module. In view of the above backdrop, the authors, in this proposition, uses a small supercapacitor bank with an Agilent Data Acquisition System (34970A) to control the characterization time and noisy co-ordinates. Next section is devoted to a step by step survey of V-I characterization using various types of load components. This is essential for an appreciation of the present methodology practiced by the authors.
II. RELATED WORKS FOR V-I CHARACTERIZATION
II.I. Using a variable resistor:
The V-I characteristics of a solar cell/module/array can be traced simply and inexpensively by using a variable resistive load (𝑅𝐿) as shown in figure1.Here 𝑅𝐿 is varied from 0 to infinity to trace the curve starting from short circuit point to
Figure 1: Arrangement for V-I Characterization of a solar cell/ module by variable resistance method.(A- Ammeter, V-Voltmeter)
II.II Using Capacitor as the load:
In this method the variable resistor has been replaced by a capacitive load. The capacitor voltage is automatically swept from zero to open circuit voltage by drawing current from the PV generator in a very short amount of time. In the process, respective voltage and current values are recorded by a data recorder or a computerized data acquisition system (CDAS). The required I–V curve obtained by this method is much more accurate and also it overcomes the drawbacks of the first method. However for the curve tracing of high power PV generators, it requires highly sensitive DAS with a very high scanning speed, which is a costlier proposition.
II.III Using Supercapacitor:
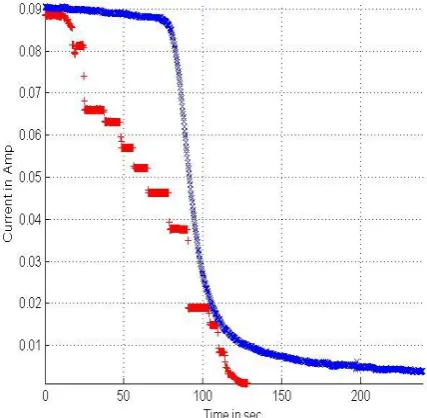
In this technique, tracing the I-V curve of a photovoltaic cell/module has been done using the Supercapacitors for the first time. Although Supercapacitor calls for a moderate scanning speed, a reduced device complexity than the capacitor method in conjunction with a compatible Data Acquisition System (DAS), a reasonably low curve tracing time have inspired the authors to replicate their proposition with large number & variety of PV cells and modules. The supremacy of this method over resistive method can be observed in figure 2 and figure 3. It can be seen that data points are discontinuous in resistive method, leading to incorrect determination of maximum power point.
III. SIMPLE PHYSICS BEHIND SUPERCAPACITOR METHOD
Tracing V-I curve of a Photo-Voltaic (PV) cell, module or array from the transient analysis of charging a capacitor has been already established [7]. The Supercapacitor method for tracing V-I curve also works on the same principle. Consider the circuit arrangement in figure 4.
Figure 4: PV generator connected with a supercapacitor
A PV cell/ module give a fixed current at a fixed voltage for a particular light intensity and stable environmental conditions. With increasing voltage from zero to open circuit voltage (𝑉𝑜𝑐) derived current is almost constant initially
and equal to short circuit current (𝐼𝑠𝑐).Then it starts to decrease and comes to zero at V=𝑉𝑜𝑐. A discharged
Supercapacitor connected across a PV cell, module or array terminal applies zero voltage at the terminal and due to its negligible Equivalent Series Resistance (ESR) draws a current equal to 𝐼𝑠𝑐at the beginning of charging by the PV
generator. With drawing current and accumulating charge the terminal voltage of Supercapacitor increases and following the I-V characteristic of the PV generator, the current drawn is being decreased.
IV. ANALYSIS OF THE CURVE TRACING TIME USING SUPERCAPACITOR METHOD
Previously Marwan M.Mahmoud have given a simple expression of curve tracing time, involving Isc and Voc terms only [7].Although a curve nature can vary in different ways between short circuit point and open circuit point and so does the curve tracing time, the authors have approximated the V-I curve with piecewise linear approach for deriving a more appropriate expression for the curve plotting time.
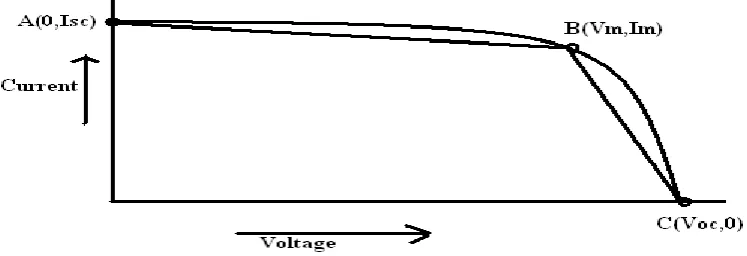
Fig 5: piecewise linear break-up of PV characteristic
The above Figure 5 represents basic V-I characteristic of a solar cell/module. Here A(0,Isc) denotes short circuit point, B(Vm,Im) denotes maximum power point, C(Voc,0) denotes open circuit point.
Short circuit point A(0, Isc ) to peak power point(Vm, Im) is approximated by the straight line-
𝑖 = 𝐼𝑠𝑐 −𝐼𝑠𝑐 −𝐼𝑚
𝑖 = 𝐼𝑚 .𝑉𝑜𝑐
𝑉𝑜𝑐 −𝑉𝑚− 𝐼𝑚
𝑉𝑜𝑐 −𝑉𝑚𝑉 --- (2)
For the supercapacitor,
𝑉 =
𝑄𝐶 [Q: charge, C: capacitance, V: voltage]
𝑑𝑣𝑑𝑡
=
𝑖 𝐶Or, 𝑑𝑡 =𝐶
𝑖𝑑𝑣
Hence, 𝑑𝑡 = 𝐶 0𝑇 0𝑉𝑜𝑐𝑑𝑣𝑖 [T : curve tracing time ]
Therefore, 𝑇 = 𝐶 𝑑𝑣 𝐼𝑠𝑐 −𝐼𝑠𝑐 −𝐼𝑚 𝑉𝑚 𝑉 + 𝐶 𝐼𝑚 .𝑉𝑜𝑐𝑑𝑣 𝑉𝑜𝑐 −𝑉𝑚– 𝐼𝑚 .𝑉 𝑉𝑜𝑐 −𝑉𝑚 𝑉𝑜𝑐 𝑉𝑚 𝑉𝑚
0 …(3) [Using equation 1 and
equation 2]
= − 𝐶.𝑉𝑚
𝐼𝑠𝑐 −𝐼𝑚[ln 𝐼𝑠𝑐 − 𝐼𝑠𝑐 −𝐼𝑚
𝑉𝑚 𝑉 ] 𝑉𝑚
0
−
𝐶(𝑉𝑜𝑐 −𝑉𝑚 ) 𝐼𝑚 [ln( 𝐼𝑚 .𝑉𝑜𝑐 𝑉𝑜𝑐 −𝑉𝑚− 𝐼𝑚 .𝑉 𝑉𝑜𝑐 −𝑉𝑚)] 𝑉𝑜𝑐 𝑉𝑚 = 𝐶. 𝑉𝑚 𝐼𝑠𝑐 − 𝐼𝑚ln(
𝐼𝑠𝑐 𝐼𝑚) −
𝐶(𝑉𝑜𝑐 − 𝑉𝑚)
𝐼𝑚 [ln 0 − ln(𝐼𝑚)]
=∞ --- (4)
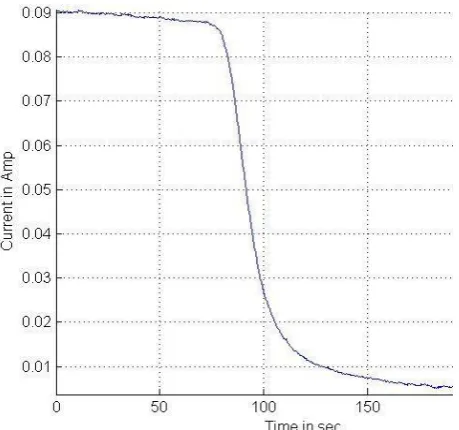
This equation signifies that Supercapacitor voltage cannot reach the exact Voc point. It can be intuitively verified from figure 6 and figure 7, the charging characteristic of supercapacitor directly fed by a solar cell or module. Here we can see that both voltage change and current change with respect to time have been slowing down at the end .So it will take infinite time to reach their optimum.
But in practice it can reach more than 99% of the open circuit voltage which is fair enough for precision curve tracing. Say, Supercapacitor voltage reaches K% of the open circuit voltage. Hence, changing the limits in equation 3, we get-
𝑇 = 𝐶 𝑑𝑣
𝐼𝑠𝑐 −𝐼𝑠𝑐 − 𝐼𝑚𝑉𝑚 . 𝑉
𝑉𝑚
0
+ 𝐶 𝐼𝑚. 𝑉𝑜𝑐 𝑑𝑣
𝑉𝑜𝑐 − 𝑉𝑚−
𝐼𝑚. 𝑉 𝑉𝑜𝑐 − 𝑉𝑚
𝐾𝑉𝑜𝑐 /100
𝑉𝑚
= − 𝑉𝑚
𝐼𝑠𝑐 − 𝐼𝑚 ln(𝐼𝑠𝑐 −
𝐼𝑠𝑐 − 𝐼𝑚 𝑉𝑚 . 𝑉)
𝑉𝑚 0 −
𝐶(𝑉𝑜𝑐 − 𝑉𝑚)
𝐼𝑚 ln(
𝐼𝑚. 𝑉𝑜𝑐 𝑉𝑜𝑐 − 𝑉𝑚−
𝐼𝑚. 𝑉 𝑉𝑜𝑐 − 𝑉𝑚)
𝐾𝑉𝑜𝑐/100 𝑉𝑚
Hence,
𝑇 =
𝐶.𝑉𝑚𝐼𝑠𝑐−𝐼𝑚
ln(
𝐼𝑠𝑐 𝐼𝑚) +
𝐶(𝑉𝑜𝑐 −𝑉𝑚 ) 𝐼𝑚
ln
100 𝑉𝑜𝑐 −𝑉𝑚
100−𝐾 𝑉𝑜𝑐
…(5)
V. EXPERIMENTAL SETUP
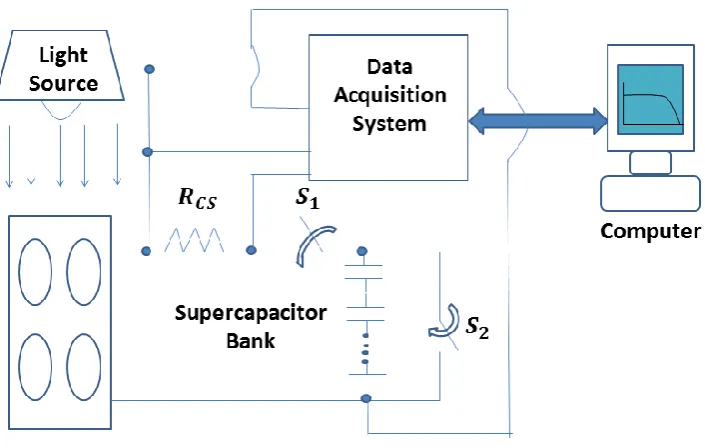
The experimental arrangement consists of PV cell or module, Supercapacitor bank, DAS, computer, variable intensity light source, current sensing resistor (𝑅𝑐𝑠) and two switches (figure 2). The DAS connected to the computer is
configured and controlled by a Graphical User Interface (GUI). DAS collects current information in terms of scaled voltage across 𝑅𝑐𝑠. Switch 𝑆1 is opened and 𝑆2 is closed before beginning the experiment to discharge the
Supercapacitor Bank. Then𝑆2 is opened and 𝑆1 is closed at the starting of the experiment. DAS records the voltage and
current values and sends to the computer where it is stored in an Excel file. A simple MATLAB program accesses these data from the Excel file to plot the desired V-I curve.
Figure 8: Experimental Setup
VI. RESULTS
V-I plots comparing Supercapacitor method against variable resistor method are shown in figure 9 at an insolation o 500W/𝑚2.
Figure 9: V-I Characteristic of a solar module at 500 watt/𝑚2
A set of identical values of supercapacitors are employed to verify the closeness of the two methods of characterization at a higher intensity of 700 watt/𝑚2also.
Figure 10: V-I Characteristic of a solar module at 700 watt/𝑚2
These figures indicate that V-I curve tracing can be done more smoothly and accurately by using Supercapacitor than the variable resistor.
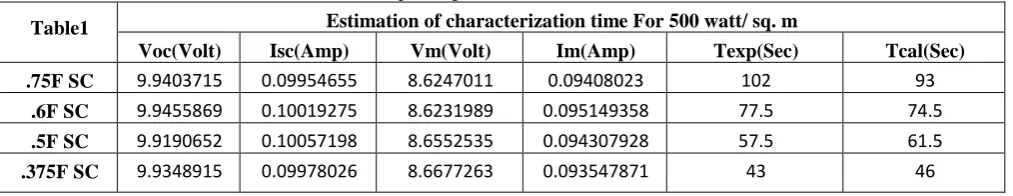
The following Table 1 shows basic module parameters at an insolation of 500 watt/𝑚2 and estimate of curve tracing
time following equation 5.
Table I: Estimation of plotting time at an insolation of 500 watt/𝑚2
Table1 Estimation of characterization time For 500 watt/ sq. m
Voc(Volt) Isc(Amp) Vm(Volt) Im(Amp) Texp(Sec) Tcal(Sec) .75F SC 9.9403715 0.09954655 8.6247011 0.09408023 102 93
.6F SC 9.9455869 0.10019275 8.6231989 0.095149358 77.5 74.5
.5F SC 9.9190652 0.10057198 8.6552535 0.094307928 57.5 61.5
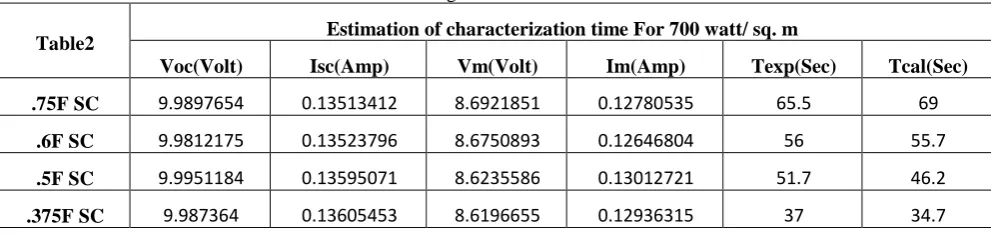
Similarly, Table II has been drawn up at an insolation of 700 watt/𝑚2 using a set of identical values of supercapacitors.
Table II: Estimation Of Plotting Time at an insolation of 700 watt/𝑚2
Table2 Estimation of characterization time For 700 watt/ sq. m
Voc(Volt) Isc(Amp) Vm(Volt) Im(Amp) Texp(Sec) Tcal(Sec)
.75F SC 9.9897654 0.13513412 8.6921851 0.12780535 65.5 69
.6F SC 9.9812175 0.13523796 8.6750893 0.12646804 56 55.7
.5F SC 9.9951184 0.13595071 8.6235586 0.13012721 51.7 46.2
.375F SC 9.987364 0.13605453 8.6196655 0.12936315 37 34.7
Here we have taken K=99 so that the curve tracing time reaches 99% of Voc. We can see here calculated value of curve tracing time closely matches with the experimental value.
VII.CONCLUSION
Equation derived through the piecewise linear approximation of a PV characteristic curve can be used to predict and control the curve tracing time by selecting suitable value of supercapacitors. The combination of supercapacitor and DAS could be a better choice for characterization of high power PV generator than the combination of capacitor and DAS, as in the former DAS is more cost effective and less complex in terms of moderate scanning speed and sensitivity than the later. Such an online method is extremely user friendly and can be adopted by existing PV manufacturing industries and testing laboratories for accurate online testing of PV cells and modules.
REFERENCES
[1] P. Hernday, “Field Applications for I-V Curve Tracers”, SolarPro[Online], pp.77-106, Aug./Sep 2011. Available:http://resources.solmetric.com/get/SolarPro-FieldApplicationsOf-I-V-Curve-Tracers-Hernday.pdf
[2] D. Mukherjee and S. Chakrabarti, “Fundamentals of Renewable Energy Systems”, 1st ed. New Delhi, India: New Age International (P) Ltd., June. 2004.
[3] G. Bhattacharya and H. Saha, “Simple automatic current/voltage characteristics plotter for solar cells and arrays,” IEE Proc. G, Electronic Circuits and Systems, vol. 133, no. 6,pp. 289-294, Dec. 1986.
[4] National Instruments Corp. “Part II–Photovoltaic Cell I-V Characterization Theory and LabVIEW Analysis Code”,Texas. USA. [Online]. , May, 2012. Available: http://www.ni.com/white-paper/7230/en
[5] F. Granck and T. Zdanwich, “Advanced System for characterisation and Calibration of Solar Cells,” Opto-Electronics Review, vol. 12, no. 1, pp. 57-67, 2004.
[6] S.k.Ghosh, K.Ghosh,D.Ghosh, T.Sarkar,D.Mukherjee, “A simple and Low Cost Automatic I-V Plotter for PV Modules,” Proceedings of International Solar Energy Conference,London,2012.
[7] M. M. Mahmoud, “Transient analysis of a PV power generator charging a capacitor for measurement of the I-V characteristics,” Renewable Energy, vol. 31, pp. 2198–2206, 2006.
ACKNOWLEDGEMENT