DOI: 10.15662/ijareeie.2014.0307053
Performance Evaluation of Biorthogonal
Wavelet Transform, DCT & PCA Based Image
Fusion Techniques
Savroop Kaur1 , Hartej Singh Dadhwal2
PG Student[M.Tech], Dept. of E.C.E, Global Institute of Management and Emerging Technology, Amritsar, Punjab, India1
Assistant Professor, Dept of E.C.E, Global Institute of Management and Emerging Technology, Amritsar, Punjab, India2
ABSTRACT: Image fusion is a technique which is used to fuse two or more images into a single image. It is one of the
most significant technique in digital image processing. There are number of techniques present today which are used to fuse images. The objective of these techniques is to fuse the images together to produce a more elucidative image. Out of all the techniques used the more valuable techniques are DCT and BWT. These two techniques are time saving in real-time classification. The main objective are this paper is to find the best digital image fusion algorithm among DCT, PCA and BWT.
KEYWORDS: Image fusion, BWT, multi-focus, multi-resolution, registration
I. INTRODUCTION
Image fusion is one of the important embranchments of data fusion. Its purpose is to synthesis multi-image information in one scene to one image which is more suitable to human vision and computer vision. Multiple images can be taken by the use of Visual Sensor Networks (VSN). It is a term used in literature to refer to a system with large number of cameras, geographically spread resources and many monitoring points. In VSN, sensors are cameras which can record either still images or video sequences. Therefore, the processing of output information is related to image processing and machine vision subjects.
In a visual sensor network a large number of camera nodes form a distributed system, where the camera nodes are able to process image data locally and to extract relevant information, to collaborate with other cameras on the application-specific task, and to provide the system’s user with information-rich descriptions of captured events. Image fusion is a process of combining multiple source images into a smaller set of images, usually one single image[1]. This single image generated is more accurate and has more information. Image fusion using DCT is easy and time saving in real time systems. In general most of the spatial domain techniques are complex and time consuming which are hard to be performed on real-time applications. But when the source images are coded in JPEG format then the fusion approaches which are applied in DCT domain will be very efficient. Principal component analysis is a mathematical tool which transforms a number of correlated variables into a several uncorrelated variables. PCA is widely used in image classification. The weights for each source image are obtained from the normalized Eigen vector of the covariance matrices of each source image.
II. IMAGE FUSION TECHNIQUES
DOI: 10.15662/ijareeie.2014.0307053 A. PRINCIPAL COMPONENT ANALYSIS
Principal component analysis (PCA) is used to reduce dimensionality. It is a vector space transform. PCA involves ways for identifying and to show patterns in data, in such a way as to highlight their similarities and differences, and thus reduce dimension without loss of data[2]. This method first extracts the column vectors from respective input image matrices. The covariance matrix is calculated. Diagonal elements of covariance vector will contain variance of each column vector. The vector of covariance matrix and eigen values are calculated. Normalize column vector corresponding to larger Eigen value by dividing each element with mean of Eigen vector. Those normalized Eigen vector values act as the weight values and are multiplied with each pixel of input image. Sum of the two scaled matrices are calculated and it will be the fused image matrix[3].
Let X is a d-dimensional random vector. This X has a zero empirical mean. V is the Projection Vector such that Y=VTX. Covariance of Y(cov(Y)) is diagonal.
V inverse is equivalent to its transpose(V-1=VT). Therefore by applying matrix algebra: ( ) = { } (1) ( ) = {( )( ) } (2)
( ) = {( )( )} (3)
( ) = ( ) (4)
MuItiply both sides of equation (4) by V. The following will be obtained
( ) = ( ) = ( ) (5)
Substitute equation (4) into the equation (5). We obtain:
[ , … … … . ] = [ ( ) , ( ) , … … … . ( ) ] (6)
The following can thus be drawn from the above equations:
= ( ) (7)
where, i =1, 2, ... , d and Vi is an eigenvector of cov(X).
Normalized components P1 and P2 are calculated from the obtained eigenvector value. The fused image is computed by
equation:
( , ) = ( , ) + ( , ),y) (8)
The covariance matrix C of X i.e. C=XXT mean of expectation = cov(X). Then calculate the vectors V and eigen-value D of C and sort them by decreasing eigen-eigen-value. Both V and D are of dimension 2 x 2. Consider the first column of V which corresponds to larger eigen-value to compute P1 and P2 as :
= ( )
∑ (9)
= ( )
∑ (10)
B. DISCRETE COSINE TRANSFORM
Discrete cosine transform (DCT) is a very important transform in image processing Large DCT coefficients are concentrated in the low frequency region; hence, it is known to have excellent energy compactness properties and edges may contribute high frequency coefficients[4].
The 2-D cosine transform of an image block f(x,y) of size N x N is given by equations:
DOI: 10.15662/ijareeie.2014.0307053 where u, v = 0,1,....,N-1 and
( ) = √ , = 0
1, ≠0 (12)
The inverse transform can be defined as:
( , ) = ∑ ∑ ( ) ( ) ( , ) cos ( ) cos ( ) (13)
where x, y = 0,1, …, N-1. Here F(0,0) is the DC coefficient and it corresponds to the mean value of that image block. The remaining coefficients are AC coefficients.
The key step is to fuse the DCT representations of multi-focus images into a single fused image. The input images are divided into blocks of size 8x8 and the DCT coefficients of each block is computed. Then the fusion rule is applied.
C. BIORTHOGONAL WAVELET TRANSFORM
The most common form of transform type image fusion algorithms is the wavelet fusion algorithm due to its simplicity and its ability to preserve the time and frequency details of the images to be fused [5][6]. In common with all transform-domain fusion techniques, the transformed images are combined in the wavelet domain using a predefined fusion rule, then transformed back to the spatial domain to give the resulting fused image. Wavelet transform fusion is more formally defined by considering the wavelet transforms w of the two registered input images I1 (x, y) and I2 (x, y) together with the
fusion rule µ . Then, the inverse wavelet transform w-1 is computed, and the fused image I (x, y) is reconstructed:
I (x,y) = w-1 (µ ( w ( I1 (x,y) ), w( I2 (x,y) ) ) ) (14)
DOI: 10.15662/ijareeie.2014.0307053 more images which are registered. Principal component analysis (PCA)[8] is a well-known scheme for feature extraction and dimension reduction and is used for vision fusion. PCA is a mathematical tool which transforms a number of correlated variables into a several uncorrelated variables. The author has proposed the image fusion algorithm combining pyramid and PCA technique. Qualitative and quantitative analysis of these fused algorithms were carried out. Experts opined that multimodal fused image using hierarchical PCA algorithm is more informative than fused image using individual pyramid or PCA algorithm. Albuquerque et al. has discussed that vision focus is a property closely related to vision quality. In some images it is not possible to get a clear focus in a all regions simultaneously, so an alternative is to use picture fusion to merge images with different focus into one with all the best focused regions. There are two vision fusion algorithms in the frequency domain that are based on focus- DCT and spatial frequency. The algorithms divide the picture into fixed size of blocks to decide which picture should be selected to constitute the final result. Prakash et al. has proposed a pixel-level image fusion scheme using multiresolution Biorthogonal wavelet transform (BWT). Wavelet coefficients at different decomposion levels are fused using absolute maximum fusion rule. Two important properties wavelet symmetry and linear phase of BWT[9][10] have been exploited for image fusion because they are capable to preserve edge information and hence reducing the distortions in the fused image. The performance of the proposed method have been extensively tested on several pairs of multifocus and multimodal images both free from any noise and in presence of additive white Gaussian noise and compared visually and quantitatively against existing spatial domain techniques. Experimental results have shown that the proposed method has improved fusion quality by reducing loss of significant information available in individual images.
III. GAPS IN LITERATURE
By conducting the review it has been found that the most of the existing literature has neglected at least one of the following:
It may results in some color artifacts which may reduce the performance of the transform based vision fusion techniques.
It is also found that the problem of the uneven illuminate has also been neglected in the most of existing work on fusion.
The use of the filtering has also been neglected to reduce the noise which may be in the output image due to transform domain techniques or during capturing time.
IV. EXPERIMENTAL SETUP & RESULTS
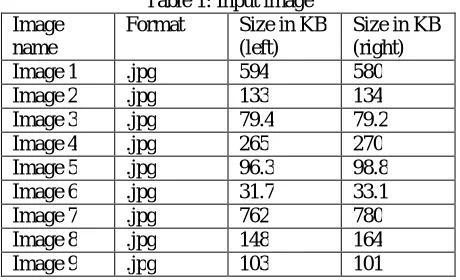
In order to implement PCA, DCT and BWT, design and implementation is done in MATLAB using image processing toolbox. Table 1 has shown the various images that has been taken in this research work for experimental purpose.
Table 1: Input image Image
name
Format Size in KB (left)
Size in KB (right)
Image 1 .jpg 594 580
Image 2 .jpg 133 134
Image 3 .jpg 79.4 79.2
Image 4 .jpg 265 270
Image 5 .jpg 96.3 98.8 Image 6 .jpg 31.7 33.1
Image 7 .jpg 762 780
Image 8 .jpg 148 164
DOI: 10.15662/ijareeie.2014.0307053
Image 10 .jpg 226 228
Image 11 .jpg 22.7 2 9
Figure 1 has shown the input images for experimental analysis. Figure (a) is showing the left blurred image and figure. 2 (b) is showing the right blurred image. The overall objective is to combine relevant information from multiple images into a single image that is more informative and suitable for both visual perception and further computer processing.
Figure 1(a): Left blurred image
Figure 1(b): Right blurred image
DOI: 10.15662/ijareeie.2014.0307053 Figure 2 has shown the output image taken by BWT. The output image preserves the brightness of original blurred images to be fused but color is imbalanced which have degraded the quality of the image.
Figure 3: DCT based image fusion
Figure 3 has shown the output image taken by DCT. The output image has contained too much brightness and color imbalance as compare to original blurred images to be fused.
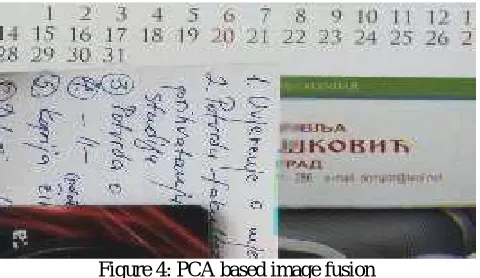
Figure 4: PCA based image fusion
Figure 4 has shown the output image taken by PCA. The output image has contained low brightness and low contrast as compare to original blurred images to be fused which have degraded the quality of the image.
V. PERFORMANCE ANALYSIS
This section contains the comparative analysis between DCT, PCA and BWT based images fusion. Different image fusion metrics has been considered to find the best algorithm among the available algorithms.
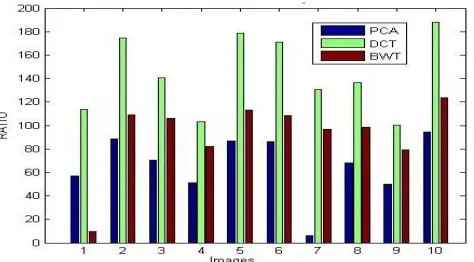
Table 2 and figure 5 has the comparative analysis of API between three techniques. It has been clearly shown that among the available techniques DCT based fusion shows more significant results over the PCA and BWT.
Table 2: Average Picture Intensity (API) evaluation
Image no. PCA DCT BWT
DOI: 10.15662/ijareeie.2014.0307053 4 51.3868 103.4071 82.1095
5 86.8430 178.5145 113.3196 6 86.1045 171.1477 108.5288 7 6.5020 130.6058 96.5285 8 68.3417 136.3395 98.3792 9 50.1928 100.0663 79.4076 10 94.1558 187.8278 123.7016
Table 3 and figure 6 has the comparative analysis of standard deviation between three techniques. It has been clearly shown that among the available techniques DCT based fusion shows more significant results over the PCA and BWT as in all cases the standard deviation of DCT based technique is more than other techniques.
Figure 5: Average Picture Intensity (API) evaluation
Table 3: Standard deviation evaluation
Image no. PCA DCT BWT
DOI: 10.15662/ijareeie.2014.0307053
Figure 6: Standard deviation evaluation
Table 4 and figure 7 has the comparative analysis of Fusion Factor between three techniques. It has been clearly shown that among the available techniques DCT based fusion shows more significant results over the PCA and BWT as in all cases the Fusion Factor of DCT based technique is more than other techniques.
Table 4: Fusion Factor
Image no. PCA DCT BWT
1 1.5591 4.6949 1.4113
2 5.1 18.5006 6
3 2.1185 9.682 1.8930
4 2.4457 6.7824 2.9219
5 2.6098 8.5621 1.6077
6 4.0888 12.9084 2.8628
7 1.6705 4.6997 1.3512
8 1.9844 9.197 1.8832
9 3.4409 10.3538 4.0046
10 2.6180s 8.6374 1.0923
Figure 7: Fusion Factor
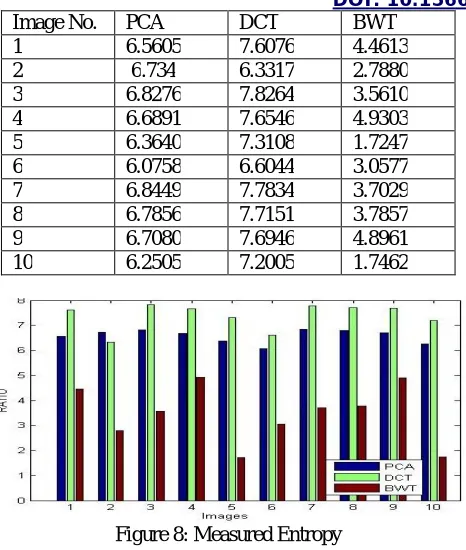
Table 5 and figure 8 has the comparative analysis of Measured Entropy between three techniques. It has been clearly shown that among the available techniques DCT based fusion shows more significant results over the PCA and BWT as in all cases the Measured Entropy of DCT based technique is more than other techniques.
DOI: 10.15662/ijareeie.2014.0307053
Image No. PCA DCT BWT
1 6.5605 7.6076 4.4613
2 6.734 6.3317 2.7880
3 6.8276 7.8264 3.5610
4 6.6891 7.6546 4.9303
5 6.3640 7.3108 1.7247
6 6.0758 6.6044 3.0577
7 6.8449 7.7834 3.7029
8 6.7856 7.7151 3.7857
9 6.7080 7.6946 4.8961
10 6.2505 7.2005 1.7462
Figure 8: Measured Entropy
VI. CONCLUSION & FUTURE WORK
Out of various image fusion methods known today,DCT is considered to be more appropriate and time-saving in real-time systems among DCT, PCA and BWT. In this paper performance evaluation based on DCT,PCA and BWT image fusion techniques. The comparative analysis has shown the DCT based image fusion has significant results over the available algorithms i.e. BWT and PCA. In near future this work can be extended to use guided filters to enhance the BWT base fusion in more efficient manner.
REFERENCES
[1]. O. Perez, M. A. Patricio. J. Garcia, J. Carbo, and J. M. Molina,“Fusion of Surveillance Information for Visual Sensor Networks,” Proceedings of the IEEE Ninth International Conference on Information Fusion.
[2]. Anima Mishra and Subrata Rakshit. Fusion of noisy multi-sensor imagerys. Defense Science Journal, 58:136–146, 2008.
[3]. Wang Zhong-hua, Qin Zheng, and Liu Yu. A framework of region based dynamic image fusion. Journal of Zhejiang University ISSN 1009-3095, pages 56–62, August 2007.
[4]. Mohammad Bagher Akbari Haghighat, Ali Aghagolzadeh, and Haldi Seyedarabi, “Real-Time Fusion of Multi-Focus Images for Visual Sensor Networks”,IEEE 2010.
[5]. H. H. Wang, “A new multiwavelet-based approach to image fusion”,Journal of Mathematical Imaging and Vision, vol.21, pp.177-192, 2004. [6]. R. Singh, R. Srivastava, O. Prakash and A. Khare, "DTCWT based multimodal medical image fusion", in proc. of International conference on
Signal, Image and Video processing, January 2012, pp. 403-407, IIT Patna.
[7]. J. Tang, “A contrast based image fusion technique in the DCT domain,”Digital Signal Processing, vol. 14,no. 3, pp. 218 – 226, 2004.
[8]. P J. Burt and E H. Adelson. The laplacian pyramid as a compact image alignment by maximization of mutual information. Proc. of the 5th
International Conference on Computer vision, 31:1–5, 2008.
[9]. G. Piella, “A general framework for multiresolution image fusion: from pixels to regions, Information Fusion,” Vol. 4, No. 4, pp. 259-280, 2003.