Analysis of AGC and AVR for Single Area
and Double Area Power System Using Fuzzy
Logic Control
Vivek Nath1, D.K Sambariya2
PG Student [Power System] Dept. of Electrical Engineering, Rajasthan Technical University, Kota, India1
Associate Professor, Dept. of Electrical Engineering, Rajasthan Technical University, Kota, India2
ABSTRACT: In this paper the study of AGC and AVR taken together. In the power system it is require maintaining the frequency and voltage in a tolerable limit. but due to sudden load variation it is difficult to maintain them in a prescribe limit; so it is necessary to take some control action for this automatic generation control for frequency and automatic voltage regulator for voltage is used. The AGC is used for balancing system generation against system load and losses. Further the role of the AVR is used to maintain terminal voltage of the synchronous generator in order to keep the bus bar voltage in a tolerable limit. By using MATLAB software of version R2010a, the analysis of frequency
deviation and voltage variation with time is done for a single area system. By using the controller it can be seen that the deviation of frequency response and voltage is minimized. In this paper the comparison of a conventional controller like PI, PID is done with fuzzy logic controller, and we find that fuzzy controller is better than the conventional controller.
KEYWORDS: Automatic Voltage Regulator (AVR), Automatic Generation Control (AGC), Fuzzy logic – Integral-Derivative controller (FPID), Integral-Derivative controller (PID), Proportional-Integral controller (PI), Automatic Control Error (ACE).
I.INTRODUCTION
II. AUTOMATIC GENERATION CONTROL
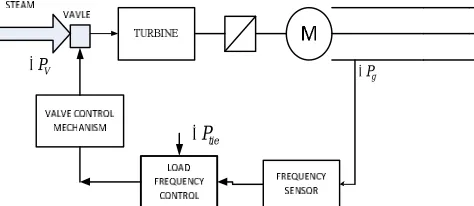
If the load on the system is increased then, there is a drop in frequency because the governor speed goes down, for adjusting the speed to a set point it is required to increase the speed of a governor. As the speed change diminishes; the error signal becomes smaller, and the governor speed is made constant. However, it is impossible to fix the governor speed to a set point because the load is varying with time; therefore, we use a control system with an integrator. The control mechanism analyses the change and make corrections accordingly to remove offsets. The ability of system to come back to its normal value this control action is called reset point. So the AGC is a scheme which restores the frequency to its nominal value automatically [5, 6]. In Fig. 1 the AGC for single area is shown, the AGC consist of a governor system which provides a signal to the turbine to adjust its speed to maintain the frequency constant.
Fig. 1 Block diagram of Automatic load frequency control
A. Modelling of automatic generation control for single area:
The main parts consist as Governor, prime mover load and inertia model; are described as following:
Governor model: the command
P
gis transformed by hydraulic amplifier to the steam valve position
P
V[7]. The Tgis governor time constant, the transfer function of governor is
s T s
P s P
g g
V
1 1 ) (
)
( (1)
Prime mover model: The prime mover is used for producing mechanical power; it may be steam for steam turbine, water wall for hydraulic turbine. The model of prime mover
P
m relates the mechanical power output to change insteam valve value
P
vthe transfer function iss T s
P s P
t v
m
1 1 ) (
)
( (2)
Load and inertia model: The motor load is sensitive to the frequency change; it can be analysis by speed load characteristic.
D H P P
s w
l
m
2 1 )
(
(3)
Frequency bias factor: The frequency biased factor is sum of frequency sensitive load change (D) and speed regulation.
D
R
B
1
(4)By using above Eqn. (1 – 4) the automatic generation block diagram can be formed which is shown Fig. 2.
V P
tie
P
s Tg 1 1 s Tt 1 1 D H 2 1 R 1 B V P
Pm
L
P
w
Fig. 2 Block diagram of Automatic generation control for single area system
B. Modelling of automatic generation control for double area
Let two areas represented by an equivalent generating unit interconnected by a lossless tie line with reactance
X
tie1
X X12 X 2
1 1
E E22
Fig. 3 Network for a two area power system
During the normal operating condition the real power transferred over the tie line is given and shown in Fig. 3.
12 12
2 1
12 sin
X E E
P (5)
Consider a small deviation in a tie line power P12 the equation for this is given as consider for a initial rotor angle
012 12 12 d dP P
(6)
The synchronous power coefficient is given by Eqn. (7).
12 12
2 1
cos
X E E
PS (7)
Consider a load change PL1 in area1at time of steady state the deviation in frequency is consider to be same it means
2
1 w
w
w
. 2 12 2 1 1 2 1 wD P P wD P P P m l m m (8)
The change in mechanical power is determined by using the governor speed characteristic is given as
2 2 1 1 , R w P R w
Pm m
(9)
) ( , 1 2 1 2 12 2 1 1 l l P B B B P B B P
w
(10)
Tie-Line Bias Control: The tie-line bias control is used to maintain frequency and power at a pre-specified value where in each area manages its own load. The conventional LFC is based on the tie line bias control; in which each area is trying to reduce error to zero. The area control error is given by (ACE)
2 2 21 2 1 1 12
1 P B w,ACE P B w
Fig. 4 Block diagram of ALFC for two area power system
III. AUTOMATIC VOLTAGE REGULATOR
AVR is an important part of a synchronous generator. The AVR is used for regulating the terminal voltage of the synchronous generator, whenever, there is a sudden drop in voltage due to accidents, faults or frequent changes in loading. The AVR improves the transient stability of a system. In this paper; the reference voltage is compared with the stepped down transformed and rectified terminal voltage [8]. In Eqn. (12), the error signal is the difference of terminal voltage (
v
ref) and reference voltage (v
t).t
ref
v
v
t
e
(
)
(12) The working of AVR can be understood by Fig.5, the voltage is sensed by the potential transformer of one phase. This voltage is rectified and compare with a DC preset point. The amplified error signal controls the exciter field and increases the exciter terminal voltage. Thus increase in generator field current which increases the generator EMF. Thus reactive power generation is increased which result in the voltage to be increased.R
v vf
e
v
ref
v
P
Q
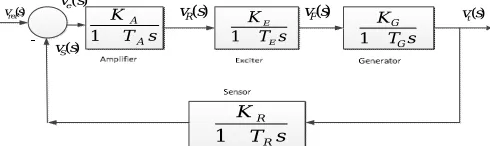
Fig. 5 Block diagram of Automatic voltage regulator
A. Modelling of automatic voltage regulator:
Amplifier model: In the above Fig. 5; it can see amplifier, the amplifier may be magnetic amplifier, rotating amplifier or modern electronic amplifier, and it is denoted by
k
Athe typical range of it is 10 to 400.the amplifier time constant is very small is given by 0.02 to 0.1 sec. the transfer function of amplifier model iss T I K s V s V A A e R ) ( )
( (13)
Exciter model: The transfer function of a exciter is represented by a Exciter time constant
T
E and gain is given byk
A.the time constant of exciter is very small.
s T K s V s V E E R F 1 ) ( )
( (14)
controller controller B2 B1 + -+ -- -+ - -ACE1 ACE2 Load intertia Speed regulation Frequency bias factors Speed regulation Turbine 1 1 R 2 1 R Load interia IN out IN out s Tg1
1 1
1 Tt1s
1 1 1 2 1 D H s Tg2 1
1
1 Tt2s
1
2 1 1
Generator model: The synchronous machine generated EMF is a function of magnetization curve, and its terminal voltage is dependent on generator load.
k
GMay vary between0.7 to 1 andT
G be 1 to 2 seconds from full load to noload. s T K s V s V G G F t 1 ) ( )
( (15)
Sensor model: Sensor sensed voltage through a potential transformer the
T
Rtime constant of sensor is assuming a range from 0.01 to 0.06.s T K s V s V R R t S 1 ) ( )
( (16)
By using the above Eqns. (5 – 8), the block diagram is made shown in Fig. 6 as shown below.
s T K A A
1 T s
K E E
1 T s
K G G 1 s T K R R 1 ) (s vref ) (s ve ) (s
vR vF(s) vt(s)
) (s vS
Fig. 6 Block diagram of automatic voltage regulator
From the above block diagram we can write open loop transfer function which is given as:
) ( )
(S H S
KG ) 1 )( 1 )( 1 )( 1
( T s T s T s T s
K K K K R G E A R G E A
(17)
And the closed loop transfer function relating the generator terminal voltage
V
t(
s
)
to the reference voltageV
ref(
s
)
isR G E A R G E A R G R E A ref t
K
K
K
K
s
T
s
T
s
T
s
T
s
T
K
K
K
K
s
v
s
v
)
1
)(
1
)(
1
)(
1
(
)
1
(
)
(
)
(
(18) IV.CONVENTIONAL CONTROLLERA. PI controller
The proportional plus integral controller has two output signals one is related to the error signal and other is related to the integral of error signal [8, 9]. The equation of PI controller is given as
s T K i p 1
1 (19)
Where
K
pis the gain of the controller,T
i is the time constant of the integral controller.B. PID controller
T s
s T
K d
p P
1
1 (20)
Where
K
pis a gain for controller andT
p andT
d are the time constant.V. FUZZY LOGIC CONTROL
The conventional controller is unable to give proper dynamic response when compared with intelligent controller. In this paper fuzzy logic is used for controlling the voltage and frequency response of power system fuzzy logic controller mainly consists of four components (1) Fuzzification inference (2) knowledge base (3) Decision making (4) Defuzzification inference [11-14]. The fuzzy Fuzzification inference measures the input variables and converts them into linguistic variables [15, 16]. By knowledge base we are able to define the rules which are necessary to produce the output. By this human being thinking is converted into reasoning without using any mathematical equation [17]. The Defuzzification inference converts the linguistic variables into the desired value output. The block diagram of fuzzy logic controller is shown in Fig. 7
Fig. 7 Block diagram of fuzzy logic controller
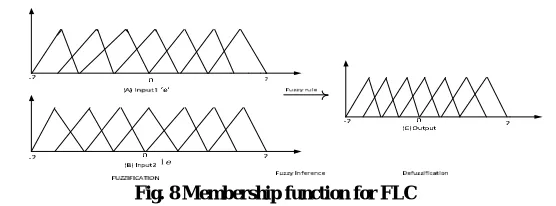
Membership function used for designing of fuzzy logic controller for AGC is given below in Fig. 8.
Fig. 8 Membership function for FLC
The rule base for AGC and AVR is shown in Table 1 the combinational exploration in rules is given by X=Ym. Where X is the number of rule=number of linguistic values for each input variables and m=number of input variables[18]. in this paper Y =7, and m=2, hence the no of rule for AGC it means X= 49, similarly for AVR Y=7.and M=2, hence X=49.rule base can be written as if (input1 is VVN) or (input2 is VVN) then (output is VVN),if (input1 is VVN) or (input2 is VN) then (output is VVN),if (input1 is VVN) or (input2 is VVP) then (output is ZE) the short form stands for VVN-Very very negative VN-very negative, N-negative, ZE-Zero, P-positive, VP-very positive, VVP-Very very negative[19, 20].
.
Table 1. Rule base for AGC
Derivative of error signal,
e
Error Signal
e
VVN VN N ZE P VP VVP
VVN VVN VVN VN VVN VN N ZE
VN VVN VVN VVN VN N ZE VP
N VVN VVN VN N ZE P VP
ZE VVN VN N ZE P VP VVP
P VN N ZE P VP VVP VVP
VP N ZE P VP VVP VVP VVP
VVP ZE VP VP VVP VVP VVP VVP
e
VI. SIMULATION RESULT
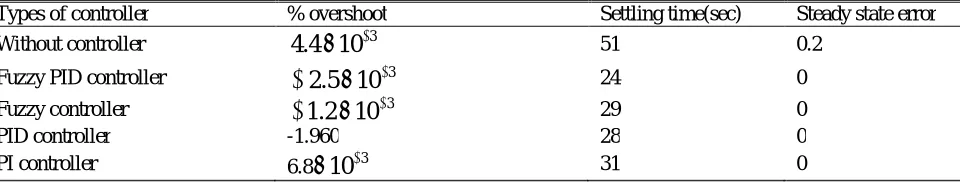
The conventional controller is compared with fuzzy controller it is find that fuzzy controller is better than conventional controller. In this paper the analysis of a single and double area power system for AGC and AVR is done, the simulation result are obtained by using mat lab software[21]. The proposed Fuzzy PID is compared with conventional PID,PI for both single and double area and it is found that Fuzzy PID result is better[22]. the frequency response for single area is shown in Fig. 9,and the power deviation and terminal voltage deviation is shown in Fig. 10-11, the summary of simulated result for frequency deviation and power deviation, terminal voltage deviation is shown in Table 2 - 4, and frequency deviation for double area is shown in Fig. 12-13,voltage deviation is shown in Fig. 14-15, and power deviation is shown in Fig. 16, Table 7-11 consist of summary of frequency deviation, terminal voltage and power deviation, in this way it can be seen that the frequency comes to steady state by some time, similarly the voltage response at the terminal of generator and the power response with respect to time comes to steady state. The data used is given in Table 5 - 6 for AGC and AVR, respectively. The table shows the settling time rise time steady state error, the fuzzy logic controller with PID controller is better as compare to conventional controller.
Fig. 9 Frequency deviation for single area system
Fig. 10 power deviations for single area power system
Fig. 11 Terminal voltage for single area power system
0 10 20 30 40 50 60 70 80 90 100
-0.02 -0.015 -0.01 -0.005 0 0.005 0.01
Time(sec)
c
h
a
n
g
e
f
re
q
u
e
n
c
y
(h
z
)
no controller fuzzy pid controller pid controller fuzzy controoler pi controller
0 10 20 30 40 50 60 70 80 90 100
-0.2 -0.1 0 0.1 0.2 0.3 0.4 0.5 0.6 0.7 0.8
Time(sec)
p
o
w
e
r
d
e
v
ia
ti
o
n
pi controller pid controller fuzzy pid fuzzy controller no controller
0 10 20 30 40 50 60 70 80 90 100
-0.2 0 0.2 0.4 0.6 0.8 1 1.2 1.4 1.6
Time(sec)
T
e
rm
in
a
l
v
o
lt
a
g
e
Table 2. Summary of frequency deviation for single area power system
Types of controller % overshoot Settling time(sec) Steady state error Without controller
4
.
4
10
3 51 0.2Fuzzy PID controller 3
10
5
.
2
24 0Fuzzy controller
1
.
2
10
3 29 0PID controller -1.960 28 0
PI controller 6.8 3
10
31 0Table 3. Summary of power deviation for single area power system
Types of controller % overshoot Settling time Steady state error
Without controller 1.4067 14 0.2
Fuzzy PID controller 0 22 0.0024
Fuzzy controller 0.9276 14 0.3
PID controller 1.1017 15 0
PI controller 1.548 22 0
Table 4. Summary of Terminal voltage for single area power system
Types of controller Percentage overshoot Settling time Steady state error
Without controller 0.6851 58 0.4
Fuzzy PID controller 0.2579 22 0
Fuzzy controller 0.4875 24 0
PID controller 0.4971 24.4 0.2169
PI controller 0.757 38 0.28
Table 5. Data used for AGC in double area power system model
Parameter of double area power system Area – 1 Area-2
Governor speed regulation
1
/
R
20 16Frequency bias factor
D
0.6 0.8 Inertia constant
H
5 4.0Bass power 1000MVA, 1000MVA
Governor time constant
T
g 0.2 0.3Turbine time constant
T
t 0.5 20.6Load change
P
l
50 MWTable 6. Data used for Automatic voltage control
Block of AVR Gain Time constant
Amplifier 9 0.1
Exciter 1 0.4
Generator 1 1.0
Fig. 12 Frequency deviation (
f
1 ) for area-1Fig. 13 Frequency deviation (
f
2 ) for area2Fig. 14 Terminal voltage response for area-1
0 10 20 30 40 50 60 70 80 90 100
-0.12 -0.1 -0.08 -0.06 -0.04 -0.02 0 0.02
Time(sec)
c
h
a
n
g
e
i
n
f
re
q
u
e
n
c
y
(H
z
)
Fuzzy controller
PI controller
Fuzzy PID
0 10 20 30 40 50 60 70 80 90 100
-0.25 -0.2 -0.15 -0.1 -0.05 0 0.05 0.1
Time(sec)
c
h
a
n
g
e
i
n
f
re
q
u
e
n
c
y
(
H
z
)
PI Controller
Fuzzy PID
Fuzzy
0 10 20 30 40 50 60 70 80 90 100
-0.2 0 0.2 0.4 0.6 0.8 1 1.2
Time(sec)
T
e
rm
in
a
l
v
o
lt
a
g
e
Fuzzy PID controller
PI controller
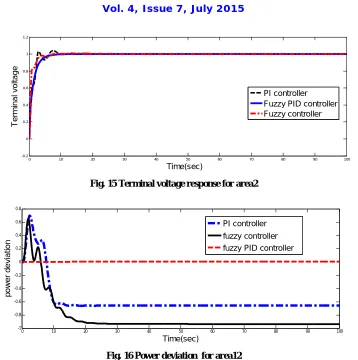
Fig. 15 Terminal voltage response for area2
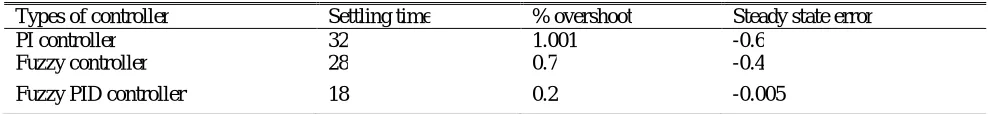
Fig. 16 Power deviation for area12
Table 7. Summary of frequency deviation of area-1
Types of controller Settling time % overshoot Steady state error
PI controller 32 0.0035 -0.001
Fuzzy controller 25 0.0034 0.0 Fuzzy PID controller 23 -0.0161 0.0
Table 8. Summary of frequency deviation of area-2
Types of controller Settling time % overshoot Steady state error
PI controller 40 -0.013 0.0
Fuzzy controller 27 0.03 0.0
Fuzzy PID controller 20 -0.0124 0.0
Table 9. Summary of Terminal voltage area-1
Types of controller Settling time % overshoot Steady state error
PI controller 20 1.17 0.0
Fuzzy controller 18 0.995 0.0
Fuzzy PID controller 12 0.91 0.0
Table 10. Summary of terminal voltage of area-2
Types of controller Settling time % overshoot Steady state error
PI controller 28 1.005 0.001
Fuzzy controller 15 1.035 0.0
0 10 20 30 40 50 60 70 80 90 100
-0.2 0 0.2 0.4 0.6 0.8 1 1.2
Time(sec)
T
e
rm
in
a
l
v
o
lt
a
g
e
PI controller Fuzzy PID controller Fuzzy controller
0 10 20 30 40 50 60 70 80 90 100
-1 -0.8 -0.6 -0.4 -0.2 0 0.2 0.4 0.6 0.8
Time(sec)
p
o
w
e
r
d
e
v
ia
ti
o
n
Fuzzy PID controller 10 0.9 0.0
Table 11. Summary of power deviation (
P
tie ) of area-12Types of controller Settling time % overshoot Steady state error
PI controller 32 1.001 -0.6
Fuzzy controller 28 0.7 -0.4
Fuzzy PID controller 18 0.2 -0.005
VII. CONCLUSION
In this paper, single-area and double-area power system models are considered for analysis. The responses like change in frequency, power deviation and terminal voltages are observed. The system response with proposed fuzzy controller is compared to the conventional controller and found that the intelligent controller is better than the conventional controller. The analysis of AGC and AVR is done together, by using the controller with reduced steady-state error, settling time; peak overshot of frequency response in AGC and terminal voltage in AVR. In both analyses fuzzy controller is better than the conventional controller.
REFERENCES
[1] J. Nanda and A. Mangla, "Automatic generation control of an interconnected hydro-thermal system using conventional integral and fuzzy
logic controller," in Proceedings of the IEEE International Conference on Electric Utility Deregulation, Restructuring and Power
Technologies, , 2004, pp. 372-377 Vol.1.
[2] N. K. Yegireddy and S. Panda, "Design and performance analysis of PID controller for an AVR system using multi-objective
non-dominated shorting genetic algorithm-II," in International Conference on Smart Electric Grid (ISEG), , 2014, pp. 1-7.
[3] R. Verma, S. Pal, and S. Sathans, "Intelligent Automatic Generation Control of Two-Area Hydrothermal Power System Using ANN and
Fuzzy Logic," in International Conference on Communication Systems and Network Technologies (CSNT-13), 2013, pp. 552-556.
[4] A. Usman and B. P. Divakar, "Simulation Study of Load Frequency Control of Single and Two Area Systems," in Global Humanitarian
Technology Conference (GHTC), 2012 IEEE, 2012, pp. 214-219.
[5] T. Chaiyatham, I. Ngamroo, S. Pothiya, and S. Vachirasricirikul, "Design of optimal fuzzy logic-PID controller using bee colony
optimization for frequency control in an isolated wind-diesel system," in Transmission & Distribution Conference & Exposition: Asia and
Pacific, 2009, 2009, pp. 1-4.
[6] B. K. Sahu, S. Pati, P. K. Mohanty, and S. Panda, "Teaching–learning based optimization algorithm based fuzzy-PID controller for
automatic generation control of multi-area power system," Applied Soft Computing, vol. 27, pp. 240-249, 2015.
[7] H. Saadat. power system analysis(2006) (2nd edition ed.).
[8] F. W. Chang CS, " Area load frequency control using fuzzy gain scheduling of PI controllers," Electric Power Systems Research vol. 2,
1997.
[9] M. R. I. Sheikh, S. M. Muyeen, R. Takahashi, T. Murata, and J. Tamura, "Application of self-tuning FPIC to AGC for load frequency
control in multi-area power system," in IEEE Bucharest PowerTech, '09', 2009, pp. 1-7.
[10] S. Pothiya, I. Ngamroo, and W. Kongprawechnon, "Design of optimal Fuzzy Logic-based PID controller using Multiple Tabu Search
algorithm for AGC including SMES units," in Power Engineering Conference, 2007. IPEC 2007. International, 2007, pp. 838-843.
[11] M. R. I. Sheikh, S. M. Muyeen, R. Takahashi, T. Murata, and J. Tamura, "Application of self-tuning FPIC to AGC for load frequency
control in multi-area power system," in PowerTech, IEEE Bucharest, 2009, pp. 1-7.
[12] D. K. Sambariya and R. Gupta, "Fuzzy Applications in a Multi-Machine Power System Stabilizer," Journal of Electrical Engineering &
Technology, vol. 5, pp. 503-510, 2010.
[13] D. K. Sambariya, R. Gupta, and A. K. Sharma, "Fuzzy Applications to Single Machine Power System Stabilizers," Journal of Theoretical
and Applied Information Technology, vol. 5, pp. 317-324, 2009.
[14] R. Gupta, D. K. Sambariya, and R. Gunjan, "Fuzzy Logic based Robust Power System Stabilizer for Multi-Machine Power System," in
IEEE International Conference on Industrial Technology, ICIT 2006., 2006, pp. 1037-1042.
[15] M. Suman, M. V. G. Rao, G. R. S. N. Kumar, and O. C. Sekhar, "Load frequency control of three unit interconnected multimachine power
system with PI and fuzzy controllers," in Advances in Electrical Engineering (ICAEE), 2014 International Conference on, 2014, pp. 1-5.
[16] D. K. Sambariya and R. Prasad, "Optimal Tuning of Fuzzy Logic Power System Stabilizer Using Harmony Search Algorithm,"
International Journal of Fuzzy Systems, pp. 1-14, 2015/06/17 2015.
[17] R. K. Sahu, S. Panda, and P. C. Pradhan, "Design and analysis of hybrid firefly algorithm-pattern search based fuzzy PID controller for
LFC of multi area power systems," International Journal of Electrical Power & Energy Systems, vol. 69, pp. 200-212, 2015.
[18] G. M. Yeşil E, Eksin İ;, "Self tuning fuzzy PID type load and frequency controller," Energy Conversion and Management, vol. 3, (2004).
[19] T. Barjeev and S. C. Srivastava, "A fuzzy logic based load frequency controller in a competitive electricity environment," in Power
Engineering Society General Meeting, 2003, IEEE, 2003, p. 565 Vol. 2.
[20] D. K. Sambariya and R. Prasad, "Design of Harmony Search Algorithm based tuned Fuzzy logic Power System Stabilizer," International
Review of Electrical Engineering (IREE), vol. 8, pp. 1594-1607, October 2013 2013.
[21] M. W. M. Abdullah J.H. Al Gizi, Nasir A. Al-geelani,Malik A. Alsaedi, "Sugeno fuzzy PID tuning, by genetic-neutral for AVR in
electrical power generation," Applied Soft Computing, vol. 28, 2014.
[22] S. P. G. V. Mukherjee, "Intelligent particle swarm optimized fuzzy PID controller for AVR system," Electric Power Systems Research,