ISSN 2348 - 7968
ANALYSIS OF LINE TO GROUND FAULT IN TRANSFORMER BY
ELMAN’S NETWORK USING GRADIENT DESCENT BACK
PROPAGATION ALGORITHM
R. RAMSINGH
M.E Power Management Anna University, Madurai Regional Centre
Abstract: This paper proposes new technique were found to be reliable and accurate in identifying the fault condition. Several articles present edit in each implementation and method from the last to present (2013). The advantage of the approach would be developed to the new detection in the future. Many interested topics used for detection of fault in the power system. In this research can be classified into two types interesting in fault detection. This review of many papers will be used to develop the research or find the new method for appropriate fault detection in the power system.
Keywords : Elman’s network, Back propagation, Gradient Descent, Feed Forward Neural Network.
1. INTRODUCTION
IN power systems, transformer is one of the essential elements and thus transformer protection is of critical importance. When the transformer is energized, magnetizing inrush current flowing into the transformer may be as great as ten times full load current. This high current may cause the relay to mal-operate. The relay provided has to operate only for fault condition and not for inrush condition. In order to have reliable protection it is essential to classify transient phenomena in power transformer. The saturation current that can occur when transformer are first switched in to service is called inrush. Transformer inrush current divided into three
categories. Energisation inrush, recovery inrush and sympathetic inrush.The first energisation inrush results from the reapplication of system voltage to a transformer which has been previously deenergised. The second recovery inrush occurs when transformer voltage is restored after having been reduced by a nearby short circuit on the system. The third symphathetic inrush can occurs when two or more transformers are operated in
parallel To gain an analytical
understanding the relationship between the voltage applied to the transformer winding and the flux in the transformer core.Recurrent neural network has been proposed and has demonstrated the capability of transformer monitoring and fault detection problem using an inexpensive, reliable and noninvasive procedure. The capacity to learn examples of one of the most desirable features of neural network models.
We present a learning algorithm for the recurrent momentum models using gradient decent of quadratic error function. The analytical propagation type algorithm that required the solution of a system of n linear and a nonlinear equations each time the neuron network learns a new input-output pair. The conjugate gradient optimization algorithm
is combined with modified back
ISSN 2348 - 7968 by adaptively modifying initial search
direction as described in the following steps(1) modification on standard ackprobagation algorithm by introducing a gain variation term in the activation function.(2)calculation of the gradient decent of error with respect the weights
and gains values and (3) The
determination of a new search direction by using information calculated in step (2). The performance of the proposed method in demonstrated by comparing accuracy and computation time with the momentum gradient algorithm used in MATLAB neural network tool box. The results show that the computational efficiency of the proposed method was better than the standard conjugate gradient algorithm
Line to Ground Fault
A ground fault is any short circuit that results in an unintended connection between an energized ungrounded phase conductor and ground. Ground faults are the most common type of fault on power distribution systems. They result from the unintentional grounding of an ungrounded phase conductor or insulation failure that brings the ungrounded phase conductor into contact with ground. Unintentional grounding of a phase conductor can occur when a small animal enters a piece of
equipment and contacts both an
ungrounded phase conductor and the grounded enclosure. Insulation failure resulting in a ground fault can occur when busbar insulator contamination results in a
flashover or when age or other
environmental factors degrade the conductor insulation.
For a solidly grounded distribution system, a ground fault results in current flowing back to the source through the equipment grounding conductor, which includes the metallic raceway enclosing
the circuit conductors, separate equipment grounding conductor if installed, or both. In addition, the ground fault current can also flow back to the source through other paths, including grounded metal piping, structural steel, and the ground itself. The amount of ground fault current flowing through alternate paths outside the distribution system ground path will depend on the relative impedance between the distribution system ground return path and the alternate parallel paths.
Backpropagation Algorithm
Suppose we have a fixed
training set
of m training examples. We can train our neural network using batch gradient descent. In detail, for a single training example (x,y), we define the cost function with respect to that single example to be:
This is a (one-half) squared-error cost function. Given a training set of m examples, we then define the overall cost function to be:
ISSN 2348 - 7968 [Note: Usually weight decay is not applied
to the bias terms , as reflected in our definition for J(W,b). Applying weight decay to the bias units usually makes only a small difference to the final network, however. If you've taken CS229 (Machine Learning) at Stanford or watched the course's videos on YouTube, you may also recognize this weight decay as essentially a variant of the Bayesian regularization method you saw there, where we placed a Gaussian prior on the parameters and did MAP (instead of maximum likelihood) estimation.]
d) Network Function:
a) Syntax
net.trainFcn = 'trainscg'
[net,tr] = train(net,...)
b)Description
trainscg is a network training function that updates weight and bias values according to the scaled conjugate gradient method.
net.trainFcn = 'trainscg'
[net,tr] = train(net,...)Training occurs according to trainscg's training parameters, shown here with their default values:
c) Network Use
You can create a standard network that uses trainscg with feedforwardnet or cascadeforwardnet. To prepare a custom network to be trained with trainscg,
1. Set net.trainFcn to 'trainscg'. This sets net.trainParam to trainscg's default parameters.
2. Set net.trainParam properties to desired values.
In either case, calling train with the resulting network trains the network with trainscg
The Algorithm
trainscg can train any network as long as its weight, net input, and transfer functions
have derivative functions.
Backpropagation is used to calculate derivatives of performance perf with respect to the weight and bias variables X.
Gradient algorithm
The gradient algorithm is based on conjugate directions, as in traincgp, traincgf, and traincgb, but this algorithm does not perform a line search at each iteration. See Moller (Neural Networks, Vol. 6, 1993, pp. 525–533) for a more detailed discussion of the scaled conjugate gradient algorithm.
Algorithm Step:
Step 1: Initialize the weight vector randomly, the gradient vector g0 to zero and gain vector to unit Values. Let the first search direction d0 be g0. Set βo=0, epoch=1 andn=1. Let Nt be the total Number of weight values. Select a convergence tolerance CT.
Step 2 : At step n, evaluate gradient vector gn(cn).
ISSN 2348 - 7968 Step 4 :Calculation a new gradient based
search direction which is a function of gain parameter:
Dn=-gn(cn)+βndn-1
Step 5 :IF n>1 THEN, Update
βn+1=gTn+1(cn+1)gn+1(cn+1)/gTn(cn)gn(cn) ELSE go to step 6
Step 6 :IF [(epoch+1)/Nt]=0 THEN resart the gradient vector with dn=-gn-1(cn-1) ELSE go to step 7.
Step 7 :Calculate the optimal Values for learning rate ŋn* by using line search
technique such as describe the
equation
Step 8 :Updatewn : wn+1=wn-ŋn*dn .
Step 9 :Evaluate new gradient vector gn+1(cn+1) with respect to gain value cn+1. Step 10: Calculate new search direction: dn+1=-gn+1(cn+1)+βn+1(cn)dn.
Step 11: Set n=n+1 and go to step 2.
Mean squared error
In statistics, the mean squared
error (MSE) of an estimator is one of
many ways to quantify the difference
between values implied by an estimator
and the true values of the quantity being
estimated. MSE is a risk function,
corresponding to the expected value of the
squared error loss or quadratic loss. MSE
measures the average of the squares of the
"errors." The error is the amount by which
the value implied by the estimator differs
from the quantity to be estimated. The
difference occurs because of randomness
or because the estimator doesn't account
for information that could produce a more
accurate estimate.
The MSE is the second moment
(about the origin) of the error, and thus
incorporates both the variance of the
estimator and its bias. For an unbiased
estimator, the MSE is the variance of the
estimator. Like the variance, MSE has the
same units of measurement as the square
of the quantity being estimated. In an
analogy to standard deviation, taking the
square root of MSE yields the
root-mean-square error or root-mean-root-mean-square deviation
(RMSE or RMSD), which has the same
units as the quantity being estimated; for
an unbiased estimator, the RMSE is the
square root of the variance, known as the
standard deviation.
Applications
ISSN 2348 - 7968 biased estimator may have lower
MSE; see estimator bias.
In statistical modelling the MSE, representing the difference between the actual observations and the observation values predicted by the model, is used to determine the extent to which the model fits the data and whether the removal or
some explanatory variables,
simplifying the model, is possible without significantly harming the model's predictive ability.
Training:
a. used to obtain weight values given training parameters.
b. training error estimates tend to be extremely biased as the number of unknown weights, Nw, increases toward the number of training equations, Ntrneq.
c. Ndof = Ntrneq-Nw is the number of estimation degrees of freedom (See Wikipedia). As long as Ndof is sufficiently positive, the bias of estimating error with training data can be mitigated,
somewhat, by using the degree of freedom adjustment of dividing SSEtrn by Ndof instead of Ntrneq.
Validation
a. used repeatedly with the training set to determine a good set of training parameters (especially the stopping epoch) via choosing the best of multiple random initial weight designs.
b. Validation set error tends to be much less biased than training set error, especially if training doesn't stop because of validation error convergence.
Test:
a.used once, and only once to obtain an
unbiased error estimate of
nontraining data.
b. if performance is unsatisfactory and more designs are necessary, the data should be repatitioned into new tr/val/tst subsets.
8.1 SIMULATION AND RESULT:
Classifier Type of
tool Method Test
No of
trails performance
Train
performance Val performance
Test of performance BPNN (Elman’s) Pattern recognitio n Breast cancer Line to Ground Fault
200 77.33 77.43 78.33 77.78
BPNN (Elman’s) Pattern recognitio n Iris Line to Ground Fault
200 77.78 77.89 77.79 77.4
BPNN (Elman’s) Pattern recognitio n Simple Class Line to Ground Fault
200 81.26 81.25 81.18 81.38
BPNN (Elman’s) Pattern recognitio n Type of Class Line to Ground Fault
200 82.58 81.19 83.63 85.37
BPNN (Elman’s) Pattern recognitio n Wine Vintage Line to Ground Fault
ISSN 2348 - 7968 Table 1
Input Voltage= 420 volt, Input Resistance= 4.35 ohm
Input Inductance=0.221 H
Frequency= 60 Hz
8.2 BEST METHOD OF NETWORK:
Table 2
Figure: 7 Iteration Diagram.
Figure: 8 Performance Graph
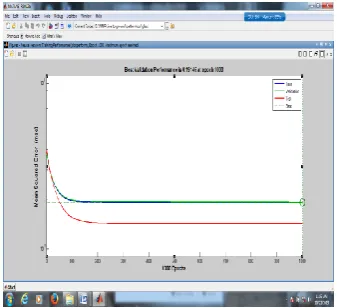
Figure: 9 Error of Performance
Figure: 10 Test, Validation, Training Graph
Classifier Type of tool
Method Test No
of trails
performance Train
performance
Val performance
Test of performance
BPNN
(Elam’s) recognition Pattern
Type of Class Line to Ground Fault
ISSN 2348 - 7968
$CONCLUSION:
Inrush current is really caused by saturation of the magnetic core of the transformer during part of the power cycle,therefore its waveform has distinct gap characteristics.when a transformer internal fault occurs, the fault current is closed to sinusoidal.the current magnitude calculated by one-cycle fourier filter cannot reflect the characteristics of inrush,but those calculated by garadient descent algorithm can.this paper presents a novel inrush criterion based on the detection of the magnitude difference calculated by pattern network.extensive simulation results proves the feasibility of presented criterion
REFERENCES:
(1)Power Based Detection of Inrush currents in single phase Transformer D.P.Balachandran, .R.Sreerama Kumar SMIEEE., B.Jayanand., Instantaneous 978-1-4673-1835-8/12 2012 IEEE
(2)A new method for recognizing internal faults from inrush current conditions in digital differential
protection of power
transformers,M.E.HamedaniGolshan,M .Saghaian-nejad,A.Saha,H.Samet,
Electrical Power system
research,71,2004,(61-71)
(3)Magnetising inrush current
identification using wavelet based Gaussian mixture models, simulation
Modelling Practice and
TheoryS.Jazebi,B.Vahidi,
S.H.Hosseinian,J.Faiz, ,17, 2009, (991-1010)
(4)Detection of Inrush Current Based On Wavelet Transform and LVQ Neural
NetworkG.Mokryani,M.R .Haghifam,,
senior member IEEE, 1) Islamic Azad university,soofianBranch,Iran
2)TarbiatModaresUniversity,Tehran,Iran 978-1-4244-6547-7/10/2010-IEEE
(5)Inrush Current Detection Based On Wavelet Transform and Probabilistic
Neural Network
G.Mokryani,P.Siano,A.Piccolo, ,IEEE Press 978-1-4244-4987-3/10 2010
(6)A fast and Reliable Transformer
Protection system Based ON the
TranformerMagnetising characteristics and
Artificial Neural
NetworksA.Nosseir,A.S.Attia, ,IEEE Press 978-4244-1933-3/08 2008
(7)A Novel Detection Criterion for Transformer Inrush Based on short-Window Filter Algorithm Zhengqing
Han., ,School of Electrical
Engineering,SouthwestJiaotong
University, Chengdu 610031, china ShupingLiu,ShibinGao,
(8)Awavelet –based method to
discriminate internal faults from inrush
currents using correlation
coefficient,Electrical Power and Energy systems, .Ghaffarzadeh,S.H.Hosseinian, 32,2010,(788-793)
ISSN 2348 - 7968 Transactions on Power Delivery, Vol. 8,
No. 1, January, 1993, pp. 246-254.
(10)“Harmonic Analysis of Transient
Currents During Sympathetic
Interaction”,H. S. Bronzeado, P. B. Brogan, R. Yacamini, IEEE Transactions on Power Systems, Vol. 11, No. 4, November 1996.
(11)Transformer Substation”, Conference Record of the 36th Annual Meeting of the IAS, M. M. Saied, “A Study on the Inrush Current Phenomena in 2001. pp. 1180-1187.
(12)Consideration of Inrush Restraint Methods in Transformer Differential Relays”, 54th Annual Georgia Tech Protective Relaying R. W. Patterson, W.
P. McCannon, G. L. Kobet, “A
Conference, Georgia Tech, Atlanta, GA, May 3-5, 2000.
(13)B. Kasztenny, A. Kulidjian, “An Improved Transformer Inrush Restraint Algorithm Increases Security While
Maintaining Fault Response
Performance”, 53rd Annual Conference for Protective Relay Engineers, Texas A&M, April 11th – 13th, 2000.
BIOGRAPHY OF AUTHOR
AUTHOR: R.RAMSINGH, M.E.,