International Journal of Research (IJR)
e-ISSN: 2348-6848, p- ISSN: 2348-795X Volume 2, Issue 4, April 2015Available at http://internationaljournalofresearch.org
To Study the Various Methods used in Data Mining
Author Name: - Gagandeep Kaur Guide Name: - Narinder Kumar Sharma
University College of Computer Applications Author Phone No: - 9878205006 Email Id: - [email protected]
ABSTRACT
Knowledge discovery in databases and data mining aim at semiautomatic tools for the analysis of large data sets We consider some methods used in data mining, concentrating on level wise search for all frequently occurring patterns. We show how this technique can be used in various applications. We also discuss possibilities for compiling data mining queries into algorithms, and look at the use of sampling in data mining. We conclude by listing several open research problems in data mining and knowledge discovery. Many different data mining, query model, processing model, and data collection techniques are available. Which one do you use to mine your data, and which one can you use in combination with your existing software and infrastructure? Examine different data mining and analytics techniques and solutions, and learn how to build them using existing software and installations. Explore the different data mining tools that are available, and learn how to determine whether the size and complexity of your information might result in processing and storage complexities, and what to do.
Data Keywords: -
Data Mining; Knowledge Discovery; Data Mining Tools and Data Mining Methods.
INTRODUCTION
1. INTRODUCATION
Data Mining is defined as the procedure of extracting information from huge sets of data. In other words, we can say that data mining is
mining knowledge from data. The tutorial starts off with a basic overview and the terminologies involved in data mining and then gradually moves on to cover topics such as knowledge discovery, query language, classification and prediction, decision tree induction, cluster analysis, and how to mine the Web.
1.1 Data Mining Overview
There is a huge amount of data available in the Information Industry. This data is of no use until it is converted into useful information. It is necessary to analyze this huge amount of data and extract useful information from it.
Extraction of information is not the only process we need to perform; data mining also involves other processes such as Data Cleaning, Data Integration, Data Transformation, Data Mining, Pattern Evaluation and Data Presentation. Once all these processes are over, we would be able to use this information in many applications such as Fraud Detection, Market Analysis, Production Control, Science Exploration, etc.
1.2 What is Data Mining?
International Journal of Research (IJR)
e-ISSN: 2348-6848, p- ISSN: 2348-795X Volume 2, Issue 4, April 2015Available at http://internationaljournalofresearch.org
Market Analysis Fraud Detection Customer Retention Production Control Science Exploration
1.3 Data Mining Applications
Data mining is highly useful in the following domains −
Market Analysis and Management Corporate Analysis & Risk
Management Fraud Detection
Apart from these, data mining can also be used in the areas of production control, customer retention, science exploration, sports, astrology, and Internet Web Surf-Aid.
1.3.1 Market Analysis and
Management
Listed below are the various fields of market where data mining is used −
Customer Profiling − Data mining helps determine what kind of people buy what kind of products.
Identifying Customer Requirements − Data mining helps in identifying the best products for different customers. It uses prediction to find the factors that may attract new customers.
Cross Market Analysis − Data
mining performs
association/correlations between product sales.
Target Marketing − Data mining helps to find clusters of model customers who share the same characteristics such as interests, spending habits, income, etc.
Determining Customer purchasing pattern − Data mining helps in
determining customer purchasing pattern.
Providing Summary Information − Data mining provides us various multidimensional summary reports.
1.3.2 Corporate Analysis and Risk
Management
Data mining is used in the following fields of the Corporate Sector −
Finance Planning and Asset Evaluation − It involves cash flow analysis and prediction, contingent claim analysis to evaluate assets. Resource Planning − It involves
summarizing and comparing the resources and spending.
Competition − It involves monitoring competitors and market directions.
1.3.3 Fraud Detection
Data mining is also used in the fields of credit card services and telecommunication to detect frauds. In fraud telephone calls, it helps to find the destination of the call, duration of the call, time of the day or week, etc. It also analyzes the patterns that deviate from expected norms.
Data mining deals with the kind of patterns that can be mined. On the basis of the kind of data to be mined, there are two categories of functions involved in Data Mining −
Descriptive
Classification and Prediction
Descriptive Function
The descriptive function deals with the general properties of data in the database. Here is the list of descriptive functions −
International Journal of Research (IJR)
e-ISSN: 2348-6848, p- ISSN: 2348-795X Volume 2, Issue 4, April 2015Available at http://internationaljournalofresearch.org
Mining of Associations Mining of Correlations Mining of Clusters
Classification and Prediction
Classification is the process of finding a model that describes the data classes or concepts. The purpose is to be able to use this model to predict the class of objects whose class label is unknown. This derived model is based on the analysis of sets of training data. The derived model can be presented in the following forms −
Classification (IF-THEN) Rules Decision Trees
Mathematical Formulae Neural Networks
The list of functions involved in these processes is as follows −
Classification − It predicts the class of objects whose class label is unknown. Its objective is to find a derived model that describes and distinguishes data classes or concepts. The Derived Model is based on the analysis set of training data i.e. the data object whose class label is well known.
Prediction − It is used to predict missing or unavailable numerical data values rather than class labels. Regression Analysis is generally used for prediction. Prediction can also be used for identification of distribution trends based on available data.
Outlier Analysis − Outliers may be defined as the data objects that do not comply with the general behavior or model of the data available.
Evolution Analysis − Evolution analysis refers to the description and model regularities or trends for objects whose behavior changes over time.
1.4 Data Mining Task Primitives
We can specify a data mining task in the form of a data mining query. This query is input to the system. A data mining query is defined in
terms of data mining task primitives.
Note − these primitives allow us to communicate in an interactive manner with the data mining system. Here is the list of Data Mining Task Primitives −
Set of task relevant data to be mined. Kind of knowledge to be mined. Background knowledge to be used in
discovery process.
Interestingness measures and thresholds for pattern evaluation. Representation for visualizing the
discovered patterns.
1.4.1 Set of task relevant data to be
mined
This is the portion of database in which the user is interested. This portion includes the following −
Database Attributes
Data Warehouse dimensions of interest
1.4.2 Kind of knowledge to be mined
It refers to the kind of functions to be performed. These functions are −
Characterization Discrimination
Association and Correlation Analysis Classification
International Journal of Research (IJR)
e-ISSN: 2348-6848, p- ISSN: 2348-795X Volume 2, Issue 4, April 2015Available at http://internationaljournalofresearch.org
1.4.3 Background knowledge
The background knowledge allows data to be mined at multiple levels of abstraction. For example, the Concept hierarchies are one of the background knowledge that allows data to be mined at multiple levels of abstraction.
1.4.4 Interestingness measures and
thresholds for pattern evaluation
This is used to evaluate the patterns that are discovered by the process of knowledge discovery. There are different interesting measures for different kind of knowledge.
1.4.5 Representation for visualizing the
discovered patterns
This refers to the form in which discovered patterns are to be displayed. These representations may include the following −
Rules Tables Charts Graphs
Decision Trees Cubes
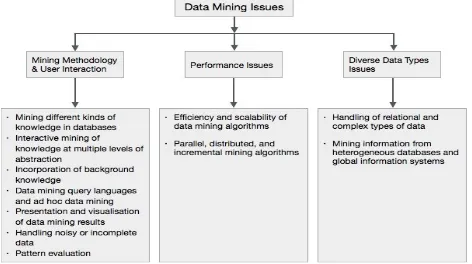
1.5 Data Mining Issues
Data mining is not an easy task, as the algorithms used can get very complex and data is not always available at one place. It needs to be integrated from various heterogeneous data sources. These factors also create some issues. Here in this tutorial, we will discuss the major issues regarding −
Mining Methodology and User Interaction
Performance Issues
Diverse Data Types Issues
The following diagram describes the major issues.
International Journal of Research (IJR)
e-ISSN: 2348-6848, p- ISSN: 2348-795X Volume 2, Issue 4, April 2015Available at http://internationaljournalofresearch.org
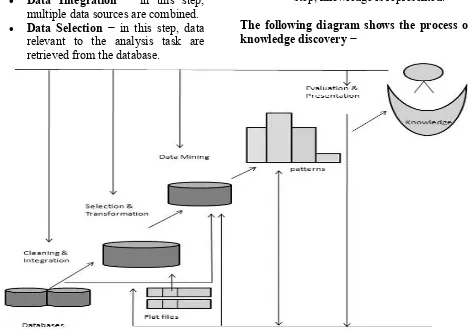
1.6 What is Knowledge Discovery?
Some people don‘t differentiate data mining from knowledge discovery while others view data mining as an essential step in the process of knowledge discovery. Here is the list of steps involved in the knowledge discovery process −
Data Cleaning − in this step, the noise and inconsistent data is removed.
Data Integration − in this step, multiple data sources are combined. Data Selection − in this step, data
relevant to the analysis task are retrieved from the database.
Data Transformation − in this step, data is transformed or consolidated into forms appropriate for mining by performing summary or aggregation operations.
Data Mining − in this step, intelligent methods are applied in order to extract data patterns.
Pattern Evaluation − in this step, data patterns are evaluated.
Knowledge Presentation − in this step, knowledge is represented.
The following diagram shows the process of knowledge discovery −
Figure 1.2: - Process of Knowledge Discovery
1.7 Data Mining Methods
The data mining methods are broadly categorized as below. These methods use different types of algorithms and data. The data source can be data warehouse, database, flat file or text file. The algorithms may be Statistical Algorithms, Decision Tree based, Nearest Neighbor, Neural Network based, Genetic Algorithms based, Ruled based,
Support Vector Machine etc. The selection of data mining algorithm is mainly depends on the type of data used for mining and the expected outcome of the mining process. The domain experts play a significant role in the selection of algorithm for data mining.
Classification
Clustering
International Journal of Research (IJR)
e-ISSN: 2348-6848, p- ISSN: 2348-795X Volume 2, Issue 4, April 2015Available at http://internationaljournalofresearch.org
Temporal Data Mining
Time Series Analysis
Spatial Mining
Web Mining
A knowledge discovery (KD) process involves preprocessing data, choosing a data mining algorithm, and post processing the mining results. There are very many choices for each of these stages, and non-trivial interactions between them. Therefore both novices and data-mining specialists need assistance in knowledge discovery processes. The Intelligent Discovery Assistants (IDA) helps users in applying valid knowledge discovery processes.
The IDA can provide users with three benefits:
A systematic enumeration of valid knowledge discovery processes;
Effective rankings of valid processes by different criteria, which help to choose between the options;
An infrastructure for sharing knowledge, which leads to network externalities. Several other attempts have been made to automate this process and design of a generalized data mining tool that possess intelligence to select the data and data mining algorithms and up to some extent the knowledge discovery. 1.8 How Data Mining Works?
How exactly is data mining able to tell you important things that you didn't know or what is going to happen next? The technique that is used to perform these feats in data mining is called modeling. Modeling is simply the act of building a model in one situation where you know the answer and then applying it to another situation that you don't. For instance, if you were looking for a sunken Spanish galleon on the high seas the first thing you might do is to research the times when Spanish treasure had been found by others in the past. You might note that these ships often tend to be found off the coast of Bermuda and that there are certain characteristics to the ocean currents, and certain routes that have likely been taken by the ship‘s captains in that era. You note these similarities and build a model that includes the characteristics that are common to the locations of these sunken treasures. With these models in hand you sail off looking for treasure where your model indicates it most likely might be given a similar situation in the
past. Hopefully, if you've got a good model, you find your treasure.
This act of model building is thus something that people have been doing for a long time, certainly before the advent of computers or data mining technology. What happens on computers, however, is not much different than the way people build models. Computers are loaded up with lots of information about a variety of situations where an answer is known and then the data mining software on the computer must run through that data and distill the characteristics of the data that should go into the model. Once the model is built it can then be used in similar situations where you don't know the answer. For example, say that you are the director of marketing for a telecommunications company and you'd like to acquire some new long distance phone customers. You could just randomly go out and mail coupons to the general population - just as you could randomly sail the seas looking for sunken treasure. In neither case would you achieve the results you desired and of course you have the opportunity to do much better than random - you could use your business experience stored in your database to build a model.
As the marketing director you have access to a lot of information about all of your customers: their age, sex, credit history and long distance calling usage. The good news is that you also have a lot of information about your prospective customers: their age, sex, credit history etc. Your problem is that you don't know the long distance calling usage of these prospects (since they are most likely now customers of your competition). You'd like to concentrate on those prospects that have large amounts of long distance usage. You can accomplish this by building a model. Table 2 illustrates the data used for building a model for new customer prospecting in a data warehouse.
International Journal of Research (IJR)
e-ISSN: 2348-6848, p- ISSN: 2348-795X Volume 2, Issue 4, April 2015Available at http://internationaljournalofresearch.org
98% of my customers who make more than $60,000/year spend more than $80/month on long distance
This model could then be applied to the prospect data to try to tell something about the proprietary information that this telecommunications company does not currently have access to. With this model in hand new customers can be selectively targeted.
Test marketing is an excellent source of data for this kind of modeling. Mining the results of a test market representing a broad but relatively small sample of prospects can provide a foundation for identifying good prospects in the overall market. Table 3 shows another common scenario for building models: predict what is going to happen in the future.
Table 1: - Data Mining for Prospecting
Customers Prospects
General information (e.g. demographic data) Known Known
Proprietary information (e.g. customer transactions) Known Target
Table 2: - Data Mining for Predictions
Yesterday Today Tomorrow
Static information and current plans (e.g.
demographic data, marketing plans) Known Known Known
Dynamic information (e.g. customer transactions)
Known Known Target
If someone told you that he had a model that could predict customer usage how would you know if he really had a good model? The first thing you might try would be to ask him to apply his model to your customer base - where you already knew the answer. With data mining, the best way to accomplish this is by setting aside some of your data in a vault to isolate it from the mining process. Once the mining is complete, the results can be tested against the data held in the vault to confirm the model‘s validity. If the model works, its observations should hold for the vaulted data.
1.9 An Architecture for Data Mining.
International Journal of Research (IJR)
e-ISSN: 2348-6848, p- ISSN: 2348-795X Volume 2, Issue 4, April 2015Available at http://internationaljournalofresearch.org
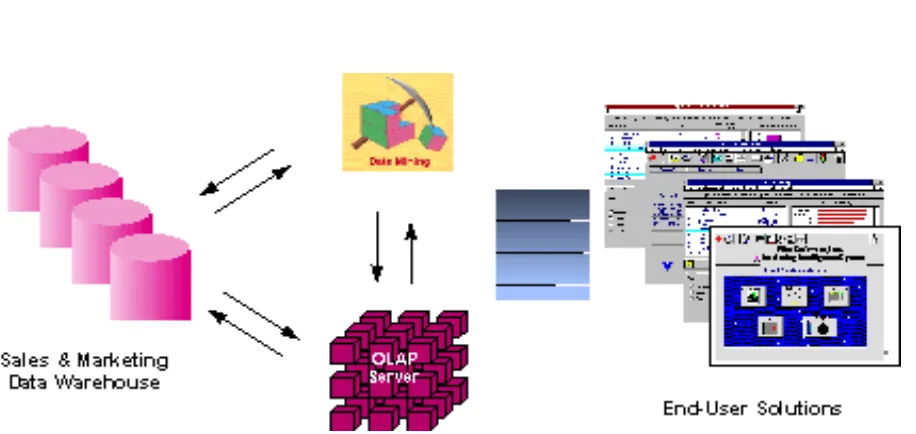
Figure 1.3 illustrates architecture for advanced analysis in a large data warehouse.
Figure 1.3: - Integrated Data Mining Architecture
The ideal starting point is a data warehouse containing a combination of internal data tracking all customer contact coupled with external market data about competitor activity. Background information on potential customers also provides an excellent basis for prospecting. This warehouse can be implemented in a variety of relational database systems: Sybase, Oracle, Redbrick, and so on, and should be optimized for flexible and fast data access.
An OLAP (On-Line Analytical Processing) server enables a more sophisticated end-user business model to be applied when navigating the data warehouse. The multidimensional structures allow the user to analyze the data as they want to view their business – summarizing by product line, region, and other key perspectives of their business. The Data Mining Server must be integrated with the data warehouse and the OLAP server to embed ROI-focused business analysis directly into this infrastructure. An advanced, process-centric metadata template defines the data mining objectives for specific business issues like campaign management, prospecting, and promotion optimization. Integration with the data warehouse enables operational decisions to
be directly implemented and tracked. As the warehouse grows with new decisions and results, the organization can continually mine the best practices and apply them to future decisions.
This design represents a fundamental shift from conventional decision support systems. Rather than simply delivering data to the end user through query and reporting software, the Advanced Analysis Server applies users‘ business models directly to the warehouse and returns a proactive analysis of the most relevant information. These results enhance the metadata in the OLAP Server by providing a dynamic metadata layer that represents a distilled view of the data. Reporting, visualization, and other analysis tools can then be applied to plan future actions and confirm the impact of those plans.
PROBLEM FORMULATION
International Journal of Research (IJR)
e-ISSN: 2348-6848, p- ISSN: 2348-795X Volume 2, Issue 4, April 2015Available at http://internationaljournalofresearch.org
3.1 Problem Formulation
The development of Information Technology has generated large amount of databases and huge data in various areas. The research in databases and information technology has given rise to an approach to store and manipulate this precious data for further decision making. Data mining is a process of extraction of useful information and patterns from huge data. It is also called as knowledge discovery process, knowledge mining from data, knowledge extraction or data /pattern analysis. To generate information it requires massive collection of data. The data can be simple numerical figures and text documents, to more complex information such as spatial data, multimedia data, and hypertext documents. To take complete advantage of data; the data retrieval is simply not enough, it requires a tool for automatic summarization of data, extraction of the essence of information stored, and the discovery of patterns in raw data. With the enormous amount of data stored in files, databases, and other repositories, it is increasingly important, to develop powerful tool for analysis and interpretation of such data and for the extraction of interesting knowledge that could help in decision-making. The only answer to all above is ‗Data Mining‘. Data mining is the extraction of hidden predictive information from large databases; it is a powerful technology with great potential to help organizations focus on the most important information in their data warehouses (Fayyad 1996). Data mining tools predict future trends and behaviors, helps organizations to make proactive knowledge-driven decisions (Fayyad 1996). The automated, prospective analyses offered by data mining move beyond the analyses of past events provided by retrospective tools typical of decision support systems. Data mining tools can answer the questions that traditionally were too time consuming to resolve. They prepare databases for finding hidden patterns, finding predictive information that experts may miss because it
lies outside their expectations. Data mining, popularly known as Knowledge Discovery in Databases (KDD), it is the nontrivial extraction of implicit, previously unknown and potentially useful information from data in databases (Dunham 2006). Though, data mining and knowledge discovery in databases (or KDD) are frequently treated as synonyms, data mining is actually part of the knowledge discovery process.
3.2 OBJECTIVE
Data mining derives its name from the similarities between searching for valuable business information in a large database — for example, finding linked products in gigabytes of store scanner data — and mining a mountain for a vein of valuable ore. Both processes require either sifting through an immense amount of material, or intelligently probing it to find exactly where the value resides. Given databases of sufficient size and quality, data mining technology can generate new business opportunities by providing these capabilities:
Automated prediction of trends and behaviors. Data mining automates the process of finding predictive information in large databases. Questions that traditionally required extensive hands-on analysis can now be answered directly from the data — quickly. A typical example of a predictive problem is targeted marketing. Data mining uses data on past promotional mailings to identify the targets most likely to maximize return on investment in future mailings. Other predictive problems include forecasting bankruptcy and other forms of default, and identifying segments of a population likely to respond similarly to given events.
International Journal of Research (IJR)
e-ISSN: 2348-6848, p- ISSN: 2348-795X Volume 2, Issue 4, April 2015Available at http://internationaljournalofresearch.org
previously hidden patterns in one step. An example of pattern discovery is the analysis of retail sales data to identify seemingly unrelated products that are often purchased together. Other pattern discovery problems include detecting fraudulent credit card transactions and identifying anomalous data that could represent data entry keying errors.
Data mining techniques can yield the benefits of automation on existing software and hardware platforms, and can be implemented on new systems as existing platforms are upgraded and new products developed. When data mining tools are implemented on high performance parallel processing systems, they can analyze massive databases in minutes. Faster processing means that users can automatically experiment with more models to understand complex data. High speed makes it practical for users to analyze huge quantities of data. Larger databases, in turn, yield improved predictions.
Databases can be larger in both depth and breadth:
More columns. Analysts must often limit the number of variables they examine when doing hands-on analysis due to time constraints. Yet variables that are discarded because they seem unimportant may carry information about unknown patterns. High performance data mining allows users to explore the full depth of a database, without preselecting a subset of variables.
More rows Larger samples yield lower estimation errors and variance, and allow users to make inferences about small but important segments of a population.
RESEARCH METHODOLOGY
The engineering design process is based on the scientific approach to problem solving. By this
approach it is possible to implement corrective solutions that take the form of new or improved systems. The engineering design process, as described by Landis, was used in the execution of this study and, which its four steps are detailed below.
4.1 Identification of a need or
opportunity
This step is the first step in problem, which is so extensive and varied for industrial procedures. But because of the variety of data and information, deciding on the most effective data mining techniques and systems can be complicated. As noted above, there are many different software vendors with many different data mining software applications; each promotes its own data mining methodology. Data mining, like industrial procedures, is the result of the confluence of multiple disciplines and for that reason, the process of implementing data mining process in industrial procedures is difficult and requires much specialized knowledge.
4.2 Problem Definition
There are so many options, tasks, techniques, tools, formats, and approaches to data mining that industrial specialists find it very difficult to design and implement projects. Although methodologies already exist, they are designed for specific software packages. Most of these methodologies use a traditional statistical approach. It is still not clear that this approach to data mining is sufficient for obtaining the vast array of data needed for industrial procedures applications. Thus, a data mining methodology to meet the specific requirements of industrial procedures is needed.
International Journal of Research (IJR)
e-ISSN: 2348-6848, p- ISSN: 2348-795X Volume 2, Issue 4, April 2015Available at http://internationaljournalofresearch.org
been or could be used in industrial procedures‘ applications. It also asked whether they had applied or sold their data mining products for the implementation of projects related to industrial procedures areas such as quality control, scheduling, manufacturing, safety, or ergonomics. Other questions were related to hardware requirements and prices. The most relevant results of this survey are shown in Figures 4.1 and 4.2. Figure 4.1 shows that approximately 60% of the companies have either sold their product for industrial
procedures‘ applications or believe their product is applicable for industrial procedures. The survey also asked about costs, because the cost of data mining may prevent some companies from using it even though it could benefit them. Figure 4.2 show that the average cost is approximately $5,000, a feature that might be prohibitive for smaller companies. Thus, design restrictions and cost appear to be key factors that affect the use of data mining in
industrial procedures.
Fig. 4.1 Application of Data Mining Software to Industrial Procedure Areas
International Journal of Research (IJR)
e-ISSN: 2348-6848, p- ISSN: 2348-795X Volume 2, Issue 4, April 2015Available at http://internationaljournalofresearch.org
4.4 Design of a Proposed Methodology
While SEMMA and CRISP-DM are still useful methodologies, but they have some deficiencies, and may not be suitable methodologies for industrial procedures‘ purposes. Therefore, by understanding the needs of industrial procedures, studying the common methodologies in this section, and also the application of information system analysis and design structure
XPERIMENTAL RESULT
Various algorithms and techniques like Classification, Clustering, Regression, Artificial Intelligence, Neural Networks, Association Rules, Decision Trees, Genetic Algorithm, Nearest Neighbor method etc., are used for knowledge discovery from databases.
5.1 Classification
Classification is the most commonly applied data mining technique, which employs a set of pre-classified examples to develop a model that can classify the population of records at large. Fraud detection and credit risk applications are particularly well suited to this type of analysis. This approach frequently employs decision tree or neural network-based classification algorithms. The data classification process involves learning and classification. In Learning the training data are analyzed by classification algorithm. In classification test data are used to estimate the accuracy of the classification rules. If the accuracy is acceptable the rules can be applied to the new data tuples. For a fraud detection application, this would include complete records of both fraudulent and valid activities determined on a record-by-record basis. The classifier-training algorithm uses these pre-classified examples to determine the set of parameters required for proper discrimination. The algorithm then encodes these parameters into a model called a classifier. Types of classification models: -
Classification by decision tree induction
Bayesian Classification Neural Networks
Support Vector Machines (SVM) Classification Based on Associations
5.2 Clustering
Clustering can be said as identification of similar classes of objects. By using clustering techniques we can further identify dense and sparse regions in object space and can discover overall distribution pattern and correlations among data attributes. Classification approach can also be used for effective means of distinguishing groups or classes of object but it becomes costly so clustering can be used as preprocessing approach for attribute subset selection and classification. For example, to form group of
Customers based on purchasing patterns, to categories genes with similar functionality. Types of clustering methods
Partitioning Methods
Hierarchical Agglomerative (divisive) methods
Density based methods Grid-based methods Model-based methods
5.3 Predication
International Journal of Research (IJR)
e-ISSN: 2348-6848, p- ISSN: 2348-795X Volume 2, Issue 4, April 2015Available at http://internationaljournalofresearch.org
neural nets) may be necessary to forecast future values. The same model types can often be used for both regression and classification. For example, the CART (Classification and Regression Trees) decision tree algorithm can be used to build both classification trees (to classify categorical response variables) and regression trees (to forecast continuous response variables). Neural networks too can create both classification and regression models.
Types of regression methods: -
Linear Regression
Multivariate Linear Regression Nonlinear Regression
Multivariate Nonlinear Regression
5.4 Association Rule
Association and correlation is usually to find frequent item set findings among large data sets. This type of finding helps businesses to make certain decisions, such as catalogue design, cross marketing and customer shopping behavior analysis. Association Rule algorithms need to be able to generate rules with confidence values less than one. However the number of possible Association Rules for a given dataset is generally very large and a high proportion of the rules are usually of little (if any) value.
Types of association rule: -
Multilevel association rule
Multidimensional association rule Quantitative association rule
5.5 Neural Network
Neural network is a set of connected input/output units and each connection has a weight present with it. During the learning phase, network learns by adjusting weights so as to be able to predict the correct class labels of the input tuples. Neural networks have the remarkable ability to derive meaning from complicated or imprecise data and can be used to extract patterns and detect trends that are too complex to be noticed by either humans or
other computer techniques. These are well suited for continuous valued inputs and outputs. For example handwritten character reorganization, for training a computer to pronounce English text and many real world business problems and have already been successfully applied in many industries. Neural networks are best at identifying patterns or trends in data and well suited for prediction or forecasting needs.
Types of neural networks Back Propagation
CONCLUSION AND FUTURE WORK
This chapter is based upon the conclusion of what we have done so far and how the system can be further enhanced with an increase in requirements.
6.1 CONCLUSION
Comprehensive data warehouses that integrate operational data with customer, supplier, and market information have resulted in an explosion of information. Competition requires timely and sophisticated analysis on an integrated view of the data. However, there is a growing gap between more powerful storage and retrieval systems and the users‘ ability to effectively analyze and act on the information they contain. Both relational and OLAP technologies have tremendous capabilities for navigating massive data warehouses, but brute force navigation of data is not enough. A new technological leap is needed to structure and prioritize information for specific end-user problems. The data mining tools can make this leap. Quantifiable business benefits have been proven through the integration of data mining with current information systems, and new products are on the horizon that will bring this integration to an even wider audience of users.
International Journal of Research (IJR)
e-ISSN: 2348-6848, p- ISSN: 2348-795X Volume 2, Issue 4, April 2015Available at http://internationaljournalofresearch.org
2. Gartner Group Advanced Technologies and Applications Research Note, 2/1/95.
3. Gartner Group High Performance Computing Research Note, 1/31/95.
REFERENCES
[1]. Heikki Mannila ―Methods and Problems in Data Mining‖ International Conference on Database Theory, Pages 243-258, Print ISBN: 1-58113-206-9, INSPEC Accession Number: 6734866
[2]. R. Agrawal, T. Imielinski, and A. Swami. ―Mining association rules between sets of items in large databases‖. In Proceedings of ACM SIGMOD Conference on Management of Data (SIGMOD '93), pages 207-216, May 1993
[3]. R. Agrawal, H. Mannila, R. Srikant, H. Toivonen, and A. I. Verkamo. ―Fast discovery of association rules‖ In U.M. Fayyad, G. Piatetsky-Shapiro, P .Smyth, and R. Uthurusamy, editors, Advances in Knowledge Discovery and Data Mining, pages 307 - 328. AAA I Press, Menlo P ark, CA, 1996.
[4]. R. Agrawal and K. Shim ―Developing tightly-coupled data mining applications on a relational database system‖ In Proc .of the 2nd Int 'l Conference on Knowledge Discovery in Databases and Data Mining, pages 287-290, 1996.
[5]. S. Berchtold, D. A. Keim, and H. P. Kriegel. ―The X -tree: An index structure for high-dimensional data‖. In Proceedings of the 22nd International Conference on Very Large Data Bases (VLDB'96), pages 28-29, Mumbai, India, 1996. Morgan Kaufmann.
[6]. P. A. Boncz, W. Quak, and M. L. Kersten. Monet and its geographical extensions: ―a novel approach to high-performance GIS processing‖. In P. M. G. Apers, M. Bouzeghoub, and G. Gardarin, editors, Advances in Database Technology - EDBT'96, pages 147- 166, 1996.