Available Online atwww.ijcsmc.com
International Journal of Computer Science and Mobile Computing
A Monthly Journal of Computer Science and Information Technology
ISSN 2320–088X
IMPACT FACTOR: 6.017IJCSMC, Vol. 6, Issue. 5, May 2017, pg.64 – 71
Student Performance Analysis
Using Data Mining Technique
Bhavesh Patel
1, Chetan Gondaliya
2¹AMPICS & Ganpat University, India ¹AMPICS & Ganpat University, India
1
[email protected]; [email protected]
Abstract— Data mining techniques are implemented in many organizations as a standard procedure for analyzing the large volume of available data, extracting useful information and knowledge to support the major decision-making processes. Data mining can be applied to wide variety of applications in the educational sector for the purpose of improving the performance of students as well as the status of the educational institutions. Educational data mining is rapidly developing as a key technique in the analysis of data generated in the educational domain. The aim of this study presents an analysis of every semester results of UG degree students using data mining technique. This research work compares the result classification algorithms. The comparison is done using the measurement of accuracy and measurements of Error Rate. This research work also shows that which algorithm is most suitable for predicting the performance of the students among the selected algorithms. The analysis work is done by considering various types of algorithm like decision tree algorithm, rule based algorithm, Bayesian algorithm and function based algorithms. This generic novel approach can be extended to other disciplines as well.
Keywords— data mining, classification, educational data mining, predicting performance.
I. INTRODUCTION
Higher education has gained importance manifolds in the past few decades. The higher educational institutes are forced to revise its scope and objects because of the private participation. The controller of regulatory body has put some guidelines with regard to infrastructure, faculty and other resources. New technologies are being developed in the field of data management and analysis due to large supply of data being present in several companies, including both private and public. The main aim of the techniques of data mining is to discover hidden and insignificant links within the information having diverse characteristics. Various techniques of data mining are being used in different fields including the educational environment. A very encouraging area to attain this objective is the usage of Data Mining (DM) [1]. In fact, classification is one of the most helpful DM work in education.
knowledge from the data [2]. The aim is to resolve problems of research areas of education and improve the whole educational process using various statistical techniques, machine learning programming (MLP) and data mining algorithms. Educational data Mining (EDM) is a prospering practice that can be used for analytics and visualization of data, prediction of student performance, student modeling, grouping of students etc. [3].
Educational Data Mining is focused on developing methods to explore the unique and increasingly large dataset which arrives from educational sources and further employing those methods to understand the students and the environment in which they learn in a better way. Educational Data Mining (EDM) is the process to convert raw data from education systems to beneficial information which can be further be used by parents, teachers, educational developers, other educational researchers and students.
In Educational Data Mining, the Student’s performance in academic achievement is the major concerns in the universities[4].The increasing of students attending university has developed the interest in identifying factor to predict academic performance. In higher education, the issue of prediction and explanation of academic performance and a study to identify the key indicators to the academic success and persistence of students are extremely important [5].
II. LITERATURE SURVEY
Romero and Ventura [1], covering the research efforts in the area between 1995 and 2005 in Education domain, and by Baker and Yacef [2] for the period after 2005 in Education domain. Luan [3] discusses in the potential applications of data mining in higher education and explains how data mining saves resources while maximizing efficiency in academics. Understanding student types and targeted marketing based on data mining models are the research topics of several papers [3, 4, 5, 6]. The implementation of predictive modelling for maximizing student recruitment and retention is presented in the study of Noel-Levitz [7]. These problems are also discussed by DeLongetal [8]. The development of enrollment prediction models based on student admissions data by applying different data mining methods is the research focus of Nandeshwar and Chaudhari [9]. Dekkeretal. [10] focus on predicting students drop out. Kovacicin [11] uses data mining techniques (feature selection and classification trees) to explore the socio-demographic variables (age, gender, ethnicity, education, work status, and disability) and study environment (course program and course block) that may influence persistence or dropout of students. Ramaswami and Bhaskaran [12] focus on developing predictive data mining model to identify the slow learners and study the influence of the dominant factors on their academic performance, using the popular CHAID decision tree algorithm. Yuetal[13] explore student retention by using classification trees, Multivariate Adaptive Regression Splines (MARS), and neural networks. Cortez and Silva [14] attempt to predict student failure by applying and comparing four data mining algorithms − Decision Tree, Random Forest, Neural Network and Support Vector Machine. Kotsiantiset al. [15] apply five classification algorithms (Decision Tree, Perceptron-based Learning, Bayesian Net, Instance Based Learning and Rule-learning) to predict the performance of computer science students from distance learning.
III.DATA COLLECTION METHODOLOGY
There are various methods are used to collect the information regarding the students such as we have prepared questions in google spreadsheet and shared it among the students of various institutes. We also have prepared questionnaire in hardcopy and shared it to the students to collect the data. We also have prepared a site along with the questionnaire to collect the data from the institutes. By using these various methodologies we have collected around 3600 student’s data that covers the information like student’s demographic, academic and learning behaviour.
IV.USED TOOLS AND TECHNOLOGY
V. USED PARAMETERS IN RESEARCH
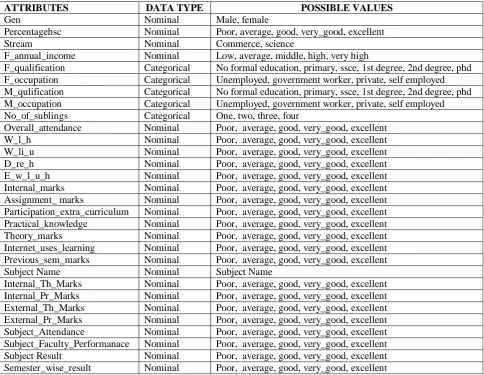
In this research we have used the following student’s parameters to perform the analysis.
Table 1: Used student’s parameter in research work
ATTRIBUTES DATA TYPE POSSIBLE VALUES
Gen Nominal Male, female
Percentagehsc Nominal Poor, average, good, very_good, excellent Stream Nominal Commerce, science
F_annual_income Nominal Low, average, middle, high, very high
F_qualification Categorical No formal education, primary, ssce, 1st degree, 2nd degree, phd F_occupation Categorical Unemployed, government worker, private, self employed M_qulification Categorical No formal education, primary, ssce, 1st degree, 2nd degree, phd M_occupation Categorical Unemployed, government worker, private, self employed No_of_sublings Categorical One, two, three, four
Overall_attendance Nominal Poor, average, good, very_good, excellent W_l_h Nominal Poor, average, good, very_good, excellent W_li_u Nominal Poor, average, good, very_good, excellent D_re_h Nominal Poor, average, good, very_good, excellent E_w_l_u_h Nominal Poor, average, good, very_good, excellent Internal_marks Nominal Poor, average, good, very_good, excellent Assignment_ marks Nominal Poor, average, good, very_good, excellent Participation_extra_curriculum Nominal Poor, average, good, very_good, excellent Practical_knowledge Nominal Poor, average, good, very_good, excellent Theory_marks Nominal Poor, average, good, very_good, excellent Internet_uses_learning Nominal Poor, average, good, very_good, excellent Previous_sem_marks Nominal Poor, average, good, very_good, excellent Subject Name Nominal Subject Name
Internal_Th_Marks Nominal Poor, average, good, very_good, excellent Internal_Pr_Marks Nominal Poor, average, good, very_good, excellent External_Th_Marks Nominal Poor, average, good, very_good, excellent External_Pr_Marks Nominal Poor, average, good, very_good, excellent Subject_Attendance Nominal Poor, average, good, very_good, excellent Subject_Faculty_Performanace Nominal Poor, average, good, very_good, excellent Subject Result Nominal Poor, average, good, very_good, excellent Semester_wise_result Nominal Poor, average, good, very_good, excellent
VI.PROPOSED RESEARCHMODEL
Step-wise procedure for Implementation of Model:
Step 1: Collect the student’s information (Demographic Information, Academic
Information, learning Behavioural Information).
Step 2: Perform the data pre-processing and transformation.
Step 3: Apply Statistical techniques for finding highly affected parameters on students’
performance.
Step 4: Apply various data mining techniques (Classification, Clustering, and Association)
on student data set.
Step 5: Find the Most Optimized Model and generate the knowledge.
OBJECTIVE OF RESEARCH MODEL
•
The result from this study is expected to be used for identifying the factors
influencing students’ academic performance.
•
In addition, the prediction model could be used by management to design special
program for the “outstanding” and the “low” achievers for each degree programme.
•
In this way, students who are expected to do well could be pushed to get the
excellent level.
•
On the other hand, students who are expected to be low achievers could be assisted
to gain better grades upon graduation.
•
This is to ensure the quality of graduates is another sustain or progress in a positive
direction.
VII. SPSSEXPERIMENTAL ANALYSIS
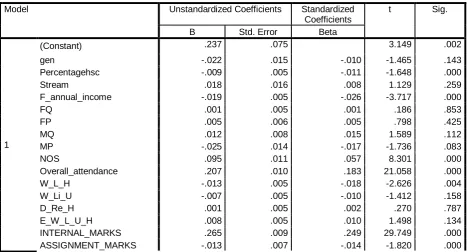
In the following table we have found the coefficient table after performing the statistical analysis into the SPSS tool.
Table 2: Coefficients of used variables
Model Unstandardized Coefficients Standardized
Coefficients
t Sig.
B Std. Error Beta
1
(Constant) .237 .075 3.149 .002
gen -.022 .015 -.010 -1.465 .143
Percentagehsc -.009 .005 -.011 -1.648 .000
Stream .018 .016 .008 1.129 .259
F_annual_income -.019 .005 -.026 -3.717 .000
FQ .001 .005 .001 .186 .853
FP .005 .006 .005 .798 .425
MQ .012 .008 .015 1.589 .112
MP -.025 .014 -.017 -1.736 .083
NOS .095 .011 .057 8.301 .000
Overall_attendance .207 .010 .183 21.058 .000
W_L_H -.013 .005 -.018 -2.626 .004
W_Li_U -.007 .005 -.010 -1.412 .158
D_Re_H .001 .005 .002 .270 .787
E_W_L_U_H .008 .005 .010 1.498 .134
INTERNAL_MARKS .265 .009 .249 29.749 .000
PATICIPATION_EXTRA_C URRICULAM
.002 .008 .001 .196 .000
PRACTICAL_KNOLEDGE .167 .013 .187 12.765 .000
THEORY_MARKS .021 .013 .022 1.592 .000
INTERNET_USES_LEARNI NG
-.248 .016 -.114 -15.145 .003
PREVIOUS_SEM_MARKS .390 .010 .422 37.925 .000
a. Dependent Variable: Sixth_Sem_Result
Result of above coefficient table:
A multiple regression was run to predict Sixth_sem_result from independent variables. These variables statistically significantly predicted Sixth_sem_result, F (21, 3537) = 863.946, p < .0005, So, retain to those variables whose significate level is < 0.0005 and remove those variables whose significance level is > 0.0005 from the model.
Selected highly affected parameters on student’s performance after SPSS analysis:
Table 3: Highly affected parameters on student’s performance
Percentage HSC Assignment_Marks F_Annual_Income Practical_Knowledge W_L_H Theory_Marks
Overall Attendance Internet_Uses_Learning Internal_Marks Previous_Semester_Marks Participation Extra
Curriculum
NOS
Abbreviation:
W_L_H – Weekly Lab Hours
F_Annual_Income – Father Annual Income NOS – No.of Sublings.
VIII. WEKAEXPERIMENTALANALYSIS
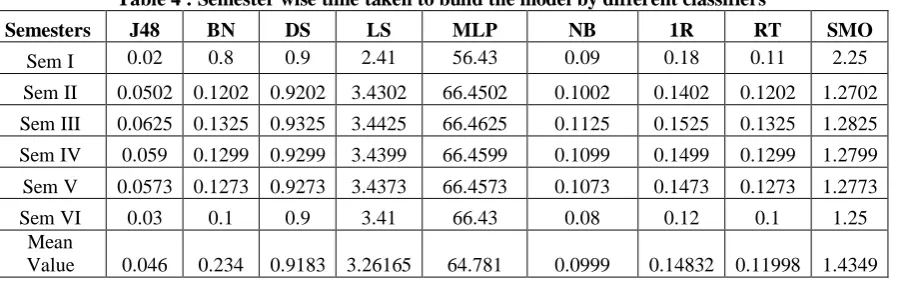
In this weka experimental analysis we have used various classification algorithms like J48, Bayes Net, Decision stump, Logistic Regression, Multi-layer perception, Naïve Bayes, One R, Rep Tree, and sequential minimal optimization . After that we have compared these algorithm using the WEKA tool. The semester wise comparative result is described as per the following in table.
Table 4 : Semester wise time taken to build the model by different classifiers
Semesters J48 BN DS LS MLP NB 1R RT SMO
Sem I 0.02 0.8 0.9 2.41 56.43 0.09 0.18 0.11 2.25 Sem II 0.0502 0.1202 0.9202 3.4302 66.4502 0.1002 0.1402 0.1202 1.2702 Sem III 0.0625 0.1325 0.9325 3.4425 66.4625 0.1125 0.1525 0.1325 1.2825 Sem IV 0.059 0.1299 0.9299 3.4399 66.4599 0.1099 0.1499 0.1299 1.2799 Sem V 0.0573 0.1273 0.9273 3.4373 66.4573 0.1073 0.1473 0.1273 1.2773 Sem VI 0.03 0.1 0.9 3.41 66.43 0.08 0.12 0.1 1.25
Mean
Value 0.046 0.234 0.9183 3.26165 64.781 0.0999 0.14832 0.11998 1.4349
Table 5: Semester wise correctly classified instance by different classifiers
Semesters J48 BN DS LS MLP NB 1R RT SMO
Sem III 99.129 97.4365 71.8864 97.8241 93.8976 98.8984 84.29 96.448 93.5257 Sem IV 99.2695 97.5365 71.9864 98.0241 93.9076 98.9184 84.59 97.438 94.0257 Sem V 99.325 97.6565 72.0264 98.4241 94.7076 98.9284 84.75 97.458 94.1257 Sem VI 99.07 98.4827 59.8764 98.5389 89.157 98.4827 79.29 98.391 89.1
Mean
Value 99.224 97.4935 67.7547 97.942 91.854 98.3515 82.25 97.079 91.700
Table 6: Semester wise in correctly classified instance by different classifiers
Semesters J48 BN DS LS MLP NB 1R RT SMO
Sem I 0.3658 2.5173 39.1236 2.4611 12.8429 2.517 12.708 2.2082 12.899 Sem II 0.88 3.5735 30.1236 2.6859 7.7024 2.601 17.7081 4.652 7.6743 Sem III 0.871 2.5635 28.1136 2.1759 6.1024 1.101 15.7081 3.552 6.4743 Sem IV 0.7305 2.4635 28.0136 1.9759 6.0924 1.081 15.4081 2.562 5.9743 Sem V 0.6743 2.3435 27.9736 1.5759 5.2924 1.071 15.2481 2.542 5.8743 Sem VI 0.92 1.5173 40.1236 1.4611 0.8429 1.517 20.708 1.2082 0.899
Mean
Value 0.7402 2.4964 32.245 2.0559 6.479233 1.648 16.2481 2.7874 6.6325
Table 7: Semester wise kappa statistics rate by different classifiers
Semesters J48 BN DS LS MLP NB 1R RT SMO
Sem I 0.9752 0.9695 0.296 0.9680 0.9686 0.9695 0.6175 0.9737 0.97 Sem II 0.9489 0.9219 0.65646 0.9308 0.8806 0.93168 0.7806 0.9111 0.88 Sem III 0.9489 0.9320 0.67656 0.9359 0.8966 0.94668 0.8006 0.9221 0.89 Sem IV 0.9503 0.9330 0.67756 0.9379 0.8967 0.94688 0.8036 0.9320 0.89 Sem V 0.9509 0.9342 0.67796 0.9419 0.904 0.94698 0.805 0.9322 0.89 Sem VI 0.98 0.9795 0.396 0.9702 0.9786 0.9795 0.7175 0.9737 0.977 Mean Value 0.9590 0.94506 0.5634 0.9474 0.9210 0.9535 0.7541 0.94085 0.92
Table 8: Semester wise Mean Absulate Error by different classifiers (MAE)
Semesters J48 BN DS LS MLP NB 1R RT SMO
Sem I 0.0173 0.021 0.299 0.0256 0.1146 0.021 0.092 0.0256 0.14 Sem II 0.0093 0.013 0.201 0.0076 0.0066 0.013 0.084 0.0076 0.2424 Sem III 0.0103 0.014 0.202 0.0086 0.0076 0.014 0.085 0.0086 0.2434 Sem IV 0.0113 0.015 0.203 0.0096 0.0086 0.015 0.086 0.0096 0.2444 Sem V 0.0123 0.016 0.204 0.0106 0.0096 0.016 0.087 0.0106 0.2454 Sem VI 0.005 0.011 0.199 0.0066 0.0069 0.011 0.082 0.0056 0.24 Mean Value 0.0109 0.0155 0.2189 0.011433 0.02565 0.0158 0.086 0.01126 0.2259
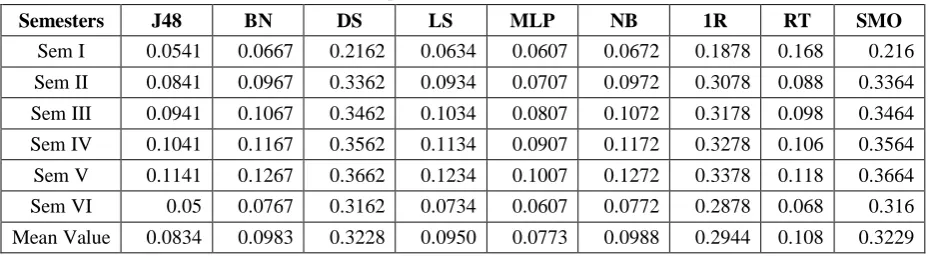
Table 9: Semester Root Mean Squared Error Rate by different classifiers (RMSE)
Semesters J48 BN DS LS MLP NB 1R RT SMO
Used Abbreviation in above tables are: BN - Bayes Net,
DS - Decision stump, LS - Logistic Regression, MLP - Multi layer perception, NB - Naïve Bayes,
IR - One R, RT - Rep Tree
SMO -sequential minimal optimization
Result of Analysis:
We have done experiment using the weka tool. In this experiment analysis we have applied various classification algorithms into the WEKA tool like J48, Bayes Net, Decision stump, Logistic Regression, Multi layer perception, Naïve Bayes, One R, Rep Tree, and sequential minimal optimization and getting the semester wise performance of defined algorithm in respective to the used accuracy measured and error measured parameters. In this analysis we have used accuracy measured parameters like time taken to build the model, correctly classified instances and incorrectly classified instances. In this research we have used error measurement parameters like kappa statistics, mean absolute error (MAE) and Root mean square error(RMSE). After the analysis we concluded that among all the classification algorithms, J48 algorithm gives the highest accurate result and it has the lowest error rate. It also takes the less time to build the model. So, we concluded that J48 gives the highest accurate algorithm.
IX.CONCLUSIONS AND FUTURE SCOPE
Evaluation of students‟ performance and retaining the standard of education is a very important problem in all the educational institutions. Data mining methods are often implemented for analyzing available data and extracting Information and knowledge to support decision-making. In this research paper applied different classification algorithms of data mining those are used for development of a data mining model for predictions of performances of students, on the basis of their personal demographic and academic information. This analysis is done by WEKA tool. Results are in the form of Accuracy of the classifiers and Error Rate of the classifiers. Theses generated results are compared and check that which algorithm is optimal for this types of dataset. As a outcome of observation seen that in both the model J48 algorithm gives the higher accuracy and Lower Error rate.
This analysis work is done by considering only selected types of algorithm this work is expanded by selecting other algorithm also. This work is used in education domain but this generic novel approach can be extended to other disciplines also.
ACKNOWLEDGEMENT
We are grateful to my collegue and friend Mr. Chetan Gondaliya for his valuable guidance and support to improve my research work. We also thank to my friends and colleagues for their kindly support to complete my research paper timely. We also thankful to our principal sir Dr. Satyen parikh sir to inspired us to carried out the research work. We also thankful to our associate professor Dr. Jyotindra N. Dharwa sir for guiding us regarding the data mining concepts. We thanks to all the helping hands those have directly or indirectly support to us.
R
EFERENCES
[1] Romero, C., S. Ventura. Educational Data Mining: A Survey from 1995 to 2005. – Expert Systems with Applications, Vol. 33, 2007, 135-146.
[2] Baker, R., K. Yacef. The State of Educational Data Mining in 2009: A Review and Future Visions. – Journal of Educational Data Mining, Vol. 1, October 2009, Issue 1, 3-17.
[3] Luan, J. Data Mining and Its Applications in Higher Education. – New Directions forInstitutional Research, Special Issue Titled Knowledge Management: Building a Competitive Advantage in Higher Education, Vol. 2002, 2002, Issue 113, 17- 36.
[4] Antons, C., E. Maltz. Expanding the Role of Institutional Research at Small Private Universities: A Case Study in Enrollment Management Using Data Mining. – New Directions for Institutional Research, Vol. 131, 2006, 69-81.
[5] Luan, J. Data Mining Applications in Higher Education. SPSS Executive Report. SPSS Inc., 2004. http://www.spss.ch/upload/1122641492_Data%20mining%20applications%20in%20higher%20education.pdf
[7] Noel-Levitz. White Paper. Qualifying Enrollment Success: Maximizing Student Recruitment and Retention through Predictive Modeling. Noel-Levitz, Inc., 2008. https://www.noellevitz.com/documents/shared/Papers_and_Research/2008/Qualifying EnrollmentSuccess08.pdf
[8] DeLong, C., P. Radclie, L. Gorny. Recruiting for Retention: Using Data Mining and Machine Learning to Leverage the Admissions Process for Improved Freshman Retention. – In: Proc. of the Nat. Symposium on Student Retention, 2007.
[9] http://nandeshwar.info/wpcontent/uploads/2008/11/DMWVU_Project.pdf
[10] Dekker, G., M. Pechenizkiy, J. Vleeshouwer s. Predicting Students Drop Out: A Case Study. – In: Proceedings of 2nd International
Conference on Educational Data Mining (EDM’09), 1-3 July 2009, Cordoba, Spain, 41-50.
[11] Kovaicic, Z. Early Prediction of Student Success: Mining Students Enrolment Data. – In: Proceedings of Informing Science & IT Education Conference (InSITE’2010), 2010, 647-665. Luan, J. Data Mining and Its Applications in Higher Education. – New Directions for Institutional Research, Special Issue Titled Knowledge Management: Building a Competitive Advantage in Higher Education, Vol. 2002, 113, 17-36.
[12] Ramaswami, M., R. Bhaskaran. A CHAID Based Performance Prediction Model in Educational Data Mining. – IJCSI International Journal of Computer Science Issues, Vol. 7, January 2010, Issue 1, No 1, 10-18.
[13] Yu, C., S. DiGangi, A. Jannasch-Pennell, C. Kaprolet. A Data Mining Approach for Identifying Predictors of Student Retention from Sophomore to Junior Year. – Journal of Data Science, Vol.8, 2010, 307-325.
[14] Cortez, P., A. Silva. Using Data Mining to Predict Secondary School Student Performance.EUROSIS.A.Brito andJ.Teixeira,Eds.2008,5-12.