Side-Channel Attacks
Changhai Ou
1, Degang Sun
2, Siew-Kei Lam
1, Xinping Zhou
3, Kexin Qiao
3and Qu Wang
41
School of Computer Science and Engineering, Nanyang Technological University,
Institute of Information Engineering, Chinese Academy of Sciences,
Beijing Unionpay Card Technology Co., Ltd, China,
[email protected],[email protected]. 4
School of Information and Communication Engineering, Beijing University of Posts and Telecommunication,
Abstract. The existing power trace extractors consider the case that the number of power traces owned by the attacker is sufficient to guarantee his successful at-tacks, and the goal of power trace extraction is to lower the complexity rather than increase the success rates. Although having strict theoretical proofs, they are too simple and leakage characteristics of POIs have not been thoroughly analyzed. They only maximize the variance of data-dependent power consumption component and ignore the noise component, which results in very limited SNR to improve and se-riously affects the performance of extractors. In this paper, we provide a rigorous theoretical analysis of SNR of power traces, and propose a novel SNR-centric extrac-tor, named Shortest Distance First (SDF), to extract power traces with smallest the estimated noise by taking advantage of known plaintexts. In addition, to maximize the variance of the exploitable component while minimizing the noise, we refer to the SNR estimation model and propose another novel extractor named Maximizing Esti-mated SNR First (MESF). Finally, we further propose an advanced extractor called Mean optimized MESF (MMESF) that exploits the mean power consumption of each plaintext byte value to more accurately and reasonably estimate the data-dependent power consumption of the corresponding samples. Experiments on both simulated power traces and measurements from an ATmega328p micro-controller demonstrate the superiority of our new extractors.
Keywords:shortest distance first·SDF·MESF·signal-to-noise ratio·SNR·power
trace extractor·side-channel attack.
1
Introduction
Analysis [13], pose serious threats to the security of cryptographic implementations. To improve the attack efficiency, an attacker always tries his best to construct optimal distin-guishers and profile more accurate leakage models to better exploit leaky informations.
The Signal-to-Noise Ratio (SNR) becomes one of the key factors that affect the at-tack performance. They varies with algorithm implementation, hardware devices, sam-pling equipment, etc. For example, the probe is not placed on a reasonable position in electromagnetic attacks, and the implementation is in highly parallel. In this case, classic pre-processing schemes such as power traces alignment [35], averaging [23,25,32], higher-order cumulant [21], dimensionality reduction [6,31] and Points-Of-Interest (POIs) extraction [8], are usually performed before side-channel attacks to “de-noise” [14]. The attacker can obtain power traces with a higher SNR after pre-processing, thus obtaining higher attack performance. This paper considers the attack scenario that the attacker has enough power traces to guarantee his successful attacks. We focus on another powerful pre-processing scheme that recognizes and extracts a part of power traces with high SNR from the original set to lower the computing complexity and make the attacks more efficient. The related works will be given in the next section before introducing our contributions.
1.1
Related Works
Extracting power traces with high SNR to enhance attacks was firstly exploited by Kris et al. in [34]. The SNR of a time sample on power traces is the ratio of the variance of the exploitable power consumption component to the variance of noise (see Section2.1). The power consumption of a POI of the outputs of an S-box could be approximated by a normal distribution. Parts of samples were extracted from both two tails of the distribution to enlarge the variance of the exploitable power consumption component [17]. Therefore, this scheme does not change the variance of noise. For simplicity, we name a power trace extraction scheme as an extractor.
Noura et al. exploited a new leakage model to extract power traces to improve CPA in [27]. Hu et al. proposed an Adaptive Chosen Plaintext Correlation Power Analysis (ACPCPA) in [15]. They tried to solve the problem of discarding too many power traces in the extractor proposed by Yongade et al. in [17]. Specifically, they analyzed the correlation between the Hamming weights of S-box outputs and power consumption of POIs, and got a conclusion that Hamming weights 0, 1, 7 and 8 corresponded to power traces with high SNR. They selected the best two candidates of a sub-key with the largest correlation coefficients in CPA, and encrypted plaintexts having Hamming weights 0, 1, 7 and 8 under them, respectively. Then, the newly acquired power traces were combined together with the original power trace set independently to perform CPA. This extractor was similar to the one given by Haruki et al. in [30] and the improved one given by us in [28], since they also aimed to enlarge the variance of the exploitable power consumption component rather than smaller the noise to improve SNR. The SNR improved by these extractors was very limited.
It is worth mentioning that it is difficult for the existing extractors to obtain a higher success rate [33] than the attack directly performed on the original power trace set. There-fore, we only consider the case that the number of power traces owned by the attacker is sufficient to guarantee his successful attacks, and the goal of his extraction is to lower the complexity rather than increase the success rate. For example, the attacker has very enough power traces to obtain a success rate of 1.00, but the samples are with too large noise and too many samples on power traces, so that he can extract a very small part from them to significantly reduce the computational complexity while achieve the same success rate. This is practical and meaningful.
noise level is high, the distribution of power consumption is seriously affected. In this case, accuracy of recognition of power traces with high SNR greatly reduces. Moreover, the variance of exploitable power consumption component could be improved is also very small compared to variance of noise in many cases. This also indicates that it is far from enough to increase SNR by enlarging the variance of exploitable power consumption component only. How to accurately recognize power traces with high SNR to improve the attack efficiency is still a very important but challenging issue.
1.2
Our Contributions
We aim to build more advanced extractors to recognize power traces with higher SNR, thus enhancing their practical significance and enabling the launch of more efficient attacks. The main contributions of this paper are as follows:
(i) We provide rigorous theoretical analysis of SNR in power traces, and propose a novel extractor named Shortest Distance First (SDF) to extract the power traces with smallest estimated noise rather than enlarging variance of exploitable power consumption. Samples with small noise occupy the majority of the whole signal population, thus providing ample opportunities to improve the SNR. We will show that SDF achieves significantly better performance than the existing extractors. The proposed method paves the way for new directions in power trace extraction.
(ii) To maximize the exploitable component while minimize the estimated noise, we analyze the SNR model of the extracted samples. We further introduce the data-dependent power consumption component exploited in the existing extractors into SDF, and propose a more reasonable extractor called Maximizing Estimated SNR First (MESF) according to this model.
(iii) It is not very good to directly use samples with noise to estimate their exploitable component. Supported by theoretical analysis, it is estimated by utilizing the mean power consumption of each plaintext byte value. Based on this scheme, we further build an extractor called Mean optimized MESF (MMESF), which takes advantage of known plaintexts in the side-channel community.
Experiments show that our new extractors only need a very small part of the original power trace set (e.g., one-tenth) to achieve a similar success rate, which demonstrates their superiority in blind recognition of power traces with high SNR.
1.3
Organization
The rest of this paper is organized as follows: leakage characteristics of POIs, CPA and the existing power trace extractors, which we collectively name TAILS, are introduced in Section2. Our extractor SDF to minimize the estimated noise on power traces is given in Section 3. To further maximize the variance of the data-dependent component, another two extractors MESF and MMESF are introduced in detail in Section 4. Experiments on both simulated power traces and an ATmega328p micro-controller are presented in Section 5 to illustrate the superiority of our new extractors. Finally, we conclude this paper in Section6.
2
Preliminaries
2.1
Leakage Characteristics of POIs
Letx=xj0||x j 1|| · · · ||x
j
15 denote thej-th encrypted plain-text in AES-128 algorithm,κ=
κ0||κ1|| · · · ||κ15denote the 16-byte key used in cryptographic device,zij=Sbox
xji⊕κi
denote the look-up table operation and l(τ) denote the corresponding sample leaked at time τ. The attacker encrypts n plaintexts X = x1, x2, . . . , xn
and acquires n power traces L = l1, l2, . . . , ln
. According to [23], the power consumption of a single sample l(τ) can be modeled as the sum of an operation-dependent component lo(τ), a
data-dependent component ld(τ), electronic noise lel.n(τ), switching noise lsw.n(τ), and the
constant componentlc(τ):
l(τ) =lo(τ) +ld(τ) +lel.n(τ) +lsw.n(τ) +lc(τ). (1)
These 5 components are independent of each other, and the exploitable componentle(τ)
consists of the operation-dependent component lo(τ) and data-dependent component
ld(τ):
le(τ) =lo(τ) +ld(τ). (2)
For a time sample L(τ), the variance of the constant component σ2(L
c(τ)) = 0. For
classic DPA, the attacker only considers one of the 8-bit intermediate values (i.e. the outputs of an Sbox), the power consumption of the other 7 bits is switching noise (i.e. algorithm noise). The variance of switching noise here is larger than 0. For classic CPA considering all bits of intermediate values, the variance of switching noiseσ2(L
sw.n(τ)) =
0.
LetLn(τ) denote the noise component includingLel.n(τ) andLsw.n(τ). The
electron-ic noise is normal distributed. The SNR of the time sample L(τ) is the ratio of variance of exploitable power consumption componentLe(τ) and the variance of noise component.
Thus, SNR can be simplified as:
ˆ
SNR(τ) =σ
2(L e(τ))
σ2(L n(τ))
. (3)
The same conclusion were drawn in Eq. 4.10 in [23]. For simplicity, the variance of 4 components σ2(L
o(τ)), σ2(Ld(τ)), σ2(Lc(τ)) and σ2(Ln(τ)) are expressed as σ2o(τ),
σ2
d(τ), σc2(τ) andσn2(τ).
2.2
Correlation Power Analysis
For all components of power consumption, σ2
d(τ) is the only component correlating to
the leakage model (e.g. Hamming weight model). LetM(τ) denote the assumed leakage model of the intermediate values, the correlation coefficient between it and the total power consumptionL(τ) is:
ˆ
ρ(M(τ),L(τ)) = cov(M(τ),L(τ))
σ(M(τ))·σ(L(τ)). (4)
“cov” here is the covariance matrix operator. Mangard et al. further analyzed the
corre-lation between power consumption and M(τ) in [23]. The important Formula 6.5 given in their paper can be expressed as:
ˆ
ρ(M(τ),L(τ)) = ρˆ(Mq (τ),Ld(τ))
1 + SNRˆ1(τ)
. (5)
Here ˆρ(·,·) is Pearson correlation coefficient operator. For a classic CPA attack, ˆρ(M(τ),Ld(τ))
2.3
Existing Power Trace Extractors
Let R denote the Gaussian distributed noise component Ln with mean 0 and variance
σ2
n,Cdenote the sum of constant componentLcand operation-dependent componentLo.
The leakage of the look-up table operation can be modeled as:
L=HW(Z) +C+R. (6)
Here HW(·) is the Hamming weight function, andZ = z1, z2, . . . , zn
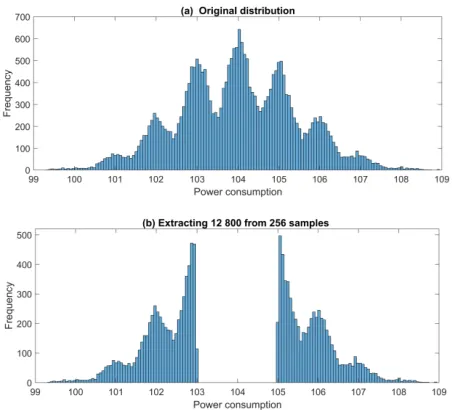
are intermediate values. We simulate 25, 600 power traces and exploit the existing extractors to extract 12, 800 from them. Here C in Eq. 6 is set to 100, noise level σ2
n is set to 0.09, thus
the samples of each Hamming weight inHW(Z) approximately follow normal distribution
N(HW(z),0.09). This small noise is convenient for readers to observe the power
consump-tion distribuconsump-tion of each Hamming weight. The principles of classic power trace extractors are the same. They improve SNR by enlarging the variance of component Ld. Here we
define an evaluation function:
Di(τ) =
li(τ)−M¯ (τ)
(7)
to quantify this, li(τ) denotes the i-th trace in L and ¯M(τ) denotes the mean power
consumption of all traces, which satisfies:
¯
M(τ) = 1 n
n
X
i=1
li(τ). (8)
Here “|·|” denotes the absolute value operator. The extracted power traces from both two tails of the overall normal distribution are shown in Fig. 1. Due to the small noise, the leakage distribution of intermediate values can be well distinguished. For simplicity, we collectively name these power trace extractors as “TAILS”. The extracted values occupy four-fifths of the power consumption region in Fig.1. They have the largest distances from the mean value ¯M(τ) when extracting half of the samples. According to the variance of the estimated data-dependent component:
σ2d(τ) =
1
n−1
n
X
i=1
li(τ)−M¯ (τ)2
, (9)
they are also with the largest σ2
d(τ). It is worth noting that the effect of the noise
component is ignored in the estimation, thus it is biased. In other words, TAILS improves SNR through enlargingσ2
d(τ).
TAILS is a blind recognition algorithm based on distribution of power consumption, while the extractor given by Hu et al. in [15] was based on the distribution of Hamming weights. They selected two candidates of a sub-key with the largest correlation coefficients in CPA, and exploited them to encrypt the plaintexts having intermediate values 0, 1, 7 and 8. They then launched attacks on the newly captured power traces together with the original power trace set independently and achieved a higher success rate that TAILS. In fact, their extractor is to extract the Hamming weights with largest variance from both two tails of Hamming weight distribution. We can simply draw a conclusion that σ2 d
linearly depends on σ2(HW(Z)) (i.e.,σ2 d ∝σ
2(HW(Z)) under very small noise. If these
traces can be well recognized, the variance of data-dependent component σ2(HW(Z))
improves from 2.0078 to 10.3529 in leakage model provided by Eq.6.
Figure 1: Exploiting the scheme of Kim et al. to extract 12, 800 from 25, 600 power traces.
more accurate in this case. It is worth noting that the purposes of maximizing the variance of Hamming weights and maximizing the variance of power consumption σ2(L(τ)) are
both to maximize the variance of data-dependent power consumption σ2
d(τ). In other
words, the principles of the existing extractors are the same, and we will not strictly distinguish them in this paper. However, the Hamming weight based extractor given by Hu et al. in [15] introduces additional power traces with high SNR to improve the SNR of the combined power trace set, and is orthogonal to our original goal. Thus, we do not consider it in our paper.
3
Blind Recognition of Noise
3.1
More accurate SNR Description
This paper considers extracting the power traces with high SNR for more general dif-ferential power attacks [20] (e.g. CPA introduced in Section 2.2), each time sample is considered separately when extracting power traces. Therefore, they have a markτ. Here we push the Eq. 3 provided in [23] a step further. Since the data-dependent component Ld(τ) and operation-dependent componentLo(τ) are independent, Eq.3 can be further
expressed as:
ˆ
SNR(τ) =σ
2(L
o(τ)) +σ2(Ld(τ))
σ2(L n(τ))
. (10)
For a time sample L(τ), its operation on all power traces is usually the same. In this case, the variance of operation-dependent power consumption σ2(L
o(τ)) = 0. SNR can
be further simplified as:
ˆ
SNR(τ) = σ
2(L d(τ))
σ2(L n(τ))
(11)
(i.e., σ2
d(τ)/σ2n(τ)). The Eq. 11indicates that there are two ways to improve SNR, one
is noise reduction, and the other is to enlargeσ2
existing works adopt the second approach. In this section, we adopt the first approach to improve SNR, and show that the new extractor is more superior.
101 101.5 102 102.5 103 103.5 104 104.5 105 105.5 106 106.5 107 power consumption
0 0.2 0.4 0.6 0.8 1 1.2 1.4
N(104,1) N(104,0.1)
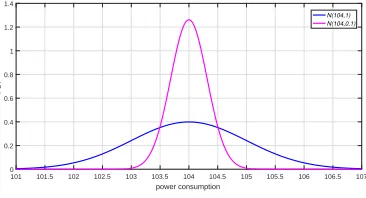
Figure 2: Probability density function ofN(104,1) andN(104,0.10).
Taking two normal distributions with meanµ= 104 and varianceσ2
n = 1 andσ2n= 0.1
shown in Fig.2for an example, most of samples in distributionN(104,0.1) lie closer toµ compared withN(104,1). Since the samples with the largest variance are at both tails, if the same number of samples are extracted from the middle of distributions, the samples corresponding toN(104,0.1) have a smaller variance. Let’s give an intuitive example using the 25, 600 samples in our simulation with σ2
n = 0.09. We rank the samples according
to their noise component, and select 12, 800 samples with minimum noise from them (as shown in Fig. 3). These time samples are very close to the mean power consumption of their corresponding Hamming weights. There are many more samples with low noise in the middle than two tails. Therefore, noise can be reduced by extracting samples close to their mean values. Moreover, reducing σ2
n has more potential to improve SNR than
enlarging σd2. The SNR of the power traces extracted by this is increased by more than
7 times, compared with less than 2 times in TAILS. The noise of the extracted power traces can be infinitely small in theory if there are enough samples to extract. This will be further introduced in Section4.3.
3.2
Optimal Extractor
The optimal extractor if only the noise components Ln(τ) is taken into consideration is
that, the power traces are ranked according to their noise from small to large. This requires the knowledge of key and is only exploitable as an important reference for power trace extraction. Mean power consumption ¯Thwxi of the corresponding Hamming weight of a
plaintext byte valuexi(1≤i≤n) is also required in this case, extractingn′
power traces can ensure that their noise variance is minimum. In this case, the extractor is a profiled attack and we name it IDEAL. We randomly generate 100 samples from the leakage model provided in Eq.6withσ2
n = 30, and extract parts of samples with the smallest noise from
them. Most papers only exploited the result of a single CPA attack to compare the correlation coefficients of different sub-key candidates, which was not accurate enough. Since the correlation coefficient of each candidate under different experiments may be very different, we exploit the average correlation coefficients to measure their variations with the increasing number of power traces (as shown in Fig.4(a)). The corresponding results of CPA are also given, all samples are randomly extracted except for the optimal extractor.
0 10 20 30 40 50 60 70 80 90 100
Number of extracted power traces
0 0.2 0.4 0.6
0.8 (a) Known key extraction
0 10 20 30 40 50 60 70 80 90 100
Number of extracted power traces
0 0.2 0.4 0.6 0.8
1 (b) Unknown key extraction
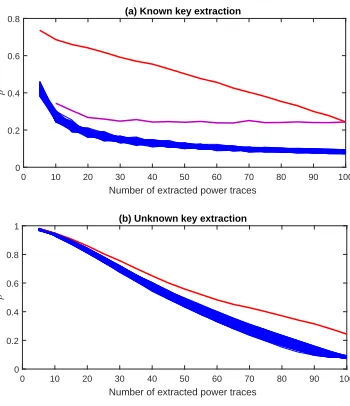
Figure 4: Correlation coefficients under random and optimal extractors.
The mean power consumption ¯Thwxi linearly correlates to the power consumption.
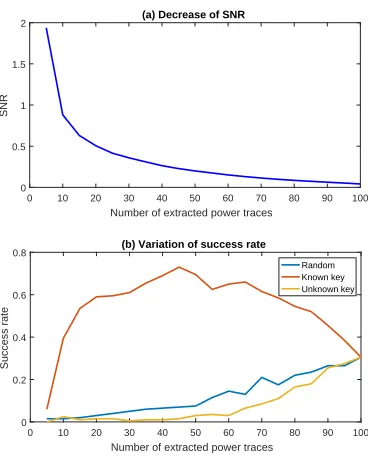
The correlation coefficient will be very high if we perform CPA on these traces and the variance of noise approaches 0. The one corresponding to the correct sub-key in CPA with random power trace extraction is significantly higher than others, but still much lower than the one corresponding to samples with the smallest noise (the upper two curves in Fig.4(a)). The correlation coefficient of IDEAL (red curve) decreases gradually with the increasing number of power traces extracted. Finally, it is consistent with the one corresponding to classic CPA when exploiting all traces. In this case, the SNR of the extracted samples monotonically decreases (as shown in Fig.5(a)).
With the knowledge of key, the noise of power traces can be accurately estimated according to the means ¯Thwxi, and the ones with the highest SNR can be extracted. In
0 10 20 30 40 50 60 70 80 90 100
Number of extracted power traces
0 0.2 0.4 0.6 0.8
Success rate
(b) Variation of success rate
Random Known key Unknown key
0 10 20 30 40 50 60 70 80 90 100
Number of extracted power traces
0 0.5 1 1.5 2
SNR
(a) Decrease of SNR
Figure 5: SNR and success rate under random and optimal extractors.
close to these “templates” may still have large noise under the known key. However, as long as a sample has power consumption close enough to a “template” under the case of unknown key, it will be extracted to launch attacks even if it is wrongly matched. In other words, each guessing sub-key will “frantically” extract the samples that are most beneficial to itself. This will result in very high linear correlation between the means (or templates) and the power traces they extract, and obtaining correlation coefficients even significantly higher than the one corresponding to the correct sub-key under the known key case (as shown in Fig.4(b)). Thus, it is impossible to distinguish the correct key.
The success rate may be even worse than that of random extraction if IDEAL is exploited to extract power traces for each candidate in the case of unknown key (as shown in Fig.5(b)). However, we only achieve a success rate about 0.31 under 100 power traces, the optimal extractor IDEAL achieves the same success rate by only extracting 10 power traces. Although it is impossible to build such a good extractor in reality, IDEAL tells us that with more accurate SNR estimation, success rate can be significantly improved. In other words, it provides a reference for us to build a highly accurate extractor. In the next sections, we will explore how to build such an efficient extractor without knowing the key and make its performance close to IDEAL in the known-key case.
3.3
Shortest Distance First Extractor
For evaluators, leakage detection [26] and assessment [29] are to determine whether a cryp-tographic device leaks information and evaluate the corresponding security level, respec-tively. Compared with the attackers, they have more advantages such as the knowledge of the key, and the ability to capture a very large number of power traces. In this case, the power traces with small noise are easy to accurately estimate and extract. However, the correct key is unknown in the actual attacks, how to improve the accuracy of power trace extraction to approach the success rate limit of optimal extractor IDEAL shown in Fig.5(b) has become an important problem to be solved.
traces owned by the attacker is sufficient to guarantee his successful attacks, and the goal of his extraction is to lower the complexity rather than increase the success rate. Since it is difficult for them to achieve a success rate higher than the attack directly performed on the original power trace set. We have also explained in Section3.2that if we exploit profiled Hamming-weight templates to estimate the noise component of samples and extract a part that best match templates from them, the correlation coefficients of all the candidates are very high, so that profiled attacks cannot be exploited. Here we focus on the most common implicit assumption of the known plaintexts in side-channel society, and take the second-best to compute the mean power consumption of each plaintext byte value for power trace extraction. In this case, although these means may not be so accurately estimated when the power traces are limited, they are a good reference.
Our Shortest Distance First (SDF) extractor is very simple (see Algorithm 1). Suppose that we employ it to extract n′ power traces with minimum estimated noise from the n traces L(τ) = l1(τ), l2(τ), . . . , ln(τ)
leaked at time τ. SDF keeps a counter C to record the current number of power traces of 256 plain-text byte values (Step 2). The corresponding power consumption li(τ) is added to Mxi (Step 3). Here Mxi denotes
the mean power consumption of plaintext byte valuexi. We then averageMand get the
mean power consumption vector of all 256 plain-text byte values after traversing all power traces (Step 5).
Here, we need to clarify the difference between profiled and non-profiled attacks. The former means that the attacker has the same device as the targeted one. He can collect as many power traces as he wishes to profile accurate enough templates and exploits them to launch attacks on the targeted device. The classic profiled attack is TA as we introduced in Section ??. Non-profiled attacks such as classic CPA and DPA, do not have such a profiling stage. The power traces are employed to not only estimate the mean power consumption but also launch attacks in SDF. We can also see the same power traces from L(τ) employed in Steps 3 and 7 of Algorithm 1. They are all from the targeted device, and no additional power traces are introduced when estimating the means. In this case, SDF is still a non-profiled attack.
Algorithm 1:Shortest Distance First (SDF) extractor.
Input: Power tracesL(τ), plain-textsX and the number of traces to be extracted n′
.
Output: The new power trace setL′(τ) and their plain-textsX′.
1 forifrom 1 tondo
2 Cx
i
← Cxi
+ 1;
3 Mx
i
← Mxi
+li(τ);
4 end
5 M ← M/C;
6 forifrom 1 tondo
7 Di ←
l
i(τ)− Mxi ;
8 end
9 (T,P)←AscendSort(L,X,D);
10 L′(τ) =T1...n
′ (τ) ;X′
=P1...n′;
The noise component of a sampleli(τ) (1≤i≤n) in power trace setLcan be blindly
estimated as:
Di=
l
i(τ)− Mxi
(12)
order and get the corresponding re-ranked power trace set T and plaintext byte values P (Step 9). Finally, n′ traces with smallest distances (i.e. smallest estimated noise component) and their corresponding plaintexts are extracted from the firstn′ elements of T andP (Step 10). In this case, the estimated SNR of the extracted power traces inL′ can be expressed as:
ˆ
SNR(τ) =
Pn
′
i=1 T¯hwxi −M¯ (τ)
2
Pn′
i=1 li(τ)−T¯ hwxi2
, (13)
since SNR estimation can exploit the knowledge of key and the well profiled templates. Taking the Hamming weight model given in Eq.6for an example, the values of templates can use 0, 1,. . ., 7 and 8 directly. Since infinite power traces can be exploited to profile sufficiently accurate templates in theory. However, the leakage model is unknown in the real leakage, so we can only employ a large number of power traces in profiling to make the templates as accurate as possible. More advanced profiling technology like leakage certification [5,9], can also be exploited in this case.
It is worth mentioning that the extraction is performed on all rather than only one time sample on power traces, and its target is to launch more efficient attacks. In other words, Algorithm 1 implements on each time sample. The same extractor may extract very different power traces on different time samples. However, this does not go against the purpose of the extractors. Since they aim to maximize the SNR of the power traces extracted from each time sample to achieve the optimal attack from them. The overall optimal attack performance is achieved by combining these single attacks. Therefore, we use time stampτ to indicate the location of leakage in almost all expressions.
4
Bind Estimation of SNR
There have two ways to improve SNR according to Eq.11: one is noise reduction as we introduced in Section3, and the other is to enlarge the variance of data-dependent power consumptionσ2(L
d(τ)). Here we further attempt to enlargeσ2(Ld(τ)) of the extracted
power traces on the basis of the noise reduction introduced in Section 3. Compared to only consider the noise component, blindly estimating the SNR requires the estimation of data-dependent component (see Eq.11). Therefore, SNR estimation will be more accurate than only considering noise estimation.
4.1
Maximizing Estimated SNR
The data-dependent power consumption of a sampleli(τ) can be roughly quantified using
Eq. 7. Maximizing the variance of data-dependent power consumption, is equivalent to maximizingDi(τ). In other words, the larger it is, the greater the data-dependent power
consumption of the sample. This corresponds to TAILS that extracts samples from two tails of the total distribution introduced in Section2.3.
We aim to maximize the SNR, that is, to minimize the noise while maximizing the variance of the data-dependent component. In this case, the evaluation function given in Step 7 of Algorithm 1 can be expressed as:
Di(τ) =
li(τ)−M¯ (τ)
li(τ)− Mx i
. (14)
We can see that Eq.14is an important model for us to estimate SNR. Since the variance of data-dependent power consumption can be estimated asσ2(L
d(τ)) =n1
−1
Pn
i=1 li(τ)−M¯ (τ)
2
as explained in TAILS, and variance of noise can be estimated asσ2(L
n(τ)) = n1
−1
Pn
i=1
li(τ)− Mxi2
maximizingσ2
d while minimizingσn2 can be achieved by maximizingD(τ). We name this
new power trace extractor as Maximizing Estimated SNR First (MESF).
4.2
Mean Optimized MESF
This paper considers the case that the number of power traces is enough to guarantee the successful attack. On one hand, it is not very good to directly exploit li(τ) containing
noise to estimate data-dependent power consumption, which will introduce significant but unnecessary estimation error caused by noise. On the other hand, the attacker may do not have enough power traces to accurately measure mean power consumption for each plain-text byte value. In this case, the accuracy of estimation of the data-dependent component and noise component will also be significantly affected. This estimation error aggravates in the case of very large noise. However, compared withli(τ), the mean power
consumption of each plaintext byte value is still more accurate and theoretically more reasonable in measuring data-dependent power consumption.
Overall, a better strategy is to exploit the mean power consumption of each plaintext byte value when measuring their data-dependent component. In this case, Eq.14can be further optimized as:
Di(τ) =
M
xi
−M¯ (τ)
li(τ)− Mx i
. (15)
We name this new power trace extractor as Mean optimized MESF (MMESF). In fact, all estimates of noise and data-dependent power consumption in Eqs.7, 14and15 are in a blind way. Since these extractors rely on different mathematical principles, their accuracy may vary with a different number of power traces extracted and different noise levels, which will be illustrated in our experiments.
4.3
Comparison
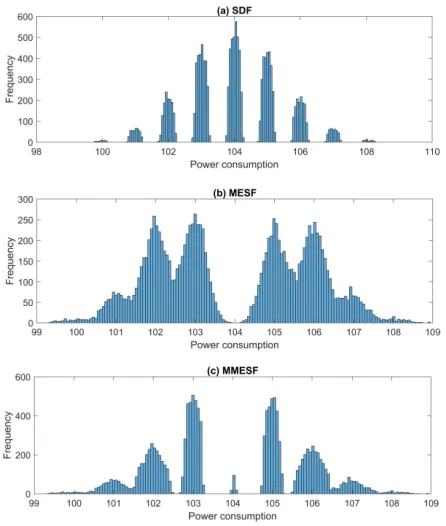
Our three extractors SDF, MESF and MMESF, have great differences in the extracted power traces. Their results of extracting 12, 800 from 25, 600 power traces in Fig. 1 are shown in Fig.6. The SNR of the 25, 600 samples generated by the leakage model in Eq.6
is estimated to be 22.0781 when the noise level σ2
n = 0.09, approaching the theoretical
value 22.3049. SDF is designed to minimize the estimated noise component, and its SNR is about 146.9011, approaching the upper limit 155.8411 of the optimal extractor IDEAL under known key. It can also be seen from Figs.3and6that the traces extracted by them are similar to the optimally extracted ones, which fully illustrates their advantages under small noise.
Figure 6: The samples extracted by different extractors.
degrees, thus improving the success rates. MESF and MMESF achive SNR lower than SDF, but this does not mean that they are worse than SDF. These extractors will be further discussed in Section5.
5
Experimental Results
5.1
Simulations
To compare the performance of extractors under different noise levels, our first experiment is performed on simulated power traces. They are randomly generated from the leakage model provided in Eq.6. We firstly compare the performance of extractors under a dif-ferent number of power traces under the noise levelσn2 = 400. Due to the large noise, too
many traces are required for attacks, which makes the evaluation time-consuming. There-fore, we only repeat the above experiments 200 times, and the corresponding experimental results are shown in Fig.7. To guarantee a stable success rate (SR) about 1.00 for classic CPA, nearly 6 000 traces are required in the original sets. All extractors TAILS, SDF, MESF and MMESF achieve higher success rates than random extraction and even close to the ideal extraction in Figs.7(b) and7(c), which correspond to the case that the attacker has sufficient traces. SDF and MMESF achieve success rates 1.00 even under the poor condition that only 300 traces are extracted, which fully demonstrates their superiority.
50 100 200 400 600 800 1000 Number of extracted traces 0 0.2 0.4 0.6 0.8 1 SR
(a) SR under 6, 000 traces
TAILS SDF MESF MMESF IDEAL RANDOM
50 100200 400 600 800 1000 Number of extracted traces 0 0.2 0.4 0.6 0.8 1 SR
(b) SR under 9, 000 traces
50 100200 400 600 800 1000 Number of extracted traces 0 0.2 0.4 0.6 0.8 1 SR
(c) SR under 12, 000 traces
50 100 200 400 600 800 1000 Number of extracted traces 0 0.02 0.04 0.06 0.08 0.1 0.12 SNR
(d) SNR under 6, 000 traces
50 100200 400 600 800 1000 Number of extracted traces 0 0.05 0.1 0.15 0.2 SNR
(e) SNR under 9, 000 traces
TAILS SDF MESF MMESF
50 100200 400 600 800 1000 Number of extracted traces 0 0.05 0.1 0.15 0.2 0.25 0.3 SNR
(f) SNR under 12, 000 traces
Figure 7: Success rates and SNR (of the extracted traces) under different number of power traces.
traces with high SNR even in the case of very large noise, and 2) SNR has become an important factor determining the success rate. The performance of our extractors SDF and MMESF is also more stable, and the areas with high success rates are significantly wider than that of TAILS. This makes it much easier for attackers to set a reasonable parameter of the number of power traces to extract.
50 100 200 400 600 800 1000
Number of extracted traces
0 0.2 0.4 0.6 0.8 1 SR
(a) SR under 2=250
TAILS SDF MESF MMESF IDEAL RANDOM
50 100 200 400 600 800 1000
Number of extracted traces
0 0.2 0.4 0.6 0.8 1 SR
(b) SR under 2=300
50 100 200 400 600 800 1000
Number of extracted traces
0 0.2 0.4 0.6 0.8 1 SR
(c) SR under 2=350
50 100 200 400 600 800 1000
Number of extracted traces
0 0.05 0.1 0.15 0.2 0.25 SNR
(d) SNR under 2=250
50 100 200 400 600 800 1000
Number of extracted traces
0 0.05 0.1 0.15 0.2 SNR
(e) SNR under 2=300
50 100 200 400 600 800 1000
Number of extracted traces
0 0.02 0.04 0.06 0.08 0.1 0.12 0.14 SNR
(f) SNR under 2=350
TAILS SDF MESF MMESF
Figure 8: Success rates and SNR (of the extracted traces) under different noise levels.
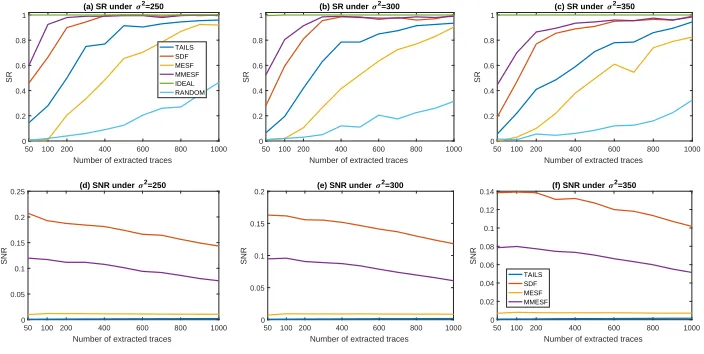
Noise has a great influence on the estimation of mean power consumption of each plaintext byte value, and reduces the accuracy of power trace extraction. Therefore, it is necessary to further discuss its impact on the success rate. In this case, we also consider the success rate and the SNR of the extracted power traces under different noise levels σ2
n = 350, σn2 = 300 and σ2n = 250, the corresponding experimental results are shown
success rates. Although the success rates of TAILS and MESF do not reach such a height when they extract a small number of samples, they increase rapidly when more power traces are extracted. MESF and TAILS not only change the SNR, but also increase the
ˆ
ρ(M(τ),Ld(τ)) in Eq.5. Their success rates benefit from at least these two factors. It is
worth mentioning that the relationship between success rate and the noise is much more complex than this, more details can be seen in [10,36].
The success rate of classic CPA without extraction is about 1.00 underσ2
n= 250 when
randomly generating 4000 power traces to perform attacks. SDF and MMESF achieve success rates even about 1.00 when only extracting 400 traces. If we launch the attacks on more traces, the success rates will be stable thus guaranteeing the key recovery. However, the extractors significantly reduce the number of traces used for attacks thus significantly lowering the computational complexity and highlighting their significance.
50 100 200 400 600 800 1000 Number of extracted traces
0 2 4 6 8 10 12 14
SNR
n=6000,2=400
n=9000,2=400
n=12000,2=400
n=6000,2=250
n=6000,2=300
n=6000,2=350
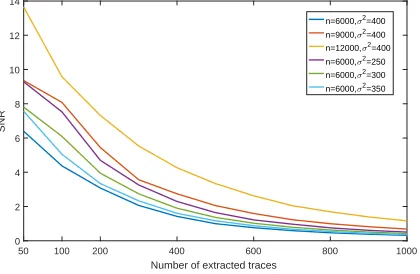
Figure 9: SNR of the traces extracted by IDEAL under different number of power traces and different noise levels.
SNR of the traces extracted by IDEAL under different number of power traces and different noise levels is also shown in Fig. 9. With the increase in the total number of power traces, we can obtain higher SNR if extracting the same proportion from them. On one hand, more traces make the estimation of mean power consumption more accurate. On the other hand, the number of traces with small noise also increases. The decrease of noise level from σ2
n = 400 toσ2n = 350, σn2 = 300 andσ2n = 250 also makes the mean
power consumption more accurate under fewer power traces. Unlike the results given in Section4.3, IDEAL achieves significantly higher SNR than all other extractors. However, SDF and MMESF achieve success rates close to it. They are more accurate compared with other extractors.
5.2
Experiments on ATmega328p Micro-controller
all extractors still have monotonically increasing or decreasing SNR as shown in Fig. 7
and8.
100 400 800 1200 1600 2000
Number of extracted traces 0 0.2 0.4 0.6 0.8 1 SR
(a) SR under 4000 traces
TAILS SDF MESF MMESF IDEAL RANDOM
100 400 800 1200 1600 2000
Number of extracted traces 0 0.2 0.4 0.6 0.8 1 SR
(b) SR under 6000 traces
100 400 800 1200 1600 2000
Number of extracted traces 0 0.2 0.4 0.6 0.8 1 SR
(c) SR under 8000 traces
100 400 800 1200 1600 2000
Number of extracted traces 0 0.005 0.01 0.015 0.02 0.025 SNR
(d) SNR under 4000 traces TAILS SDF MESF MMESF
100 400 800 1200 1600 2000
Number of extracted traces 0 0.01 0.02 0.03 0.04 SNR
(e) SNR under 6000 traces
100 400 800 1200 1600 2000
Number of extracted traces 0 0.01 0.02 0.03 0.04 0.05 SNR
(f) SNR under 8000 traces
Figure 10: Success rates and SNR (of the extracted traces) under different number of traces.
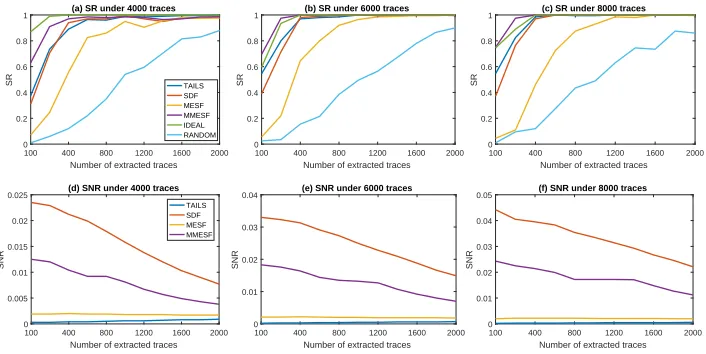
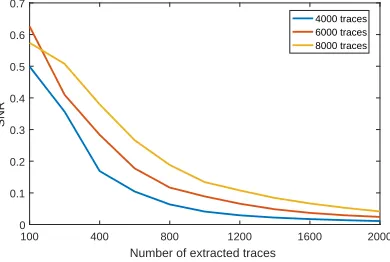
We exploit 1 000 power traces acquired to profile the mean power consumption of each Hamming weight to estimate the SNR more accurately. We then randomly select 4, 000, 6, 000 and 8, 000 power traces from them for extraction. This operation is repeated 200 times, and the corresponding success rates are about 0.990, 1.00 and 1.00. In this case, Fig.10(a) corresponds to the case of insufficient power traces, and Figs.10(b) and10(c) correspond to the case of sufficient power traces. Extracting a small number of power traces can significantly improve the SNR. Almost all extractors achieve a success rate of 1.00 when extracting 400 power traces. Therefore, they significantly lower the complexity compared with the attacks directly performed on the original set.
The experimental results vividly show us that all extractors achieve success rates significantly higher than random extraction. Our SDF almost achieves the same success rates compared with TAILS, while MMESF achieves success rate even higher than IDEAL. This fully illustrates the accuracy of MMESF to exploit the mean power consumption of each plaintext byte value when estimating the data-dependent component. MMESF outperforms SDF because of this component. These means Mxi
xi= 0,1, . . . ,255
are more accurately estimated with the increasing number of power traces, which makes the extraction performance better. They can extract better power traces than other extractors and achieve the highest success rates in most cases. Similar conclusions can also be drawn from Section5.1.
From the aspect of SNR, SDF is superior to MMESF. This indicates that it still accurately extracts the power traces with high SNR even under very large noise. How-ever, SDF ignores the data-dependent power consumption component, thus making its
ˆ
ρ(M(τ),Ld(τ)) smaller than MMESF’s. Therefore, it achieves a success rate lower than
MMESF’s. The SNR of MESF and TAILS is always much lower than that of MMESF. It is worth noting that the SNR of MMESF and SDF decreases when more traces are extracted, just contrary to the SNR of MESF and TAILS. Although this growth is not obvious and even difficult to observe. Similar conclusions can also be drawn from Figs.7
important factors to determine the success rate. For example, the SNR improves with the increasing number of power traces in the original set. This is also an important factor.
100 400 800 1200 1600 2000
Number of extracted traces 0
0.1 0.2 0.3 0.4 0.5 0.6 0.7
SNR
4000 traces 6000 traces 8000 traces
Figure 11: SNR of the traces extracted by IDEAL under different number of power traces and different noise levels.
SNR of traces extracted from the original set with 4, 000, 6, 000 and 8, 000 traces using IDEAL is shown in Fig.11. Compared with the simulated power traces, the composition of real leakage is much more complicated. The extractors achieve SNR about 10 ∼ 15 times lower than the ideal extraction (as shown in Figs.10 and 11). This gap decreases rapidly with a larger proportion of power traces extracted. In terms of success rate, these extractors have achieved outstanding results, but there is still a lot of room for improvement.
6
Conclusions
The power trace extractors are suitable to reduce the computational complexity when the power traces are sufficient, and the existing ones simply extract samples with the largest estimated variance of exploitable power consumption to improve the SNR. Although hav-ing strict theoretical proof, they are too simple and leakage characteristics of POIs have not been thoroughly analyzed. These limits their accuracy on power trace extraction. In this paper, we deeply analyze the SNR of power traces in theory, and propose a novel extractor named SDF to extract the power traces with the smallest estimated noise. SDF can achieve SNR and success rate significantly higher than the existing extractors when the same number of power traces are extracted. Thus, it has wider application sceneries, and opens up a new way for power trace extraction.
To maximize the exploitable component while minimizing the noise, we further pro-pose a novel extractor named MESF. TAILS directly exploits the distance between single sample and population mean as a reference of its data-dependent component. This mea-surement is with noise and not very good. Therefore, we further exploit the mean power consumption of each plaintext byte value to estimate the exploitable power consumption of the corresponding samples, and propose a more advanced extractor named MMESF, which is also more reasonable in theory. The above three extractors show their higher accuracy in extraction. They significantly reduce the computing complexity compared with the existing extractors, which fully illustrates their superiority.
their performance. We will also theoretically analyze relationship between success rate and the noise given in [10,36], and introduce it into the extractors to enhance power trace extraction in our future work.
References
[1] Avr-Crypto-Lib. https://github.com/DavyLandman/AESLib.
[2] D. Agrawal, B. Archambeault, J. R. Rao, and P. Rohatgi. The EM Side-Channel(s).
InCryptographic Hardware and Embedded Systems - CHES 2002, 4th International
Workshop, Redwood Shores, CA, USA, August 13-15, 2002, Revised Papers, pages
29–45, 2002.
[3] A. C. Aldaya, C. P. García, L. M. A. Tapia, and B. B. Brumley. Cache-Timing Attacks on RSA Key Generation. IACR Trans. Cryptogr. Hardw. Embed. Syst., 2019(4):213– 242, 2019.
[4] E. Brier, C. Clavier, and F. Olivier. Correlation Power Analysis with A Leakage Model. InCryptographic Hardware and Embedded Systems - CHES 2004: 6th
Inter-national Workshop Cambridge, MA, USA, August 11-13, 2004. Proceedings, pages
16–29, 2004.
[5] O. Bronchain, J. M. Hendrickx, C. Massart, A. Olshevsky, and F. Standaert. Leakage Certification Revisited: Bounding Model Rrrors in Side-Channel Security Evaluation-s. InAdvances in Cryptology - CRYPTO 2019 - 39th Annual International Cryptology
Conference, Santa Barbara, CA, USA, August 18-22, 2019, Proceedings, Part I, pages
713–737, 2019.
[6] E. Cagli, C. Dumas, and E. Prouff. Kernel Discriminant Analysis for Information Extraction in the Presence of Masking. InSmart Card Research and Advanced Appli-cations - 15th International Conference, CARDIS 2016, Cannes, France, November
7-9, 2016, Revised Selected Papers, pages 1–22, 2016.
[7] S. Chari, J. R. Rao, and P. Rohatgi. Template Attacks. InCryptographic Hardware and Embedded Systems - CHES 2002, 4th International Workshop, Redwood Shores,
CA, USA, August 13-15, 2002, Revised Papers, pages 13–28, 2002.
[8] F. Durvaux and F. Standaert. From Improved Leakage Detection to the Detection of Points of Interests in Leakage Traces. In 35th Annual International Conference on the Theory and Applications of Cryptographic Techniques, EUROCRYPT 2016.
Proceedings, Part I, pages 240–262, 2016.
[9] F. Durvaux, F. Standaert, and S. M. D. Pozo. Towards Easy Leakage Certification.
InCryptographic Hardware and Embedded Systems - CHES 2016 - 18th International
Conference, Santa Barbara, CA, USA, August 17-19, 2016, Proceedings, pages 40–60,
2016.
[10] Y. Fei, A. A. Ding, J. Lao, and L. Zhang. A Statistics-Based Success Rate Model for DPA and CPA. J. Cryptographic Engineering, 5(4):227–243, 2015.
[11] D. Genkin, I. Pipman, and E. Tromer. Get Your Hands Off My Laptop: Physical Side-Channel Key-Extraction Attacks on PCs. InCryptographic Hardware and Embedded Systems - CHES 2014 - 16th International Workshop, Busan, South Korea, September
[12] D. Genkin, A. Shamir, and E. Tromer. RSA Key Extraction Via Low-Bandwidth Acoustic Cryptanalysis. In Advances in Cryptology - CRYPTO 2014 - 34th Annual Cryptology Conference, Santa Barbara, CA, USA, August 17-21, 2014, Proceedings,
Part I, pages 444–461, 2014.
[13] B. Gierlichs, L. Batina, P. Tuyls, and B. Preneel. Mutual Information Analysis. In
Cryptographic Hardware and Embedded Systems - CHES 2008, 10th International
Workshop, Washington, D.C., USA, August 10-13, 2008. Proceedings, pages 426–442,
2008.
[14] S. Hajra and D. Mukhopadhyay. On the Optimal Pre-processing for Non-Profiling Differential Power Analysis. InConstructive Side-Channel Analysis and Secure De-sign - 5th International Workshop, COSADE 2014, Paris, France, April 13-15, 2014.
Revised Selected Papers, pages 161–178, 2014.
[15] W. Hu, L. Wu, A. Wang, X. Xie, Z. Zhu, and S. Luo. Adaptive Chosen-Plaintext Correlation Power Analysis. In Tenth International Conference on Computational Intelligence and Security, CIS 2014, Kunming, Yunnan, China, November 15-16, 2014, pages 494–498, 2014.
[16] Y. Kim and H. Ko. Using Principal Component Analysis for Practical Biasing of Pow-er Rraces to Improve PowPow-er Analysis Attacks. InInformation Security and Cryptology - ICISC 2013 - 16th International Conference, Seoul, Korea, November 27-29, 2013,
Revised Selected Papers, pages 109–120, 2013.
[17] Y. Kim, T. Sugawara, N. Homma, T. Aoki, and A. Satoh. Biasing Power Traces to Improve Correlation Power Analysis Attacks. In Constructive Side-Channel Analy-sis and Secure Design - COSADE 2010 - First International Workshop, Daemstadt,
Germany, February 4-5, 2010, pages 77–80, 2010.
[18] P. C. Kocher. Timing Attacks on Implementations of Diffie-Hellman, RSA, DSS, and Other Systems. In Advances in Cryptology - CRYPTO ’96, 16th Annual Interna-tional Cryptology Conference, Santa Barbara, California, USA, August 18-22, 1996,
Proceedings, pages 104–113, 1996.
[19] P. C. Kocher, J. Jaffe, and B. Jun. Differential Power Analysis. In Advances in Cryptology - CRYPTO ’99, 19th Annual International Cryptology Conference, Santa
Barbara, California, USA, August 15-19, 1999, Proceedings, pages 388–397, 1999.
[20] P. C. Kocher, J. Jaffe, B. Jun, and P. Rohatgi. Introduction to Differential Power Analysis. J. Cryptographic Engineering, 1(1):5–27, 2011.
[21] T. Le, J. Clédière, C. Servière, and J. Lacoume. Noise Reduction in Side Chan-nel Attack Using Fourth-Order Cumulant. IEEE Trans. Information Forensics and
Security, 2(4):710–720, 2007.
[22] F. Liu, Y. Yarom, Q. Ge, G. Heiser, and R. B. Lee. Last-Level Cache Side-Channel Attacks Are Practical. In2015 IEEE Symposium on Security and Privacy, SP 2015,
San Jose, CA, USA, May 17-21, 2015, pages 605–622, 2015.
[23] S. Mangard, E. Oswald, and T. Popp. Power Analysis Attacks - Revealing the Secrets
of Smart Cards. Springer, 2007.
[24] D. Mavroeidis, L. Batina, T. van Laarhoven, and E. Marchiori. PCA, Eigenvector Localization and Clustering for Side-Channel Attacks on Cryptographic Hardware Devices. In Machine Learning and Knowledge Discovery in Databases - European Conference, ECML PKDD 2012, Bristol, UK, September 24-28, 2012. Proceedings,
[25] T. S. Messerges, E. A. Dabbish, and R. H. Sloan. Examining Smart-Card Security under the Threat of Power Analysis Attacks.IEEE Trans. Computers, 51(5):541–552, 2002.
[26] A. Moradi, B. Richter, T. Schneider, and F. Standaert. Leakage Detection with the χ2-test. IACR Trans. Cryptogr. Hardw. Embed. Syst., 2018(1):209–237, 2018.
[27] B. Noura, M. Mohsen, and T. Rached. Optimized Power Trace Numbers in CPA Attacks. InThe 8-th International Multi-Conference on Systems, Signals and Devices,
Sousse, Tunisia, March 22-25, 2011. Proceedings, pages 1–5, 2011.
[28] C. Ou, Z. Wang, D. Sun, X. Zhou, J. Ai, and N. Pang. Enhanced Correlation Power Analysis by Biasing Power Traces. InInformation Security - 19th International
Conference, ISC 2016, Honolulu, HI, USA, September 3-6, 2016, Proceedings, pages
59–72, 2016.
[29] O. Reparaz, B. Gierlichs, and I. Verbauwhede. Fast Leakage Assessment. In Crypto-graphic Hardware and Embedded Systems - CHES 2017 - 19th International
Confer-ence, Taipei, Taiwan, September 25-28, 2017, Proceedings, pages 387–399, 2017.
[30] H. Shimada, Y.-i. Hayashi, N. Homma, T. Mizuki, T. Aoki, and H. Sone. Using Selected-Plaintext Sets for Efficient Evaluation of EM Information Leakage from Cryptographic Devices. In2012 Proceedings of SICE Annual Conference, SICE 2014,
Akita University, Akita, Japan, August 20-23, 2012. Proceedings, pages 64–67. IEEE,
2012.
[31] Y. Souissi, M. Nassar, S. Guilley, J. Danger, and F. Flament. First Principal Com-ponents Analysis: A New Side Channel Distinguisher. In Information Security and Cryptology - ICISC 2010 - 13th International Conference, Seoul, Korea, December
1-3, 2010, Revised Selected Papers, pages 407–419, 2010.
[32] F. Standaert. How (not) to Use Welch’s t-test in Side-Channel Security Evaluations.
IACR Cryptology ePrint Archive, 2017:138, 2017.
[33] F. Standaert, T. Malkin, and M. Yung. A Unified Framework for the Analysis of Side-Channel Key Recovery Attacks. In Advances in Cryptology - EUROCRYP-T 2009, 28th Annual International Conference on the EUROCRYP-Theory and Applications of
Cryptographic Techniques, Cologne, Germany, April 26-30, 2009. Proceedings, pages
443–461, 2009.
[34] K. Tiri and P. Schaumont. Changing the Odds Against Masked Logic. In Selected Areas in Cryptography, 13th International Workshop, SAC 2006, Montreal, Canada,
August 17-18, 2006 Revised Selected Papers, pages 134–146, 2006.
[35] J. G. J. van Woudenberg, M. F. Witteman, and B. Bakker. Improving Differential Power Analysis by Elastic Alignment. In Topics in Cryptology CTRSA 2011 -The Cryptographers’ Track at the RSA Conference 2011, San Francisco, CA, USA,
February 14-18, 2011. Proceedings, pages 104–119, 2011.