Determination of Trace Elements and Possible
Contaminant Source Identification in
Underground Water in Almithnab, Saudi Arabia
1
Wafa Salih Abdelrahman, 2Abdelrazig Mohamed Abdelbagi, 3Tayiser Mohi Eldin Elmahdi 1
Assistant Professor, Department of Physics, College of Science and Arts, Almithnab, Qassim University, Kingdom of
Saudi Arabia. 2
Associate Professor, Department of Physics, Science College, Shaqra University, Da wadami, Kingdom of Saudi
Arabia 2
Omdurman Islamic University, Faculty of Science, Omdurman, Sudan. 3
Lecturer, Department of physics, College of Science and Arts, Almithnab, Qassim University,
Kingdom of Saudi Arabia
ABSTRACT: The goal of the current study was to determine the trace element concentrations in ground water from wells that used for both agriculture purposes and drinking, in the Almathinab, inthe Saudi Arabia. ICP-MS technique was used to detect 16 trace elements in water wells for quality evaluation. The analysis indicates that Ni, Cu, and Zn have lower values than the permissible level, while Mg, P and Sr are exceeding the water international standard levels for agricultural purposes used. The research work reveals Li, B, Na, K, Fe, As, Cr, Si, Au and U are in the acceptable levels. The most elements of drinking water at recommended levels except the element Mg is higher by 6.5 folds and hundredfold of Au in the drinking water compared to WHO guidelines, with a lack of Fe, Ni and the lowest values of Cu and Zn.
The results analysis indicates that the possible source's contamination, which is classified into three sites, maybe due to dissolved materials from the land by rainfall, man-made environmental contamination, and rock aquifer basin. Consequently, the highest level of the gold element in underground water is a probable potential estimation of the feasibility of gold in aquifer rock in the area.
KEYWORDS:Groundwater, trace elements, ICP-MS, source identification, drinking water.
I. INTRODUCTION
Origin groundwater elements concentration relates to different sources of contamination such as; soil, rocks and other contamination of the environment on the surface that lashed by water and penetrated to deep water well [5]. As a matter of fact, the elements in water usually originate from the material dissolved from the soil in water or man-made contamination from other sources of pollution or chemical inorganic and organic elements [6]. The water content elements can be classified due to the fundamental structural properties based on toxicity and benefit of human, animal and plants [7].
Human body, especially needs a certain amount of daily intake of some elements such as Mn, Fe, Cu, Zn, Na and other elements, which is obtained from elements concentrations in drinking water (Yang et al.1988, Mudur, 2000, Singer et al.1985, Parr 1996, Pettersson and Rasmussen 1999, Salonen et al.1992, Mena 1981, Du et al. 2002). However, there are some toxic elements in drinking water such as As and Cr [8]. Several factors are affecting the daily intake of drinking water amount may vary considerably by season, climate, individual and local habits in the district. In fact, human health needs essential metals to maintain proper health, while the excess and lack of these elements are potentially toxic and can impress the living human body systems [9]. Water and food contaminations have an impact on population health and animals due to exposure to high trace elements and mineral contents of the water [10].
Groundwater and surface water composition is widely varied relative with geological condition and climate, which are contained minerals, natural inorganic and organic compounds and gasses. However, drinking water is possible to contain undesirable elements or some constituents for that had been established guidelines and regulation for a safety of drinking water quality internationally [11]. A number of countries and the World Health Organization (WHO) have been established standards of maximum acceptable element's concentration in drinking water guidelines such as inorganic, organic substances and microorganism's [12, and 13]. The possible effects of elements and beneficial constituents of water are motivated researchers to develop the important uses of water by human, animals and industrial processes.
II. RELATEDWORK
Fresh water can be contaminated by biological, toxic, organic and inorganic pollutants, which are potentially hazardous to human life when engaging for a long period of time [11]. More recently attention has focused on the groundwater aquifer affected by pollutants and environmental activities that linked with irregular rainfall in the area, which has a negative impact on human and animal health (Ikem et al. 2002, [13]. Previous studies have reported that the rain in the province reaches the average annual values of 200 to 600 mm, Sharaf & M. T. Hussen, 1996. Several studies investigating the soils in the area are sedimentary, sandstones (SAG formation) and main aquifers that stored a significant amount of ground water, but have been pumped continuously for the last 50 years (Burdon, 1982; Jado & Zotl, 1984; Bureau de Récherches Géologiques et Minières (BRGM), 1985; Jerais, 1986; Edgell, 1987; Segar, 1988; Sowayan & Allayla, 1989; Lloyd & Pim, 1990; Hussein et al., 1992, M. A. Sharaf & M. T. Hussen,1996) [14].
Geological rocks and soil have influenced the elemental concentration in the water wells and the deposit of salts with rain is elevated the groundwater concentration of Na, Mg and that affect local water quality in the district. Although in the region, the drainage system of the rain water and the streams are not connected with river or sea. So that, groundwater basin in the geologic structure is possible include some lake or container with water already exists and aquifer water [15]. Therefore, the saline of groundwater in the area that may be is originating from geologic deposition and the agricultural practices and concentrates naturally occurring salts due to district location away from the sea. The source of surface water in the region, mainly from the rain is used for agriculture irrigation or drinking water for both humans and animals in the locality. Moreover, various sectors in the region are consuming non-renewable groundwater aquifer, which affects the quantity and quality of wells water resources [16].
water brands marketed in Saudia Arabia was done in 1988 by Alam and Sadiq. Some studies are performed by Alabdula'aly and Kan (1995), Alabdula'aly and Kan (1999) and H.A.Ghrefat (2003) using different techniques and methods [18]. There are relatively few historical studies in the area for groundwater in urban and rural in the Qassim province.
The elements in water can be detected quantitatively using the inductively coupled plasma mass spectrometry (ICP-MS) sensitive method to measure more than 55 elements in trace amounts of water. A recent study by Rosborg et al. (2005) determined Cr, Zn, Na, K, Si and Cr and other minerals are found in drinking water, soil and bedrock, [19]. ICP is a partially ionized gas (usually Ar) generated by a quartz torch using a 1–2.5 kW radio frequency power supplies. Pneumatic Nebulizer, used to generate suspended particulate in air (aerosol). These particles are pumped by the effect of the argon gas through a peristaltic pump to the spray chamber (Polymer) [20]. The magnetic field accelerates electrons and ions and collides with argon atoms causing further ionization. The process produced an intense beam that is forming a high -temperature plasma, which is adding energy through RF-induced collision. ICP shows high stability, good reproducibility, very low background level. The physical and chemical characteristics of water quality for drinking have been measured previously in the other part of the Qassim Province (I. S. Al-Salamah and I. N. Nassar, (2009), [17]. This research will serve as a base on element's toxicity for drinking water and other usages, particularly as serving program for data recording.
III.STUDY AREA
Almithnab is located in the centre of Saudi Arabia, approximately Northwest Riyadh and recognize as district part of Qassim province. The district is situated at land height in Qassim is about 620 meters above sea level and latitude for Almithnab is (25°53'- 41.18"N) and the longitude (44°12'- 35.92"E). The climate in the region is typical desert and rain in winter with low humidity. In general, Almithnab has a settlement pattern consists of cultivation palm trees, vegetables and animals surrounded the city, which is considered to be a very important native's culture in the region. The water in the region is originated from the mining of non-renewable groundwater in the province..
IV.EXPERIMENTAL RESULTS
Water samples were collected from eight sites in the area that used for drinking, agricultural, industrial, household and environmental activities in the district. Therefore, water samples may be directly analyzed with little or even no pretreatment for measurement. Trace elements concentration in the water sample was measured using ICP-MS in Elements Analysis Unit at the Research Centre, College of Pharmacy, King Saud University. The measurement was carried out of the elements, Lithium (Li), Arsenic (As), Born (B), Chromium (Cr), Copper (Cu), Magnesium (Mg) Iron (Fe), Gold (Au), Nickel (Ni), Phosphorus (P), Potassium (K), Silicon (Si), Sodium (Na), Strontium (Sr), Uranium (U), Zinc (Zn) in underground water samples.
The data has been subject to different approaches to assessment and statistical analysis. In factor analysis, the factors are considered to be those fundamental parameters that control the values of the obtained data; the variance is distributed between the common factors and the unique factor. Factor analyses are usually used to detect the true size of the cases and to assess the interrelation between the variables and to estimate the importance of each of these actual causal factors to the observed parameter value for each sample. This can be achieved by observing the correlation between each pair of vectors. The correlation between any two unit-length vectors is the cosine of the angle between them. The matrix is calculated according to;
=
In varimax rotation analysis, the variance within each vector is maximized by the perturbation of the eigenvectors. As a result, the number of variables with intermediate loading is decreased, and the number of either very large or very small loading is increased for each vector. The numbers of significant eigenvectors are determined by an appropriate means and the error is ignored [21].
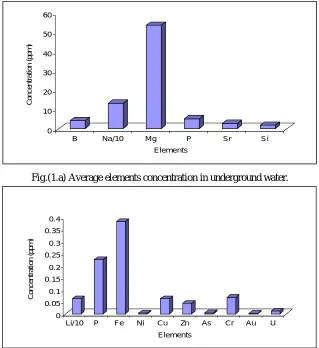
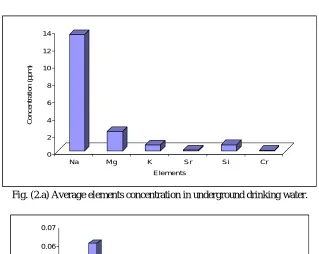
The results of the analysis of the 24 water samples of underground drinking water and agriculture were measured using ICP-MS. The Fig.1 (a & b)) display graphically the underground water averages element concentrations in Almithnab, while the Fig.2 (a, b) is average elements of wells drinking water in the district. Table (1) presents the average elements concentrations in drinking water are compared to the international recommended levels by the WHO and other countries. The first set of evaluation of the element's contents in groundwater examined the correlation between the concentrations of variable elements of different sites in the area. Table (2) shows the correlation of the element concentration data in underground water samples is marked significant at p < 0.05. The extraction method of elements, variations in water assesses using principal component and Varimax normalization (rotated component matrix) analysis is shown in the table (3). From the data in table 4 factors coordinate of sites, and factor scores, based on correlations were obtained. Fig. (3) Display graphically the sites difference relative to the element's concentration variables and factor analysis assessment.
Fig.(1.a) Average elements concentration in underground water.
Fig. (1.b) Average elements concentration in underground water.
0 10 20 30 40 50 60
C
o
n
c
e
n
tr
a
ti
o
n
(
p
p
m
)
B Na/10 Mg P Sr Si
Elements
0 0.05 0.1 0.15 0.2 0.25 0.3 0.35 0.4
C
o
n
c
e
n
tr
a
ti
o
n
(
p
p
m
)
Li/10 P Fe Ni Cu Zn As Cr Au U
Fig. (2.a) Average elements concentration in underground drinking water.
Fig. (2.b) Average elements concentration in underground drinking water.
Table. (1) International recommended elements Levels in drinking water and drinking water in Al Mithnab and some sites irrigation water element levels.
Elements WHO ppm
E.U. ppm
Australia ppm
U.S ppm
Canada ppm
Nigeria ppm
Present study drinking
water ppm
Li 0.7 0.014
B 0.5 1 4 - 5 0.061
Na 50 200 200 ≤200 13.476
Mg 0.4 1 0.2 0.2 2.284
P 0.015 0.044
K 0.27 1-8 0.708
Fe 0.2 0.3 0.3 0.0
0 2 4 6 8 10 12 14
C
o
n
c
e
n
tr
a
ti
o
n
(
p
p
m
)
Na Mg K Sr Si Cr
Elements
0 0.01 0.02 0.03 0.04 0.05 0.06 0.07
C
o
n
c
e
n
tr
a
ti
o
n
(
p
p
m
)
Li B P Sc Cu Zn As Se Rb Au U
Ni 0.07 0.02 0.1 0.02 0.02 0.0
Cu 2 2 2 1.3 1 1 0.001
Zn 3 5 ≤5 3 0.01
As 0.01 0.01 0.007 0.01 0.01 0.01 0.001
Sr 1 0.117
Si ≥1 0.74
Cr 0.05 0. 1 0.05 0.104
Au 1x10⁻⁵ 0.001
U 0.015 - 0.02 0.03 0.02 0.002
Elem
ents Li B Na Mg P K Fe Ni Cu Zn As Sr Si Cr Au U
Li 1.00
B 0.34 - 1.00
Na 0.91
-0.37 1.00
Mg 0.85
-0.23 0.67 1.00
P
-0.35 1.00 -0.38
-0.23 1.00
K 0.92
-0.40 0.74 0.91 -0.40 1.00
Fe 0.88
-0.25 0.61 0.93
-0.25 0.94 1.00
Ni 0.85
-0.11 0.59 0.95
-0.11 0.91 0.98 1.00
Cu
-0.32 1.00 -0.35
-0.21 1.00 -0.38
-0.24 -0.09 1.00
Zn 0.01
-0.20 0.07 -0.09
-0.21 0.21
-0.06 -0.11 -0.21 1.00
As 0.90
-0.17 0.69 0.97
-0.18 0.90 0.96 0.98 -0.15 -0.18 1.00
Sr 0.88
-0.27 0.60 0.86
-0.27 0.91 0.99 0.96 -0.26 -0.07 0.93 1.00
Si 0.27
-0.68 0.37 0.10
-0.69 0.24 0.07 0.02 -0.68 0.11 0.09 0.09 1.00
Cr
-0.53 -0.49 -0.29 -0.59 -0.49 -0.53
-0.68 -0.74 -0.51 0.09 -0.66 -0.66 0.56 1.00
Au
-0.23 -0.18 -0.16 -0.23 -0.19 -0.27
-0.29 -0.27 -0.18 -0.19 -0.20 -0.27 0.69 0.59 1.00
U 0.32 - 1.00 0.36 - 0.19 - 1.00 0.37 - 0.22 - -0.07 1.00 -0.22 -0.14 -0.24 -0.69 -0.52 -0.18 1.00
Tables.3. Extraction method; Principal components and Varimax analysis(rotated component matrix)
Principal component analysis
Component Elements Value range Transformation matrix Component matrix 1 Li, Na, K, Fe, As, Sr 0.786 – 0.974 -
2 B,P,Cu, U 0.856 -0.873 -
3 Au- Si 0.362-0.733 -
varimax (rotated component matrix)
1 Li, Na, K, Fe, As, Sr 0.716 – 0.989 0.974
2 B,P,Cu, U 0.973 -0.968 0.947
3 Au, Si 0.443 -0.794 0.992
Table.4. Factors coordinates of sites, and factors scores, based on correlations.
Factors Factor coordinates Factor scores Sites Factor 1 1.44760-1.93023 0.51230-0.68310 1, 6, 7 Factor 2 0.61200-4.71767 0.27414-2.11324 3, 4, 8 Factor 3 0.34785-2.07419 0.29609-1.76554 2, 5
Projection of the sites on the factor-plane
Active 1
2 3
4
5 6 7 8
-10 -8 -6 -4 -2 0 2 4 6 8
Factor 1: 49.90% -6
-5 -4 -3 -2 -1 0 1 2 3 4 5 6 7
F
a
c
to
r
2
:
3
1
.1
5
%
V. DISCUSSION
The research findings of the underground water data analysis serve as an extensive result for assessment of water quality for drinking and agricultural irrigation. In Fig.1 (a, b) and Fig.2 (a, b), there is a clear trend of decreasing of some element concentrations of drinking water sites compared to other sites used for agriculture irrigation.
The results of groundwater were assessed using principal components analysis, Varimax normalization analysis, factor coordinates and factor Scores analysis, t-test, correlation coefficient and concentration compared to the recommended levels of the WHO, and several countries such as USA, Canadian, Australian, European and Nigerian Standards for drinking water [22, 23, 24]. It is interesting to note that in all eight sites of these study concentrations of 16 elements show different variations of underground water contents.
The statistical analysis shows the correlation between elements Li is highly correlated with Na, Mg, K, Fe, Ni, As and Sr, nevertheless, B is highly correlated with P, Cu and U, while Si is correlated with Au and Cr elements. T-tests were used to assess the relationship between elements of Li, Na, K, Ni, As, Sr, and Au of values in the range of 2.002 – 2.825, although the elements B, P, Cu, Zn and U gives 1.036-1.435 t-values and Mg, Fe in the range of 1.634- 1.825. The elements Si and Cr t-value of 3.444- 5.054 respectively, has highly t-test values compared the previous three groups. However, each set of t-tests values of elements is indicated that the elements in one group related to only one source of water contamination.
Data on principal component assessment elements concentration in the water are based on the correlation values of the elements. In order, to evaluate the elements in water using principal component matrix, three components of elements were obtained. The components apparent in the table (3) show component 1 contains Li, Na, K, Fe, As, and Sr with differentiation of value of components for other elements. There was a significant difference between the two values of component 2 (B, P, Cu and U) and component 3 of Au and Si is highlighted in the table (3). In a table, 3 elements indicate negative values have not appeared in the three components.
Further analysis shows that the Varimax normalization analysis of rotated component matrix in the table. 3 of significant difference between three components (1, (Li, Na, K, Fe, As, Sr), 2, (B, P, Cu, U) 3, (Au, Si)) compared to the sets of elements with higher values of components and high transformation matrix amounts.
The factor coordinates and factor scores of sites vary values of elements in water between different locations in a table. 4. So, three-factor values obtained is interesting because three element groups show the level of elements contains possible to be in the same level variable concentrations. However, other sites in each factor show negative values that are not included in the list of table 4.
This result may be explained by the fact that average concentrations of elements Li, B, Na, K, Fe, As, Si, Cr and U in water wells used for irrigation in the acceptance of international standards for drinking water, while the elements Ni, Cu, and Zn are lower than the permissible level. Other elements, such as Mg higher, P 15 fold, and Sr higher with twofold, although Au much higher value, which making it difficult to determine if these were accumulated [25]. The drinking water quality shows concentrations in recommended levels of the elements Li, B, Na, P, K, As, Sr, Si, Cr and U that are compared to the international standards guides for drinking water quality. The current study found the concentration of some elements is lower than the acceptable levels, such as Cu, Ni and Zn, although the Fe is an essential element in human nutrition missing in the drinking water quality [26]. Another important finding was that the element Mg is higher by 6.5 fold and hundredfold of Au in the drinking water compared to the WHO. A quantitative approach was compared to the water contents with the international recommended guidelines for drinking water in several countries and WHO.
VI.CONCLUSION
The conclusion of this work is finding out information concerning levels of elements exposure in the underground water in Almthinab, since previously no reported data are available for this district. This assignment has explained the underground water for drinking and agriculture irrigation in the eight sites is classified into three parts relative to element variation contained in the water. The results of this investigation show those levels of most elements on optimum requirements for drinking water quality, in addition to the lack of Fe, Ni and the lowest levels of Cu and Zn. Subsequently, the level of toxic Mg of 6.5 folds and Au of hundredfold in drinking water is found to be higher than the accepted level. Consequently, the level of the water well used for irrigation shows the high level of Mg, P fifteen folds, and Sr higher with twofold compared to the drinking water standard levels, which are difficult to determine their accumulation. The confirmation from this study suggests that the metals in the water from three different sources of contamination possibly be linked to types of rocks and soil surface contamination lashed with rainfall and aquifer of the water basin. This work contributes to existing knowledge of the quality of water by providing an assessment of elements in water is to identify potential problems as indicators of probable serious health effects and environmental contamination. The findings of this study have a number of important implications may lead to developing a better and easy diagnostic measure relative to the long-term source exposure in drinking water. Accordingly, the study area can be considered as a possible potential with highly variable contents of gold in underground water that indication of estimation of feasibility in rock aquifer is highly recommended.
ACKNOWLEDGEMENT
The author(s) gratefully acknowledge Qassim University, represented by the Deanship of Scientific Research, on the material support for this research under the number (3147) during the academic year 1437 AH / 2016 AD"
REFERENCES
1. Naif Abdullah Al-Harbi,(2010). Physico-chemical properties of well waters in Al-Yanfa village,Asir region, Saudi Arabia, Journal of Food, Agriculture & Environment Vol.8 No. (3&4), pp.965- 967.
2. Ahmad I. Al-Turki, (2009) Evaluation of well water quality in Heal region on central of Saudi, Arabia, Thirteenth International Water Technology Conference, Hurghada, Egypt IWTC 13.Al-Hasawi Z.M1 and Hussein K.H, (2012), Groundwater investigation in
3. Rabigh Governorate, West of Saudi Arabia, Global Advanced Research Journal of Environmental Science and Toxicology Vol.1(4) pp. 072-079. http://garj.org/garjest/index.htm
4. Abida Farooqi a, Harue Masuda a, Nousheen Firdous, (2007), Toxic fluoride and arsenic contaminated groundwater in the Lahore and Kasur districts, Punjab, Pakistan and possible contaminant sources, Environmental Pollution, ScienceDirect, 145, pp. 895-904.
5. Mushtaq Hussain1, Tvd Prasad Rao Head, (2014), Toxic trace element contamination in ground water of Bollaram and Patancheru, Andhra Pradesh, India, American journal of chemistry, Vol.4(1), pp. 1-9.
6. Simon Kapaj, Hans Peterson, Karsten Liber, and Prosun Bhattacharya, (2006), Human healtheffects from chronic arsenic poisoning– A Review, Journal of environmental science and health part A, Taylor & Francis Group, LLC 41:2399–2428. doi: 10.1080/10934520600873571. 7. Jia-Qian Jiang , S. M. Ashekuzzaman, Anlun Jiang, S. M. Sharifuzzaman and Sayedur RahmanChowdhury, (2013) Arsenic contaminated
8. International journal of environmental research and public health,Vol. 10, pp.18-46.doi:10.3390/ijerph10010018, www.mdpi.com/journal/ijerph.
9. Yousif Algamal, (2015), Assessment and statistical study of physico-chemical properties of water quality in some local water treatment plants in Jeddah, Kingdom of Saudi Arabia, Advances in Applied Science Research, Pelagia Research Library, 6(7),pp.49-56.
10. Z.A. Tayyeb, S.M. Farid and K. A.Otaibi, (2004), Trace element concentration of commercially available drinking water in Makkah and Jeddah,
JKAU: Eng. Sci., vol. 15 no. 1, pp. 149-154.
11. Nagwa S.M. Aly, Rabab M. Ali, and Hemmat A. El badawy, (2013), Assessment of drinking water quality, Life Science Journal 2013, 10(1) http://www.lifesciencesite.com
12. D.S. Abolude, O.A. Davies, and A.M. Chia, (009), Distribution and concentration of trace elements in Kubanni reservoir in Northern Nigeria, Research Journal of Environmental and Earth Sciences, Maxwell Scientific Organization 1(2): 39-44, 2009.
13. Australian Government, National health and medical research council, National water qualitymanagement strategy, (2011), Australian drinking water guidelines6. https://www.westerndesertdialysis.com/20040000%20Aust%20drinking%20water%20
14. David R. Boyd, (2006) Healthy environmental , Healthy Canadians, An international comparisonof drinking water quality , Standard guidelines, David Suzuki Foundation, Healthy Canadian series.nwww.davidsuzuki.org/publications/.../DSF-HEHC-water-web.pdf
15. Deval L.Patrick,Timothy P.Murray, Richard K.Sullivan JR. Kennethl.Kimmell, (2006),
16. Commonwealth of Massachusetts, MASSACHUSETTS drinking waters standards, Department of environmental protection office of research and Standards, Boston ,USA.
17. http://www.mass.gov/eea/agencies/massdep/water/drinking/standards/standards-and- guidelinesfor-drinking-water-contaminants.html.
18. M. A. Sharaf & M. T. Hussen, (1996), Groundwater quality in the Saq aquifer, Saudi Arabia, Hydrological sciences -journal- des sciences Hydrologiques,Vol.4 No. 5, pp. 683- 696.
19. I.S. Al-Salamah and I.N.Nassar, (2009), Trends in drinking water quality for some wells in Qassim, Saudi Arabia, Journal of applied sciences, Vol. 9, No.19pp. 3555-3561.
20. H.A. Ghrefat, (2013), Classification and evaluation of commercial bottled drinking waters in Saudi Arabia Research Journal of Environmental and Earth Sciences, Maxwell ScientificOrganization 5(4): 210-218..
21. John R. Garbarino, Leslie K. Kanagy, and Mark E. Cree, (2006), Determination of elements innatural-water, biota, sediment, and soil samples using collision-reaction cell inductively coupled plasma–mass spectrometry: U.S. Geological, Survey techniques and methods, book 5, sec. B, chap. 1, 88.
22. Rosborg, I., Nihlgård, B., Gerhardsson,L. et al.,(2005), Environmental Geochemistry and Health,Concentrations of inorganic elements in bottled waters on the Swedish market, Vol. 27,No.3,pp 217–227.
23. Charles B. Boss and Kenneth J. Fredeen , (1997), Concepts, Instrumentation and Techniques in Inductively Coupled Plasma Optical Emission Spectrometry, Book, Perkin-Elmer Corporation.
24. A.M.Abdelbagi, M.A.H.Eltayeb, W.S.A/Rahman, M.Z.Elborie,(2011), Source identification ofairborne elements in Industrial Area by XRF technique , Journal of Science and Technology vol.4, pp.824-827.
25. Standards organization of Nigeria, Governing Council, (2007), Nigerian standard for drinkingwater quality, Nigerian industrial standard, Abuja, Nigeria.https://www.unicef.org/nigeria/ng_publications_Nigerian_Standard_f.
26. World Health Organization (WHO), (2008), Guidelines for drinking-water quality, 1st and 2ndaddenda, Vol.1, Recommendations, Geneva.
27. Whqlibdoc.who.int/publications/2011/9789241548151_eng.pdf
28. U. Borgmann a,*, Y. Couillard b, L.C. Grapentine, (2007), Relative contribution of food and water to 27 metals and metalloids accumulated by caged Hyalella azteca in two rivers affected by metal mining, Environmental Pollution, ScienceDirect 145 pp.753-765.
29. Mustafa Bob. Norhan Abd Rahman, Saud Taher , Abdalla Elamin, (2014), Multi-objective assessment of groundwater quality in Madinah City, Saudi Arabia, Water quality expo health, Springer science business Media Dordrecht. DOI 10.1007/s12403-014-0112-z.