Comparative Study on Building Frames with
and Without Soil Structure Interaction
Subjected to Seismic Forces
Arunima Martin1, Dr. M.D Vijayananda 2, Er. Rajesh Harugoppa 3
P.G. Student, Department of Civil Engineering, BIET, Davangere, Karnataka, India1
Professor, Department of Civil Engineering, BIET, Davangere, Karnataka, India2
Structural Engineer, Agushya Civil Engineering Pvt. Ltd., Hubli, Karnataka, India3
ABSTRACT: The present scenario in seismic analysis of a structure is carried out by assuming the column bases to be fixed. In reality, the supporting soil medium influences the behaviour of the structure due to its ability to undergo deformation whereas fixed support ignores these deformations. Current study aims at understanding the effect of Soil Structure Interaction (SSI) in the seismic analysis of a structure. A G+10 symmetrical building with isolated footing resting on medium soil is taken for study. Dynamic linear analysis is performed for the building frames as per IS 1893(part I)-2002 using SAP 2000 software. The SSI is incorporated in the analysis by modelling the soil providing equivalent springs in six degrees of freedom as per George Gazetas formulae and comparison is made between fixed base model and SSI model. From the study it is observed that, there was significant increase in the response of the building from fixed support model to SSI model and the area of column reinforcement demanded by SSI model is more. Depending upon the changes in flexibility of the soil, accordingly the response of the building was also altered. The SSI model with footings of uniform dimension increases the seismic response compared that of with different dimensions. The comparative analysis therefore concludes that conventional method of analysing a structure presuming fixed support is not adequate to assure the structural safety for the buildings especially founded on relatively flexible soil.
KEYWORDS: Soil Structure Interaction, Seismic response, Isolated footing, Linear dynamic analysis, SAP 2000
I. INTRODUCTION
approach, the soil and structure are included within same model and are analysed as a complete system. In substructure approach, the SSI problem is broken down into distinct parts and is combined toformulate the complete solution.
II. OBJECTIVES
The usual method of analysing a structure is carried out by presuming the base to be fixed. Nevertheless, the supporting soil medium also varies the seismic loading and lateral forces acting on a structure. The importance of considering SSI in seismic analysis of structures is well explained from the lessons learnt from past earthquakes neglecting the effect of SSI in the analysis. Seismic response of a structure due to SSI depends upon the properties of both soil and the structure. The following objectives are defined in order to illustrate the effect of considering SSI in seismic analysis of the structure.
1. To study the behaviour of buildings under earthquake excitation with and without Soil Structure Interaction provided with isolated footings.
2. To compare the area of reinforcement required for the building with or without Soil Structure Interaction. 3. To study the effect of Soil Structure Interaction under seismic forces for various modulus of elasticity of soil. 4. To study the effect of Soil Structure Interaction for building frames provided with isolated footings having
same dimensions and with different dimensions.
III.METHODOLOGY AND STRUCTURAL MODELLING
A G+10 building, with ordinary moment resisting frames in two orthogonal directions, is selected for the study. It is considered to be located in Zone V on medium stiff soil, as per IS 1893: 2002. The buildings are modelled using SAP2000 software and dimensions of the members are selected based on the design of the building for gravity loads.
A G+10 building is designed for gravity loadings only, the designed beam and column details such as sizes and reinforcement details are assigned for seismic analysis.
The dynamic linear analysis is carried out for the series I model to study the structural behaviour when subjected to seismic forces, provided with fixed support at the column bases.
In order to incorporate SSI in the analysis with reference to spring model approach, an additional load combination which implies to foundation is assigned to the building model and are analysed.
Based on the column reactions from the analysis results, isolated footings are provided for safe bearing capacity of soil 250 kN/m², SSI in terms of surface spring stiffness are calculated using George Gazetas formulas, assigned for the isolated footing and are analysed to know the response of the structure.
Series II models, building frames with SSI are analysed in the similar manner as mentioned above with change in modulus of elasticity of medium soil for 35000 kN/m² as E35, 50000 kN/m² as E50 and 65000 kN/m² as E65 respectively to study the variations in the structural behaviour associated with it.
Series III models, building frames with SSI are analysed similarly to evaluate the effect of SSI for isolated footings having same dimensions as FSD and with different dimensions as FDD.
Fig 1: Equivalent spring stiffness along six degrees of freedom [14]
Where,
Kx, Ky, Kz = Stiffness of equivalent soil springs along the translational degrees of freedom along X, Y and Z axis.
Krx, Kry, Krz = Stiffness of equivalent rotational soil springs along the rotational degrees of freedom along X, Y and Z
axis.
Table I: Surface Spring stiffness formulae as per George Gazetas [14]
Degrees of freedom Equivalent surface spring stiffness
Vertical [2GL/(1-ν)](0.73+1.54χ0.75) with χ = Ab/4L²
Horizontal(lateral direction) [2GL/(2-ν)](2+2.50χ0.85) with χ= Ab/4L²
Horizontal(longitudinal direction) [2GL/(2-ν)](2+2.50χ0.85)-[0.2/(0.75-ν)]GL[1-(B/L)] with χ =
Ab/4L²
Rocking(longitudinal direction) [G/(1-ν)]Ibx0.75(L/B)0.25[2.4+0.5(B/L)]
Rocking(lateral direction) [3G/(1-ν)]Iby0.75(L/B)0.15
Torsion 3.5G Ibz0.75(B/L)0.4(Ibz/B4)0.2
Where,
Ab = Area of the foundation considered.
B and L = Half-width and half-length of a rectangular foundation.
Ibx, Iby, and Ibz = Moment of inertia of the foundation area with respect to longitudinal, lateral and vertical axes.
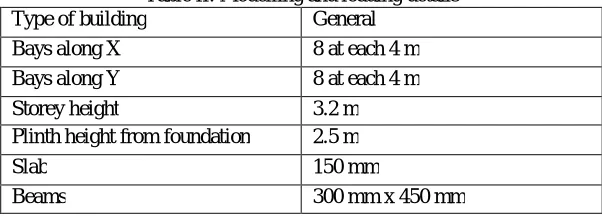
Table II: Modelling and loading details
Type of building General
Bays along X 8 at each 4 m
Bays along Y 8 at each 4 m
Storey height 3.2 m
Plinth height from foundation 2.5 m
Slab 150 mm
Column 500 mm x 500 mm
Wall 230 mm
Parapet height 750 mm
Unit weight of concrete 25 kN/m³
Unit weight of brick 20 kN/m³
Storeys Live load 4 kN/m²
Finish 0.75 kN/m²
Roof Live load with access 2 kN/m²
Finish 1.5 kN/m²
Footing Isolated square footing 3.5 m x 3.5 m with 0.5 m depth
Soil Modulus of Elasticity 35000 kN/m², 50000 kN/m² and
60000 kN/m²
Poisson’s ratio 0.4
The building models are grouped into three series bases on the objectives considered for the study.
Series I: Building model with and without SSI.
(a) (b) (c)
Fig 2 (a,b,c): Plan, elevation and 3D view of building model with fixed base
(a) (b) (c)
Series II: Building models with SSI considering varying modulus of elasticity of soil.
The buildings are modelled with SSI considering varying modulus of elasticity of medium soil i.e. E35, E50 and E65.
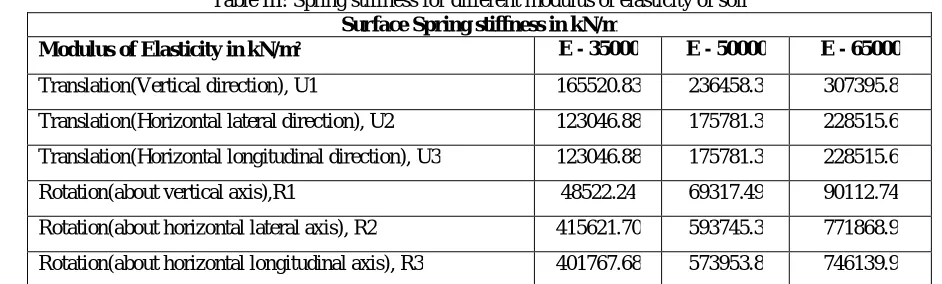
Table III: Spring stiffness for different modulus of elasticity of soil
Surface Spring stiffness in kN/m
Modulus of Elasticity in kN/m² E - 35000 E - 50000 E - 65000
Translation(Vertical direction), U1 165520.83 236458.3 307395.8
Translation(Horizontal lateral direction), U2 123046.88 175781.3 228515.6
Translation(Horizontal longitudinal direction), U3 123046.88 175781.3 228515.6
Rotation(about vertical axis),R1 48522.24 69317.49 90112.74
Rotation(about horizontal lateral axis), R2 415621.70 593745.3 771868.9
Rotation(about horizontal longitudinal axis), R3 401767.68 573953.8 746139.9
Series III: Building models considering SSI provided with isolated footings having same dimension and with
different dimensions.
(a) (b)
IV.RESULTS AND DISCUSSIONS
1. Structural behaviour of building models with or without SSI.
2.1638 2.16392
Fixed base model SSI model
0.0 0.5 1.0 1.5 2.0
T
im
e
p
e
ri
o
d
(
s
e
c
o
n
d
s
) 25475.832
30764.662
Fixed base model SSI model
0 5000 10000 15000 20000 25000 30000
B
a
s
e
s
h
e
a
r
(k
N
)
Fig 5: Variation in Time period for fixed Fig 6: Variation in Base shear for fixed base model and SSI model base model and SSI model
0 2 4 6 8 10 12
0.00 0.05 0.10 0.15 0.20 0.25 0.30
S
to
re
y
d
is
p
la
c
e
m
e
n
t
(m
)
Storeys
Fixed base model SSI model
0 2 4 6 8 10 12
0.000 0.005 0.010 0.015 0.020 0.025 0.030 0.035 0.040
S
to
re
y
d
ri
ft
(
m
)
Storeys
Fixed base model SSI model
588.7236
642.2665
Fixed base model SSI model
0 100 200 300 400 500 600
C
o
lu
m
n
b
e
n
d
in
g
m
o
m
e
n
t
(k
N
-m
)
240.842
1143.079
Fixed base model SSI model
0 200 400 600 800 1000 1200
C
o
lu
m
n
s
h
e
a
r
fo
rc
e
(
k
N
)
Fig 9: Variation in Column bending moment for fixed Fig 10: Variation in column shear force for fixed base model and SSI modelbase model and SSI model
1817.022
2151.87
Fixed base model SSI model
0 500 1000 1500 2000
A
x
ia
l
fo
rc
e
(
k
N
)
Fig 11: Variation in Column axial force for fixed base model and SSI model
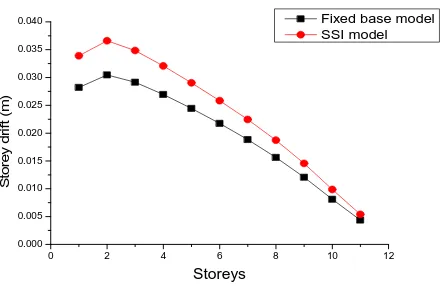
The variation in time period is just marginal for fixed base model and SSI model. The increase in base shear is about 17.2% from fixed base model to SSI model.The storey displacements are gradually increased with increase in the number of storeys and this trend of increase is more in case of SSI model compared with fixed base model as the flexible base provided by the SSI model decreases the stiffness of the structure which results in an increased displacement. The increase in roof displacement is about 16.5% in SSI model in comparison with fixed base model whereas the increase in storey displacements at bottom storeys is negligible.The storey drift shows a drastic increase by
2. Area of reinforcement for building model with and without SSI
11830
12675
Fixed base model SSI model
0 2000 4000 6000 8000 10000 12000
A
re
a
o
f
c
o
lu
m
n
r
e
in
fo
rc
e
m
e
n
t
(m
m
2)
1738 1773.2
Fixed base model SSI model
0 200 400 600 800 1000 1200 1400 1600 1800
A
re
a
o
f
b
e
a
m
r
e
in
fo
rc
e
m
e
n
t
(m
m
2)
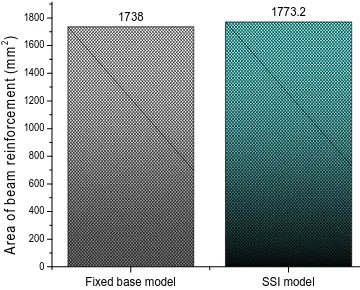
Fig 12: Variation in area of column reinforcement Fig 13: Variation in area of beam reinforcement for fixed base model and SSI modelfor fixed base model and SSI model
When SSI is incorporated in a building model, the rigidity of base of the building is reduced which ends up in affecting the strength and stiffness parameters of the building in a decreasing manner resulting in more bending moment and shear force and hence more is the reinforcement demand in SSI model. The increase in area of column reinforcement is about 7% and the increase in area of beam reinforcement is about 2% from fixed base model to SSI model.
3. Effect of SSI for varying modulus of elasticity of soil.
2.17022 2.16392 2.1629
E35 E50 E65 0.0 0.5 1.0 1.5 2.0 T im e p e ri o d ( s e c o n d s )
Modulus of elasticity
33876.02
30764.662
22783.202
E35 E50 E65
0 5000 10000 15000 20000 25000 30000 35000 B a s e s h e a r (k N )
Modulus of elasticity
Fig 14: Variation in time period for different Fig 15: Variation in base shear fordifferent modulus of elasticity of soil modulus of elasticity of soil
0 2 4 6 8 10 12
0.00 0.05 0.10 0.15 0.20 0.25 0.30 0.35 S to re y d is p la c e me n t (m) Storeys E35 E50 E65
0 2 4 6 8 10 12 0.000 0.005 0.010 0.015 0.020 0.025 0.030 0.035 0.040 0.045 S to re y d ri ft ( m ) Storeys E35 E50 E65
Fig 16: Variation in storey displacement for Fig 17: Variation in storey drift for different modulus of elasticity of soil different modulus of elasticity of soil
708.3294
642.2665
476.035
E35 E50 E65 0 100 200 300 400 500 600 700 C o lu m n b e n d in g m o m e n t (k N -m )
Modulus of elasticity
1277.658
1143.079
815.903
E35 E50 E65
0 200 400 600 800 1000 1200 C o lu m n s h e a r fo rc e ( k N )
Modulus of elasticity
2351.76
2151.87
1585.54
E35 E50 E65
0 500 1000 1500 2000 2500 A x ia l fo rc e ( k N )
Fig 20: Variation in Column axial force fordifferent modulus of elasticity of soil
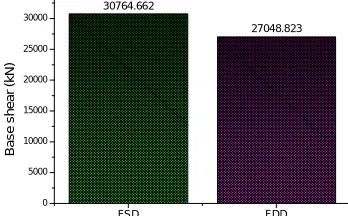
4. Building frames considering SSI provided with isolated footings having same dimension and with different dimensions. 2.16392 2.1702 FSD FDD 0.0 0.5 1.0 1.5 2.0 T im e p e ri o d ( s e c o n d s ) 30764.662 27048.823 FSD FDD 0 5000 10000 15000 20000 25000 30000 B a s e s h e a r (k N )
Fig 21: Variation in Time period for FSD Fig 22: Variation in base shear for FSD and FDD model and FDD model
0 2 4 6 8 10 12
0.05 0.10 0.15 0.20 0.25 0.30 S to re y d is p la c e m e n t (m ) Storeys FSD FDD
0 2 4 6 8 10 12
0.005 0.010 0.015 0.020 0.025 0.030 0.035 0.040 S to re y d ri ft ( m ) Storeys FSD FDD
642.2665 628.24
FSD FDD
0 100 200 300 400 500 600
C
o
lu
m
n
b
e
n
d
in
g
m
o
m
e
n
t
(k
N
-m
)
1143.079
846.78
FSD FDD
0 200 400 600 800 1000 1200
C
o
lu
m
n
s
h
e
a
r
fo
rc
e
(
k
N
)
Fig 25: Variation in Column bending moment Fig 26: Variation in Column shear force for FSD and FDD model for FSD and FDD model
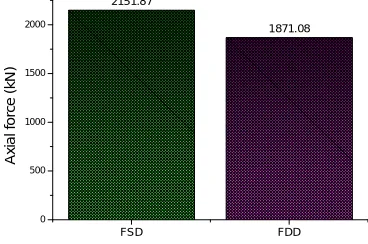
2151.87
1871.08
FSD FDD
0 500 1000 1500 2000
A
x
ia
l
fo
rc
e
(
k
N)
Fig 27: Variation in Column axial force for FSD and FDD model
The change in footing dimensions for SSI model does not show a signicant effect in case of time period. The base shear decreases by about 12% from FSD to FDD model as FSD model provides more surface area for deformation than the FDD model. The decrease in storey displacement and storey drift is about 12% in FDD model in comparison with the FSD model.Since FDD model offers less area for deformation when subjected to seismic excitation, more will be the lateral resistance offered by the structure because of the strength of the structure owing to less bending moment, shear force and axial force. The decrease in column bending moment is about 3%, shear force is about 25% and axial force is about 13% from FSD to FDD model
.
V. CONCLUSIONS
The inclusion on SSI in the seismic analysis allows significant changes in the seismic response of a structure compared to the conventional fixed base model.
The increase in Natural time period in SSI model is only marginal; whereas the other parameters like Base shear, Storey displacement, Storey drift, Column bending moment, Column shear force increases by 17.2%, 16.5%, 17%, 9% and 78% respectively. Hence, evaluation of these parameters neglecting SSI may lead to factual error in the seismic design.
The strength and stiffness parameters of the structure reduce considerably with the incorporation of SSI in the seismic analysis which results in requirement of more reinforcement. The area of column reinforcement demanded by SSI model is 7% more than the fixed base model.
The seismic response of a structure decreases with increase in modulus of elasticity of the soil making the soil stiffer with reduction in flexibility.
The isolated footings of uniform dimension provided in SSI model allows more surface area for deformation which leads to marginal increase in time period whereas increase in base shear, Storey displacement, Storey drift is about 12% and increase in Column bending moment, shear force and axial force is about 3%, 25% and 13%; Grouping of isolated footings to different dimensions as required is therefore preferable.
Finally the study concludes that, the conventional method of analysing a structure neglecting SSI is not adequate to assure the resistance against lateral forces when subjected to seismic excitation especially when founded on relatively flexible soil.
REFERENCES
1. Nithya Chandran J, Abhilash Rajan, Soni Syed, “Seismic analysis of Building with Underground Stories considering Soil Structure Interaction” International Journal of Emerging Technology and Advanced Engineering, Volume 4, Issue 11, November 2014.
2. Halkude S.A, Kalyanshetti M.G and Barelikar S.M “Seismic Response of R.C. Frames with Raft Footing Considering Soil Structure Interaction” International Journal of Current Engineering and Technology, Accepted 10 May 2014, Available online 01 June 2014, Vol.4, No.3. 3. Umal Chandekar, A. P. Khatri “Effect of Soil Structure Interaction on Seismic Analysis of Structure” Journal of Civil Engineering and
Environmental Technology, Volume 2, Number 11; April – June 2015, pp 83 – 88.
4. Deepa B. S., Nandakumar C.G “Seismic soil structure interaction studies on Multi-storey frames” International Journal of Applied Engineering Research and Development (IJAERD),Vol.2, Issue 1, Mar 2012.
5. Mr. Magade S. B, Prof. Patankar J. P “Effect of Soil Structure Interaction on the Dynamic Behavior of Buildings” IOSR Journal of Mechanical and Civil Engineering (IOSR-JMCE) ISSN: 2278-1684, PP: 09-14.
6. Raveesh Bhat, S. A. Warad “Seismic Evaluation of RC Building Considering Soil-Structure Interaction” The International journal of Science and Technoledge, PGH.CET, Bijapur, India.
7. Pallavi Badry, Dr. Neelima Satyam “Seismic Soil Structure Interaction analysis of piled raft supported asymmetrical buildings” International Institute of Information Technology, Hyderabad, Available online from 07 April 2016.
8. Dr. B K Maheshwari “Geotechnical issues and foundation design of tall building” Indian Institute of Technology, Roorkee. 9. IS 456:2000, “Plain and Reinforced Concrete - Code of Practice”, Bureau of Indian Standards, 2000 New Delhi.
10. IS 1893, “Criteria for Earthquake Resistant Design of Structures (part 1) General Provisions and Buildings (Fifth Revision)”, Bureau of Indian Standards, 2002 New Delhi.
11. Halkude S.A, Kalyanshetti M.G and Barelikar S.M “Soil Structure Interaction effect on seismic response of RC frames with isolated footing” International Journal of Engineering research and Technology, ISSN 2278-0181, January 2014, Vol.3 issue 1.
12. Agarwal Pankaj, Shrikhande Manish, “Earthquake resistant design of structures”, Prentice Hall of India Private Limited, 2010, New Delhi. 13. Bowles, J.E. (1998), “Foundation Analysis and design”, McGraw Hills, New York.
14. George Gazetas, (1991) Member, ASCE, “Formulas and charts for impedances of surface and embedded foundations.”