ABSTRACT
JEYARAJAH, ELIAS JOSEPH. Development and Validation of a 1H NMR Method for Lipoprotein Quantification and Coronary Heart Disease Risk Assessment. (Under the
direction of James Dorian Otvos, chair and Edmond F. Bowden, co-chair.)
There is abundant evidence that the subclasses within a given lipoprotein class differ in their associations with coronary heart disease. Since subclass distributions can vary widely from person to person, individuals with the same levels of LDL cholesterol and HDL cholesterol may be at different cardiovascular risk and respond differently to dietary and drug therapy. Unfortunately, existing laboratory methods of subclass measurement are too time-consuming and expensive to be used in routine clinical practice. Using a new approach to lipoprotein analysis that exploits the natural proton NMR spectroscopic differences exhibited by lipoprotein particles of different size, we have developed a new quantitative NMR
technology for use in clinical laboratory medicine. The newly developed NMR LipoProfile
assay rapidly and simultaneously quantifies the lipoprotein subclass particle concentrations of 10 lipoprotein species (3 VLDL, IDL, 3 LDL and 3 HDL) with good intraassay and
interassay precision. Extensive validation studies were conducted that established robustness of the NMR lipoprotein particle assay. The average particle sizes of the major lipoprotein classes determined by NMR correlate very well with those estimated by gradient gel electrophoresis. Emerging clinical data from several coronary disease outcome studies indicate that NMR-derived lipoprotein particle parameters are superior predictors of cardiovascular disease risk compared to traditional cholesterol risk factors. The speed and efficiency of NMR lipoprotein subclass profiling make it a potentially valuable research tool and cost-effective means of assessing and managing heart disease risk in the general
DEDICATION
This dissertation is dedicated to the
BIOGRAPHY
Elias Joseph Jeyarajah was born in Naranthanai, Ceylon (now Sri Lanka) to Sebastiampillai and (late) Ponrose Elias on August 25, 1955. He grew up with sisters Nirmala and Vathsala, and, brothers Ponraj and Nithianandarajah. He studied at St. Anthony’s College, Kayts and then St. Patrick’s College, Jaffna. He earned his B.Sc. at University of Jaffna, in 1980
majoring in Chemistry. He received his Masters of Science in Biophysical Chemistry in 1985 at SUNY Stony Brook. He has worked at University of Wisconsin, Milwaukee (1987-1990), and North Carolina State University Biochemistry department (1990-2000) with Professor James D. Otvos researching lipoproteins using NMR spectroscopy. While at NC State he enrolled in the graduate program in the Analytical Division of the Department of Chemistry to earn his Ph.D. He is employed at LipoScience, Inc., (Raleigh, NC) as Director of NMR Applications. He is married to Shanthini and blessed with daughters Shoumini and
ACKNOWLEDGEMENTS
I would like to thank my research advisor, Dr. James D. Otvos, for his guidance and leadership during the course of this research, and during the long and fruitful association I have had with him. His unstinting support for my educational aspirations made this possible while earning a living and raising a family.
I thank Dr. Dennis Bennett of University of Wisconsin, Milwaukee for contributing to this research immensely through the development of the deconvolution software. I thank the Department of Chemistry at NC State and the faculty of the Analytical Chemistry division for molding me into the analytical chemist I am. My special thanks to my co-advisor Dr. Ed Bowden, for all his valuable support, help and advice.
I would like to thank Qun Zhou for her indispensable technical assistance in lipoprotein isolations. My thanks to Dr. Irina Shalaurova and Dr. David Morgan for their collaboration in advancing the NMR technology to clinical medicine.
TABLE OF CONTENTS
ABBREVIATIONS ... viii
LIST OF TABLES ... ix
LIST OF FIGURES ...x
Chapter 1: Introduction and Background ...1
1.1 Lipids and Coronary Heart Disease ...1
1.2 Lipoproteins: Definition, Structure, Function ...3
1.2.1 Composition of Lipoproteins ...3
1.2.2 Lipoprotein Structure ...6
1.2.3 Nomenclature and Classification of Lipoproteins ...6
1.2.4 Apolipoproteins and Lipoprotein Metabolism ...8
1.3 Measurement of Lipoproteins ...10
1.3.1 Measurement of lipids as surrogates for lipoproteins ...10
1.3.2 Lipoprotein subclass measurement ...11
1.3.3 Limitations of current methods for lipoprotein subclass analysis ...12
1.4 NMR spectroscopy of blood plasma ...13
1.4.1 Lipoprotein subclass measurement by NMR ...13
1.4.2 Advantages of lipoprotein subclass analysis by NMR ...18
1.4.3 Alternate NMR approaches ...19
1.5 Overview of chapters to follow ...19
Chapter 2: Experimental: Building Blocks of the NMR LipoProfile test ...21
2.1 Isolation of lipoproteins ...21
2.2 Characterization of lipoproteins ...24
2.2.1 Chemical analysis ...24
2.2.2 Electron microscopy ...24
2.2.3 Gradient gel electrophoresis ...27
2.3 NMR spectroscopy ...27
2.5 NMR lineshape deconvolution ...32
2.6 Output of deconvolution: NMR LipoProfile ...34
2.7 Correlation with chemical lipids ...39
Chapter 3: Analytical Characterization and Validation of an Automated NMR Spectroscopic Method for Quantifying Lipoprotein Subclass Particles ...41
Background ...42
Methods ...42
Results ...43
Conclusion ...43
Materials and Methods ...47
Blood Samples ...47
Lipoprotein Isolations ...47
Chemical Analysis ...48
Gradient Gel Electrophoresis ...48
Electron Microscopy ...49
NMR Spectroscopy ...49
Deconvolution ...50
Standard Addition Studies ...51
Results ...52
Lipoprotein Characterization ...52
NMR Signal Area and Lipid Mass Concentrations ...60
Standard Addition Studies: Specificity and Linearity of Response ...61
Comparison of LDL and HDL Particle Size Distributions Determined by NMR and GGE ...76
Correlation with Chemically Measured TG and HDL-C ...79
LDL Particle Concentration and Apo-B ...82
Precision Study ...87
Normal Ranges and Intercorrelations ...90
Discussion ...93
References ...99
Chapter 4: Measurement Issues Related to Lipoprotein Heterogeneity ...102
Abstract ...103
Prevalence and Metabolic Origins of LDL Cholesterol Compositional
Variability ...106
Lipoprotein Quantification by NMR Spectroscopy ...110
Clinical Implications of the Disconnect Between LDL Cholesterol and LDL Particles in Patients with Low HDL Cholesterol- Insights from the Framingham Offspring Study ...113
Prevalence of the Disconnect Between LDL Cholesterol and LDL Particles ...116
References ...119
Chapter 5: Discussion ...122
5.1 Advantages of NMR method for lipoprotein testing ...122
5.2 Interferences ...122
5.3 Stability of plasma for NMR analysis ...124
5.4 Miscellaneous ...125
Conclusion ...126
ABBREVIATIONS
ApoB apolipoprotein B
CAD coronary artery disease
CE cholesterol ester
CETP cholesterol ester transfer protein
CHD coronary heart disease
CV coefficient of variation
GGE gradient gel electrophoresis
HDL high-density lipoprotein
IDL intermediate density lipoprotein LCAT lecithin:cholesterol acyltransferase
LDL low-density lipoprotein
LDL-P LDL particle concentration
NCEP national cholesterol education program
NMR nuclear magnetic resonance
PCA principal component analysis
PL phospholipid
PLS partial least squares regression SVD singular value decomposition
TC total cholesterol
TG triglyceride
TMA trimethylacetate
LIST OF TABLES
Chapter 1:
Table 1.1 Classification and Physical Properties of Lipoproteins ...8 Table 1.2 Apolipoproteins and Functions ...9
Chapter 3:
Table 1: Diameter Ranges for Lipoprotein Subclasses Measured by NMR ...60 Table 2: Intraassay and Interassay Measurement Precision for
NMR LioProfile-II ...88 Table 3: Normal Ranges (10th – 90th percentile) for
NMR LipoProfile-II Parameters ...91 Table 4: Inter-correlations Between Parameters in
NMR LipoProfile-II Report ...92
Chapter 4:
Table 1: High –Risk Subjects in the Framingham Offspring Study
According to LDL Particle Concentration and LDL Cholesterol ...118 Table 2: Low-Risk Subjects in the Framingham Offspring Study
LIST OF FIGURES
Chapter 1:
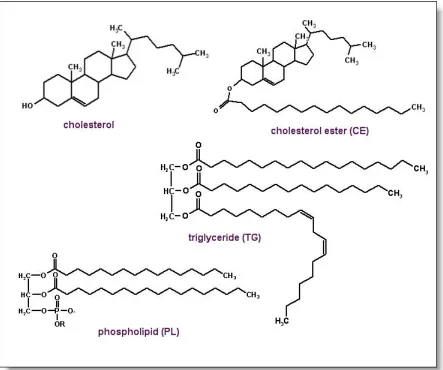
Figure 1.1. Chemical structure of cholesterol and lipids ...5
Figure 1.2. Schematic representation of a lipoprotein particle ...6
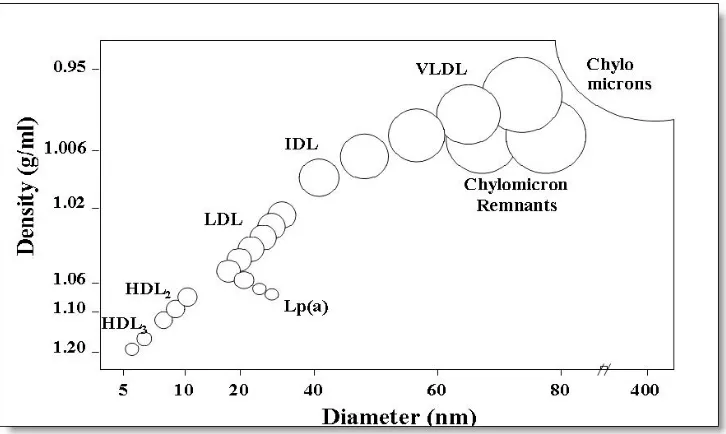
Figure 1.3. Relationship of particle size and density of lipoprotein subclasses ...7
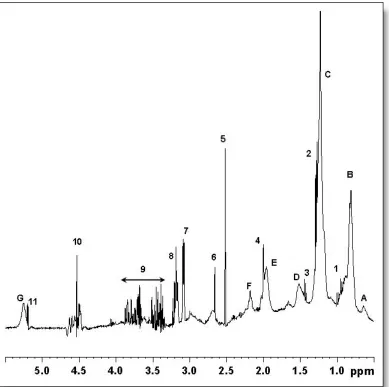
Figure 1.4. Proton NMR spectrum of human blood serum ...15
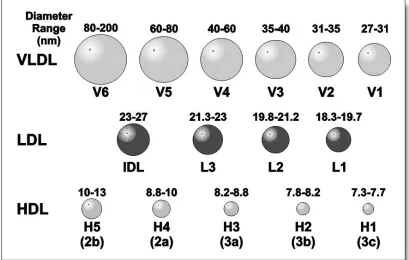
Figure 1.5. Lipoprotein subclasses quantified by NMR ...17
Chapter 2: Figure 2.1. Agarose column separation of major classes of lipoproteins ...23
Figure 2.2. Electron micrograph of a homogenous VLDL subcomponent ...26
Figure 2.3. Relationship of lipoprotein particle diameter and NMR chemical shift ...30
Figure 2.4. Reference spectra comprising NMR LipoProfile fitting model ...31
Figure 2.5. Plasma lineshape analysis results ...35
Figure 2.6. Sample NMR LipoProfile assay report ...37
Figure 2.7. Relations of LDL-C and HDL-C between NMR and beta quantification ...40
Chapter 3: Figure 1. Lipoprotein purification using agarose gel filtration ...54
Figure 2. Electron microscopy for three purified lipoprotein components ...56
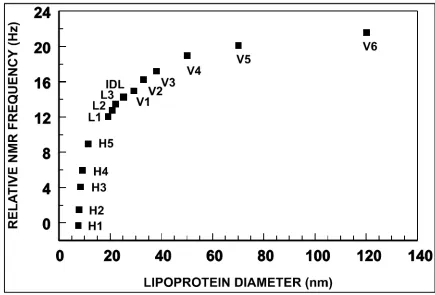
Figure 3. Relationship between lipoprotein particle diameter and relative NMR chemical shift ...58
LIST OF FIGURES ….continued Figure 5. Correlation of NMR signal area to chemical lipids
for LDL samples ...61
Figure 6. GCE analysis of large and small LDL and HDL used for spiking studies ...63
Figure 7. Standard addition plots- Spiking plasma with VLDL and LDL ...67
Figure 8. Standard addition plots – Spiking plasma with HDL ...71
Figure 9. NMR response to size perturbations induced by spiking ...74
Figure 10. Comparison of NMR and GGE sizes for LDL and HDL ...77
Figure 11. Comparison of NMR-derived lipids to chemical lipids for TG and HDL-C ...80
Figure 12. Correlation of NMR LDL particle number with LDL apoB ...84
Chapter 4: Figure 1. Schematic representation of the metabolic origins of LDL particles containing less cholesterol than normal ...107
Figure 2. Distribution of the measured ratios of cholesterol/triglyceride in the LDL fraction (d=1.006-1.063 kg/L) isolated by ultracentrifugation from 118 healthy subjects ...108
Figure 3. Representation of the lipoprotein subclasses quantified by NMR and the information reported in the NMR LipoProfile ...111
Figure 4. Relations in the Framingham Offspring cohort of HDL cholesterol levels to levels of HDL subclasses, LDL subclasses, LDL particles and cholesterol, and LDL particles and non-HDL cholesterol ...114
Chapter 1:
Introduction and Background
1.1Lipids and Coronary Heart Disease
Coronary heart disease (CHD) is the number one cause of death in the developed world.
Cholesterol, an essential constituent of cell membranes and a precursor of bile acids, vitamin
D and other steroids, has long been implicated in the development of atherosclerosis - the
narrowing of arteries caused by the deposition and build up of fatty plaque. Fatty acids
(lipids) in the form of triglycerides and cholesterol esters from the diet or produced
endogenously are packaged in particles called lipoproteins in the intestine and liver and
transported in blood plasma to peripheral tissues. Total cholesterol at elevated levels in
blood plasma has long been known to be associated with increased incidences of coronary
heart disease, myocardial infarction and stroke (1-4). The cholesterol-carrying lipoproteins
are classified into three broad categories based on density as very-low-density, low-density
and high-density lipoproteins, or VLDL, LDL and HDL, respectively. In addition to total
cholesterol, the LDL-cholesterol (LDL-C) is also known to have a positive association with
CHD risk. The HDL-cholesterol (HDL-C), however, exhibits a negative association with
CHD, meaning higher levels of HDL-C confer reduced risk for heart disease (5, 6). Due to
their respective associations with CHD risk and their roles in cholesterol metabolism, LDL-C
is commonly known as the “bad” cholesterol, and HDL-C has been dubbed the “good”
cholesterol.
The Expert Panel of the National Cholesterol Education Program (NCEP) is
responsible for the major public health initiatives for the identification of individuals at risk
for CHD (7). The NCEP recommends screening for cholesterol and lipoprotein lipids for all
included initial classification into three categories of CHD risk based on the concentration of
total cholesterol (TC): “desirable” – TC<200 mg/dL (5.17 mmol/L), “borderline high” –
TC=200-239 mg/dL (5.17-6.18 mmol/L), and “high” – TC≥240 mg/dL (>6.21 mmol/L).
Individuals in the “borderline high” and “high” categories require additional analyses for
LDL-C and HDL-C to gauge the need for dietary or drug treatment. The initial NCEP
guidelines to use total cholesterol instead of a complete lipid profile for CHD risk
categorization was partly due to analytical cost considerations. An individual’s true
concentration of cholesterol is subject to biological and analytical variations (8, 9) and as
such requires repeated testing with carefully controlled analytical procedures for accurate
risk assessment. People with “desirable” total cholesterol but with low levels of HDL-C will
not be identified by this approach. Subsequent guidelines issued by the NCEP shifted the
emphasis from total cholesterol to LDL-C. The most current communiqué from the NCEP’s
Adult Treatment Panel, popularly known as ATP III guidelines, issued in May 2001
established clear guidelines for CHD risk reduction based on lowering of LDL-C levels (10).
A multitude of factors are considered in assessing CHD risk. The presence of clinically
manifest CHD such as history of heart attack, myocardial infarction, stroke etc. is considered
a primary risk factor for future CHD. Then there are CHD risk equivalents such as the
presence of diabetes mellitus or a greater than 20% risk of developing CHD based on use of
the Framingham 10-year risk scoring system (11). Consideration is given then for the
presence of major risk factors such as smoking, hypertension, low HDL-C, family history of
premature CHD and age. Finally, an LDL treatment goal is arrived at based on all of these
factors. The LDL-C reduction is achieved by nutritional and life style changes, drug therapy
Though the emphasis on CHD prevention is based on LDL-C levels, in routine
clinical practice LDL-C is not measured directly. The most widely used clinical procedure
for measuring LDL-C concentrations is that of Friedewald (12) in which three separate
determinations for total cholesterol, triglyceride, and HDL-C are first made. Then the LDL-C
is estimated using the Friedewald formula, LDL-C = TC – HDL-C – TG/5. The Friedewald
approximation of VLDL-C ≅ TG/5 holds only for normal TG levels (i.e. TG<150mg/dL),
above which there are deviations that make the estimation unusable for TG > 400 mg/dL.
Furthermore, the accuracy of the LDL-C value, the key index for clinical decision making in
the NCEP guidelines, depends on the combined reliability of the triglyceride, total
cholesterol, and HDL-C measurements, the imprecision in all of which will add to the total
error of the estimated LDL-C.
This dissertation deals with the development and validation of an alternate analytical
procedure for measurement of lipoproteins in plasma or serum based on proton NMR
spectroscopy. We have developed a protocol in which a linear least-squares fit of the plasma
methyl lineshape provides an accurate assessment of the amplitudes of the signals from the
component lipoproteins (chylomicrons, VLDL, IDL, LDL, and HDL). The derived
amplitudes from the deconvolution of the proton NMR methyl spectra envelope correlate
well with lipoprotein concentrations expressed in terms of lipoprotein lipid content. The
rapid and simultaneous quantification of the lipoprotein mass concentrations and their
average particle size dispersions by 1H NMR spectroscopy offers significant advantages over
existing methods and lends a powerful tool for the assessment and management of CHD risk.
Human blood collected by veni-puncture in tubes containing anticoagulant (EDTA) can be
spun at 2000g in a clinical centrifuge for 15 minutes to yield a clear liquid called plasma in
the top half of the tube, separating it from the cells at the bottom. If the collection tube used
has no anticoagulants and is left to clot before being spun, the resulting fluid is referred to as
serum. Arterial plasma under normal conditions is maintained well buffered at pH 7.40 ±
0.05. Plasma consists of many metabolites, lipoproteins and plasma proteins such as
albumins, globulins and fibrinogens. Fibrinogens play an essential role in clotting, and serum
separated after clot removal is essentially fibrinogen free. Plasma lipoproteins are spherical
particles containing specific lipids and proteins. Dietary lipids contain fatty acids that have
been esterified either with cholesterol, called cholesterol esters (a.k.a. cholesteryl esters), or
with glycerol, called triglycerides (Figure 1.1). Fatty acids are long chain hydrocarbons that
have a methyl (CH3) group on one end and a carboxylic acid (COOH) moiety at the other
end. The hydrophobic nature of lipids prohibits direct transport in plasma. The re-packaging
of lipids in vivo into particles called lipoproteins facilitates their transport between organs
and tissues. The dietary intake of fatty acids (lipids) in the form of triglycerides and
cholesterol esters, and lipids synthesized in the body are packaged into lipoprotein particles
in the intestine and liver and transported in blood plasma to peripheral tissues. As the name
suggests, lipoproteins contain both lipids and proteins. The proteins contained in the
lipoproteins are called apolipoproteins. Apolipoproteins play important roles in the
metabolism of lipoproteins by binding to specific receptor sites, in addition to acting as
1.2.2 Lipoprotein structure
Lipoproteins are spherical particles that span a wide range of particle sizes. They have a
hydrophobic core of cholesterol ester and triglycerides, surrounded by a hydrophilic shell of
phospholipids with embedded apolipoproteins and some free (unesterified) cholesterol that
provide structural stability. The phospholipid is in the form of a monolayer with an
approximate thickness of 2 nm.
Figure 1.2. Schematic representation of a lipoprotein particle.
Lipoprotein particles have a spherical structure resembling a micelle. The non-polar core has cholesterol ester and triglyceride. The shell is made of phospholipids with the polar head group facing the surface along with one or more apolipoproteins and some unesterified cholesterol. Magnetically, the core is isotropic while the shell is ordered and anisotropic.
1.2.3 Nomenclature and Classification of Lipoproteins
Lipoproteins are classified in different ways based on their physical properties. They can be
categorized based on density, size, electrophoretic mobility, flotation constant, and
apolipoproteins. The most common classification is based on density into three major
and HDL, respectively. Two other related categories are chylomicrons that are less dense
than VLDL, and intermediate-density-lipoproteins, or IDL, that falls between the density
range of VLDL and LDL. The particle density increases from chylomicrons to HDL while
the particle size decreases from chylomicrons to HDL. The relative protein content also
increases going from chylomicrons to HDL. These properties are summarized on Figure 1.3
and Table 1.1.
Figure 1.3. Relationship of particle size and density of lipoprotein subclasses.
The particle size of lipoprotein subclasses have an inverse relationship to their hydrated densities. A common sub-classification of HDL consists of larger HDL2 (d1.063-1.125kg/L),
and smaller HDL3 (d1.125-1.210kg/L). Lp(a) is a LDL-like particle with the apoB of LDL
Table 1.1 Classification and Physical Properties of Lipoproteins
Lipoprotein Density (kg/L)
Particle Diameter
(nm)
Flotation Rate
(Sf)
Electrophoretic Mobility
Amount of Protein
(%) Chylomicrons < 0.95 80-1200 > 400 Stays at origin 2
VLDL 0.95-1.006 30-80 60-400 Pre-beta 8
IDL 1.006-1.019 23-35 20-60 Broad Beta 16
LDL 1.019-1.063 18-25 0-20 Beta 21
HDL 1.063-1.210 5-12 0-9 Alpha 55
VLDL= very-low density lipoprotein, IDL=intermediate-density lipoprotein, LDL= low-density lipoprotein, HDL= high-density lipoprotein; Sf= Svedberg units
1.2.4 Apolipoproteins and Lipoprotein Metabolism
There is constant traffic of apolipoproteins between lipoprotein particles. They bind to
specific receptors and act as cofactors to enzymes. The major enzymes involved in
lipoprotein metabolism are lipoprotein lipase (LL), hepatic triglyceride lipase (HTGL), LDL
receptor related protein (LRP), and lecithin:cholesterol acyltransferase (LCAT). Also there is
exchange of TG and cholesterol ester between lipoprotein particles that are catalyzed by
cholesteryl ester transfer protein (CETP). Table 1.2 details the known apolipoproteins, and
Table 1.2 Apolipoproteins and Functions Apolipoprotein Main Functions
Apo AI Accepts cholesterol. Structural for HDL. Ligand for HDL binding. LCAT cofactor.
Apo AII Structural for HDL. Ligand for HDL binding. LCAT cofactor.
Apo AIV Ligand for HDL binding. LCAT activator.
Apo(a) Structural for Lp(a). Structural analogy with plasminogen.
Apo B-48 Structural for chylomicrons.
Apo B-100 Structural for VLDL, IDL, and LDL. LDL receptor ligand.
Apo CI LCAT and LPL activator.
Apo CII LCAT and LPL activator.
Apo CIII LPL inhibitor. HTGL inhibitor. Modulator of TG-rich lipoproteins by LRP.
Apo E Ligand for LDL receptors and LRP.
The following is a brief description of lipoprotein metabolism (14). Fats absorbed in
the intestine are packaged into large triglyceride-rich particles known as chylomicrons. These
undergo lipolysis (removal of TG) to form chylomicron remnants which are taken up by the
liver via an apo E receptor. The liver can also secrete triglyceride-rich VLDL. Following
lipolysis, these particles can be converted to LDL or be taken up by the liver via an apo E
receptor. The LDL formed are catabolized mainly by the liver or by other tissues via LDL
receptors that recognize both apo B-100 and apo E but not apo B-48. If LDL are modified,
they also can be taken up by scavenger receptors on macrophages. HDL are synthesized by
both the liver and the intestine. The HDL pick up lipid and protein constituents from
chylomicrons and VLDL as these particles undergo lipolysis. HDL picks up free cholesterol
from peripheral tissues and macrophages, a process known as reverse cholesterol transport,
1.3 Measurement of Lipoproteins
1.3.1 Measurement of lipids as surrogates for lipoproteins
Ever since lipid levels were linked to the prevalence of coronary artery disease (CAD),
clinical tests were developed to measure lipids. Enzymatic assays have been available for
over three decades to measure TC, TG, and HDL-C (15-19). The HDL assays involve a
precipitation step to remove VLDL and LDL, or homogeneous assays that complex beta
lipoproteins, followed by a cholesterol assay. As described before, LDL-C is estimated (12)
as TC – (HDL-C) – (TG/5), with concentrations expressed in mg/dL units. (For mmol/L
units, TG/2.2 is used instead of TG/5).
What is often not appreciated is that measuring lipids is really a surrogate for
measuring the lipoproteins that carry cholesterol and TG. The surrogate relationship of lipids
(cholesterol and triglycerides) to lipoproteins was described in the 1967 landmark writings of
Fredrickson, Levy, and Lees (20), who noted that "… all abnormalities in plasma lipid
concentrations, or dyslipidemia, can be translated into dyslipoproteinemia" and shifting
emphasis to lipoproteins "…offers distinct advantages in the recognition and management of
such disorders." The reason that lipids, rather than lipoproteins, are the traditional focus of
clinical attention was also discussed: "…there is no single test that infallibly separates all
those who have dyslipoproteinemia from those who do not.…the majority of laboratories still
employ a combination of chemical measurements of plasma lipids for this purpose." It is
known well that lipoprotein particles interacting with the arterial wall play key roles in the
development of atherosclerosis (21). For reasons that are related primarily to the difficulty of
measuring lipoprotein particles directly, triglycerides continue to serve as a surrogate
concentrations of LDL and HDL particles. The measurement of apolipoproteins, some of
which have reasonably direct relationship to lipoprotein particle levels, have at best been
used as extra information to add to the myriad of lipid information towards assessing CHD
risk. Especially apolipoprotein B-100, which has a 1:1 relationship to LDL particle
concentration, did not warrant much attention in the clinical science community fixated by its
cholesterol focus (22).
1.3.2 Lipoprotein subclass measurement
While the relationships of the major lipoprotein classes (VLDL, LDL, and HDL) with CHD
risk are well known, the measurement of subclasses within the major classes has brought
further understanding to the study of atherosclerosis, diabetes, metabolic syndrome and other
lipoprotein disorders. For example, within the LDL regime, the prevalence of smaller, denser
LDL (pattern B phenotype) had been associated with as much as a 4-fold increase in CHD
risk compared to a prevalence of larger, less dense LDL subclasses (pattern A phenotype)
(23-26). Even in the case of the “cardioprotective” high density lipoproteins, only the large
HDL subclass seems to give a beneficial effect while some smaller subclasses might be
positively linked to CHD risk (27, 28, 61). This type of information has stimulated research
interest in lipoprotein subclasses and the development of new, more efficient methods for
their measurement.
Lipoprotein subclasses can be quantified by a variety of analytical techniques. The
oldest and most common method is analytical ultracentrifugation (29). By appropriately
adjusting the density of plasma, sequential flotation ultracentrifugation (30) can be used to
multiple steps and takes several days. Density gradient ultracentrifugation is another common
method for the isolation of lipoprotein subclasses (31-33). Plasma is carefully layered with
multiple density salt solutions and then spun in a swinging-bucket rotor. Depending on the
purpose for isolation this can be done in several hours to a day. Gel filtration chromatography
is another common way of isolation (34, 35). Agarose gels are used for this size exclusion
process. Polyacrylamide gradient gel electrophoresis (GGE) is widely used for LDL and
HDL subclass analysis, and has higher resolving power than the ultracentrifugal methods (36,
37). GGE is not, however, suited for preparative scale separations.
1.3.3 Limitations of current methods for lipoprotein subclass analysis
The traditional methods for subclass quantification reviewed above involve a two-step
process whereby the subclasses are first physically separated from plasma and each other,
and then a measurement is made to quantify the (partially) separated subclass. These are very
labor-intensive processes that can take from half-a-day to several days to complete, the latter
being more common. Even after the laborious separation, measuring only the cholesterol in
the separated fractions does not achieve the objective of quantifying the lipoprotein particles
themselves or the bulk lipid they contain. There are also documented concerns that the
ultracentrifugation process itself modifies the physical properties of some lipoproteins (38).
The powerful GGE techniques are fraught with reproducibility issues arising from the need
to make uniform gradient gels and the need to run calibrators every time, all of which confine
the technique to a few specialized laboratories. Due to the time and labor involved, these
Several years ago, Otvos and coworkers proposed an entirely different approach to
lipoprotein subclass analysis that exploits the natural proton nuclear magnetic resonance
(NMR) spectroscopic differences existing between lipoprotein particles of different size (39,
40, 41). The proposed method completely eliminates the need for physical separation and
measures simultaneously all of the lipoprotein subclass concentrations. There is also no need
for any reagents. The method offers the potential for considerable cost and time savings over
existing methods, and lends itself to automation and adoption for CHD risk evaluation.
1.4 NMR spectroscopy of blood plasma
NMR spectroscopy had been in use for several decades as a powerful tool for chemical and
biomacromolecular structure elucidation. Proton (1H) NMR spectroscopy where the nucleus
being observed is the hydrogen atom (a spin ½ nucleus) is the most commonly studied
structural probe. With few exceptions it has been used as a qualitative, rather than
quantitative, analytical tool. The first use of NMR to study lipoprotein samples was for the
purpose of verifying the micellar structural model for serum lipoproteins (42). Proton NMR
has been extensively used to identify the metabolites in plasma and other biological fluids,
and also proposed to have utility in cancer diagnosis. An explosion in the field occurred
starting in the mid eighties with the advent of good water suppression techniques (43-48). A
comprehensive review by Ala-Korpela appeared in 1995 (49).
1.4.1 Lipoprotein subclass measurement by NMR
The proton NMR method of lipoprotein measurement takes advantage of the natural
proton NMR spectrum of a typical plasma/serum sample acquired at 400 MHz. The
assignments for the origin of the multiple peaks from lipids and small molecule metabolites
are given in the figure legend. The most prominent lipid peak comes from the repeating units
of –CH2- (methylene) hydrogen atoms. However, the –CH3 (methyl) signals appearing
around 0.7-0.9 ppm are spectroscopically simpler in terms of their chemical environment,
being at the terminal end of lipids. Efforts to measure lipoproteins by NMR thus focused on
the methyl signal of plasma and its lipoprotein constituents. The signals in this region are
emitted by methyl group protons of phospholipids, free cholesterol, cholesterol ester and
triglyceride, which are spectroscopically indistinguishable from one another. The detected
Figure 1.4. Proton NMR spectrum of human blood serum.
400 MHz 1H NMR spectrum of a serum sample (diluted two fold with EDTA buffer) acquired at 470C with 10 scans. Resonance assignments: A, –C(18)H3 of cholesterol back
bone; B, terminal methyl -CH3 protons; C, methylene –(CH2)n- protons; D, methylene
protons of C(3) carbon –CH2-CH2-COOC- ; E, allylic methylene protons –CH2-CH=CH- ; F,
methylene protons of the C(2) carbon –CH2-COOC- ; G, allylic carbon protons –CH=CH- ;
1, valine quartet; 2, lactate doublet; 3, alanine doublet; 4, N_acetyl protons of
N-acetylglucosamine of glycoproteins; 5, ethylenic protons –N-CH2-CH2-N- of CaEDTA;
6, ethylenic protons –N-CH2-CH2-N- of MgEDTA; 7, acetate protons –CH2-COO— of
CaEDTA doublet; 8, methyl –N(CH3)3 of choline head group of phospholipid; 9, glucose
By isolating the major classes of lipoprotein (VLDL, LDL and HDL), and the
lipoprotein-free serum proteins, and adding the NMR spectra of these constituents together,
we demonstrated that the shape and intensity of the intact plasma signal can be matched (48).
By acquiring and utilizing a library of reference spectra of purified lipoprotein subclasses, it
is feasible to work backwards from the composite plasma methyl signal using a specialized
linear least squares fitting program (40). There are distinct chemical shift differences
between the different classes of lipoproteins. The larger classes, and indeed subclasses,
progressively shift downfield (to the left) from the smaller lipoprotein classes. While the core
of the particle is isotropic at temperatures above the thermal order-disorder transition point
(>450C), the phospholipid shell remains in an ordered state and this anisotropic magnetic
susceptibility directly related to the radius of curvature of the particle has been established as
the source of the chemical shift differences (50). Under current conditions, a total of 15
different lipoprotein subclasses consisting of 6 VLDL, 4 LDL including IDL, and 5 HDL are
quantified by the NMR methodology with adequate precision and accuracy. The diameter
ranges of the subclasses determined by NMR and characterized by electron microscopy and
Figure 1.5. Lipoprotein subclasses quantified by NMR.
Subclass designations and diameter ranges for the fifteen subclasses quantifiable by NMR. The sizes of the original reference components were determined by GGE and electron microscopy. Another alternate classification is large VLDL (V6+V5), medium VLDL
(V4+V3), small VLDL (V2+V1), IDL, large LDL (L3), medium-small LDL (L2), very small LDL (L1), large HDL (H5+H4), medium HDL (H3), and small HDL (H2+H1).
The deconvolution of the plasma spectra results in coefficients that tie the intensities
of the plasma subclass signals to the reference subclass components used in the fitting model.
These coefficients are then multiplied by conversion factors that produce the particle
concentrations of the subclasses and the NMR-derived lipid concentrations. The most
fundamental information gained by the NMR methodology is the particle concentrations of
subclasses (mmol/L for VLDL and LDL, and µmol/L for HDL), since the NMR intensity is
directly proportional to the number of hydrogen nuclei of the methyl protons. The
compositional changes resulting from CETP mediated TG – CE exchange processes have no
bearing on the number of protons since both TG and CE have the same number of CH3
mg/dL Chol or TG) on the other hand are obtained based on cholesterol and TG
concentrations determined for the reference subclasses that assume normal composition of
TC and TG (40-41, 51-52). Therefore, while generally good agreement will be seen for
NMR-derived lipid values and chemical lipids, there will be significant differences when the
plasma samples have lipoproteins with abnormal lipid compositions as in the case of
TG-enriched, cholesterol-depleted particles. The third important piece of information resulting
from the NMR deconvolution is the average particle sizes (in nm) for the VLDL, LDL, and
HDL classes. These are computed as the weighted average of the sum of the diameter of each
subclass multiplied by its relative mass percentage as estimated from the methyl NMR signal
amplitude. There is very good agreement between NMR-determined and GGE-estimated
particle sizes for LDL and HDL. The output incorporating all three classes of information
(i.e. particle concentrations, lipid estimates, average particle size) is termed NMR
LipoProfile.
1.4.2 Advantages of lipoprotein subclass analysis by NMR
The NMR method for subclass analysis is rapid and fully automatable. The major advantage
of the method is in its avoidance of the need for physical separation of the lipoprotein classes
and subclasses. NMR provides within minutes the data obtainable in days by traditional
methods. On top of it, NMR methodology provides additional useful data like the LDL and
HDL particle concentrations that are not directly accessible by any other method. The
precision of the NMR method is also superior to the traditional methods. The efficiency with
which lipoprotein subclass data can be generated opens new avenues in the assessment and
1.4.3 Alternate NMR approaches
In parallel to the development of the NMR method described above, a group in Finland led
by Hiltunen and Ala-Korpela used a lineshape analysis program (FITPLA) where they tried
to model the spectra of lipoprotein classes with multiple Lorentzian peaks (53-55).
Subsequently they introduced multivariate analysis approaches to quantify lipoprotein lipids
(56-57). Chemometric techniques like Partial Least Squares regression (PLS) and Principal
Component Analysis (PCA) were used to correlate NMR-derived values to plasma lipid
levels. Later, Ala-Korpela’s group employed artificial neural network (ANN) analysis to
correlate NMR values to chemical lipids and apolipoproteins A1 and B. Another group in
Norway led by Engan and Bathen extended the PLS and ANN approaches along with pattern
recognition to separate CHD subjects from normal subjects, and to aid in cancer diagnosis
(58-60). These novel chemometric approaches, however, have been tested with very small
data sets, and require the need for a training data set and test (validation) set and the
know-how not to over-train. More importantly, these are all attempts at quantifying lipids, and not
quantifying lipoprotein subclasses at the particle level.
1.5 Overview of chapters to follow
Chapter 1 presented background information regarding CHD risk assessment and the existing
need for measuring lipoprotein subclasses to aid diagnosis and management of coronary
artery disease. Lipoprotein structure and function and the currently available methods for
lipoprotein subclass analysis were reviewed. The NMR-based spectral deconvolution
technique to measure lipoprotein classes and subclasses at a particle level, and the average
Chapter 2 will deal with details of the methodology, especially focusing on the
isolation of pure reference subclasses and the size characterizations of the same with GGE
and electron microscopy. The NMR spectroscopy methodology will also be discussed in
more detail. The clinical output of the results, the NMR LipoProfile, will be introduced.
Chapter 3 forms the bulk of the dissertation material and comes in the form of a
paper to be submitted to Clinical Chemistry for publication. It provides comprehensive
validation data for the NMR technique and contains precision and accuracy data establishing
NMR LipoProfile as a clinical assay.
Chapter 4 consists of a paper published in the American Journal of Cardiology
highlighting the importance of the newly available LDL particle concentration number. It
demonstrates how traditional LDL cholesterol levels can underestimate the true risk of
patients for certain metabolic conditions whereas the LDL particle number would have
confirmed their excess LDL status. NMR data from the Framingham Offspring Study with
3400 participants is used for this analysis.
Chapter 5 entails a brief discussion, summary and conclusion. References for chapters
1, 2 and 5 are given at the end, starting on page 127.
Chapter 2: Experimental: Building blocks of the NMR LipoProfile test
2.1 Isolation of lipoproteins
Lipoprotein preparations were obtained by sequential ultracentrifugation as previously described (39, 62, 63). The density ranges for the major subclasses isolated were
Chylomicrons (<0.94kg/L), VLDL (0.94-1.006 kg/L), IDL (1.006-1.109 kg/L), LDL (1.019-1.063 kg/L) and HDL ((1.019-1.063-1.210 kg/L). Plasma proteins with d>1.225kg/L were also isolated. Where appropriate, the preparations with densities higher than that of plasma were dialyzed against plasma diluent buffer containing 120mM KCl, 5mM EDTA, 1mM CaCl2, 50mM Na2HPO4 and 0.2g/L NaN3 buffered at pH 7.4.
by the dissolution of solid NaBr, ultracentrifuged at 40C and 50,000 rpm for 48 hours,
(Beckman Coulter, Optima TLX) and the top fractions collected using a Beckman tube slicer. For IDL, the fraction with density range 1.006 – 1.019kg/L was first isolated from pooled plasma using sequential ultracentrifugation. The floated lipoproteins were concentrated to 1-2mL using Centricon-10 microconcentrators (Amicon Inc, Danvers, MA) and loaded onto the A-15 column and eluted with plasma buffer. Fractions of 3-4 mL each were collected and the OD measured at 280nm to record the elution of the lipoprotein particles.
30 40 50 60 70 80 90 100 110
Fraction Number (3mL ea.) 0.00
0.50 1.00 1.50 2.00
Absorbance at 280 nm LDL
HDL
Lipoprotein Isolation:
A-15 Agarose Gel Filtration Profile
LDL
VLDL
Chylos
Figure 2.1. Agarose column separation of major classes of lipoproteins. A-15 agarose gel filtration profile of density < 1.225kg/L portion from a
hypertriglyceridemic subject. The absorbance at 280 nm was plotted against fraction number (3 mL ea.). Peaks from chylomicrons, VLDL, LDL, and HDL are clearly visible, with the chylomicrons appearing in the void volume of the column.
The A-15 column (4% Agarose beads) gave the best overall separation of all three classes of lipoproteins. However, in light of the overlap in the VLDL/LDL regime, procedures were modified to first isolate VLDL by ultracentrifugation and then achieve further purification by chromatographing on an A-50 column. The fraction with VLDL removed from it was
2.2 Characterization of lipoproteins 2.2.1 Chemical analysis
Chemical lipid analyses for TC, TG and HDL-C were performed enzymatically on a Bayer RA-1000 analyzer at the Lipid Analytic Laboratory of the Wake Forest University School of Medicine (Winston Salem, NC). All TG analyses were run with glycerol blanking. The analysis for TC and TG was performed on the isolated lipoprotein subcomponents after special calibration for measuring concentrations lower than normally seen in plasma. Apolipoprotein B (apoB) measurements were performed on a Beckman Synchron CX-7 (Beckman Coulter Inc., Fullerton, CA) analyzer using a commercial turbidimetric
immunoassay (Wako Chemicals, Osaka, Japan) ( 64). Compositional analysis to measure CE, TG, unesterified cholesterol and protein were carried out at Wake Forest University School of Medicine (Winston Salem, NC) with the assistance of Dr. Martha Wilson.
2.2.2 Electron microscopy
Figure 2.2. Electron micrograph of a homogeneous VLDL subcomponent.
Transmission electron micrograph (JEOL 100S) of a VLDL lipoprotein subclass component separated and purified by combination of ultracentrifugation and agarose column
chromatograpghy. Sample was diluted with saline to approx. 1mg/mL and applied on 200-mesh Formvar-carbon-coated grids and stained with 2% sodium phosphotungstic acid (PTA). Total magnification x135,000. Diameters on the photographs were measured with a HiPad Digitizer counting 200 particles to generate the frequency distribution and mean diameters. The particle diameter (mean ± SD) for the lipoprotein component was 33 ± 3 nm.
2.2.3 Gradient gel electrophoresis
Nondenaturing gradient gel electrophoresis was used to characterize isolated HDL subfractions in the laboratory of Dr. Larry Rudel at Wake Forest University School of Medicine (34, 36). Further GGE analysis of plasma samples and LDL and HDL preparations for the standard addition studies were performed at Dr. David Rainwater’s laboratory at Southwest Foundation for Biomedical Research (San Antonio, TX) (37, 66, 67). Generally, in the Rainwater laboratory, twelve microliters of isolated LDL or HDL fraction was applied to a 3-31% gradient gel. After electrophoresis, the gel was stained for lipid with Sudan black B.
Calibrators for LDL diameters were: latex microspheres (38 nm), two LDL bands (27.5 & 26.6 nm, calibrated by Berkeley HeartLab, Inc., and thyroglobulin (17 nm); for HDL: thyroglobulin (17 nm), ferritin (12.2 nm), LDH (8.16 nm), and albumin (7.2 nm). A
photograph of a typical GGE scan and its densitometer trace is shown in Chapter 3, Figure 5.
2.3 NMR spectroscopy
INCA (Integrated NMR Chemical Analyzer) enclosure consisting of an actively shielded magnet, an automatic Gilson-215 (Madison, WI) sample handler and a flow probe with a 120uL active volume. All NMR measurements for lipoprotein analyses were performed at 470C; the flow path was heated to minimize the time needed for temperature equilibration of the sample inside the probe. Automatic sample handling methods and procedures developed in-house were used in tandem with Bruker’s ICON NMR software module. Sample
preparations were executed automatically by a Tecan Genesis RSP-100 (Tecan US, RTP, NC) aliquotting station. The bar-coded sample racks were kept refrigerated and loaded on the NMR analyzer after daily startup and QC procedures were completed. When the racks are cooled, up to 256 samples can be analyzed unattended.
As part of the startup procedure a NMR standard sample of TMA (trimethylacetate, sodium salt) was first injected. The TMA standard mimics the ionic strength of plasma and contains 15mM TMA, 5mM EDTA, 3mM CaCl2, 120mM KCl and 10%v/v D2O, pH 9.0. The TMA was used for “shimming” to achieve acceptable magnetic field homogeneity and to calibrate the detection sensitivity of the spectrometer. Spectra were acquired following shimming the magnetic field on the field-frequency lock signal provided by the D2O in the TMA sample to achieve a Lorentzian lineshape with a linewidth at half-height of < 1.2 Hz. The methyl peak of the TMA standard was integrated and the peak area used to correct for day-to-day variations in spectrometer sensitivity and to normalize multiple spectrometers and flow probes. The frequency shift of the water with respect to the CaEDTA peak at 2.519 ppm was used as an internal thermometer to maintain the measurement temperature at 47.00C.
test samples. The serum control materials were purchased from Soloman Park Research Laboratories (Kirkland, WA) where the two pools were prepared encompassing high and low ranges of lipid levels. The NMR LipoProfile results obtained for the serum controls were the input for Westgard’s multirule quality control procedures (69, 70).
NMR acquisition conditions were similar to previous descriptions (39, 40). A single pulse scout scan was used to determine the water frequency. This was followed by a standard one-pulse sequence preceded by a 1.5-s pre-acquisition delay and 1.5-s selective
presaturation pulse at the water frequency. A spatially selective composite 900 observation pulse (90x – 90y – 90-x – 90-y) was used to minimize water suppression artifacts (68). The acquisition time was 1.0-s with a pulse repetition rate of 4-s per scan. Other settings for data acquisition were: spectral width, 4496 Hz; time domain data size, 9024; composite pulse length 5-8 µs; and constant receiver gain. For routine NMR LipoProfile analysis of plasma and serum samples NMR data were acquired unlocked in 5 blocks of two scans each. For isolated lipoprotein components with relatively low lipid content, samples were run locked acquiring 16-128 scans in a single block. The NMR analysis time for the plasma samples was 40-s and a further 1.5 to 2 minutes was required for sample loading and cleaning the flow path between samples. The time-domain data were zero-filled to 16K, multiplied by appropriate Gaussian and exponential apodization functions to enhance resolution, and Fourier-transformed with identical scaling. The resulting real and imaginary files form the input for the deconvolution program to generate the NMR LipoProfile.
2.4 Construction of fitting model
lineshape fitting model was then constructed. Selecting enough subcomponents (30-40) to provide representation of all lipoprotein species likely to be encountered in a patient’s plasma sample is essential. The subcomponents were then grouped into subclasses as described in Chapter 1 and 3 forming 6 VLDL, IDL, 3 LDL and 5 HDL subclasses. Figure 2.3 illustrates the chemical shift relationship of the lipoproteins to the particle size for representative subclasses included in the model.
Figure 2.3. Relationship of lipoprotein particle diameter and NMR chemical shift. Plot of relative NMR shift (with respect to the smallest HDL) of fully characterized lipoprotein subclasses against lipoprotein particle diameter.
the different classes of lipoproteins, including subtle differences within each class are clearly discernable.
Figure 2.4. Reference spectra comprising NMR LipoProfile fitting model.
2.5 NMR lineshape deconvolution
The lipid methyl region, from 0.914 to 0.718 ppm, was the spectral region employed for deconvolution of the experimental NMR lineshape. The experimental spectrum was modeled as a linear combination of over 30 lipoprotein subcomponent spectra obtained as described above. Contribution of each subcomponent NMR lineshape in the basis set to the lineshape of the experimental spectrum was determined by singular value decomposition (71, 72, 73), constrained so that concentrations could not be less than zero.
The digitized data covering the deconvolution region from each of the reference lipoprotein spectra was stored in separate arrays of computer memory. Both the real and imaginary part of the experimental plasma (analyte) spectrum was then read into the array. The analyte NMR lineshape was deconvoluted using multivariate analysis with non-negative constraints. The lineshape consisted of a vector of m discrete NMR intensities, each
representing an incremental change in the NMR chemical shift that was directly related to the size of lipoprotein particles. The experimental lineshape was approximated as a linear
combination of reference component lineshapes, with each component a vector spanning the same region as the experimental spectrum:
R and I represent the real and imaginary parts of the NMR spectrum. P is the experimental analyte vector, with m data points where m = 1,2,….,300. The VjR are vectors corresponding
to the real parts of a carefully phased set of n-2 lipoprotein component spectra spanning particle size range from 200 nm to 7.3 nm, covering large VLDL/Chylomicrons to small
2
1
n
R R R I
i j ji k ki p i j
P c V c V c P
−
=
HDL. The vector PI is the imaginary part of the analyte spectral vector and Vk is the spectral
vector of the non-lipoprotein ‘plasma protein’ component. These vectors constitute a basis set for least squares analysis, combined into a design matrix for multicomponent regression:
The cj, ck, and cp are the relative contributions to the calculated spectrum for each component vector of the design matrix and constitute a solution vector c, such that VTc ≈ PR, where PRis the vector corresponding to the real part of the analyte spectrum. The best fit (in the least squares sense) is when the Euclidean norm of the residual vector, r = PR - VTc ,is minimized. The condition for this is that VVTc = VPRand c = (VVT)-1VPR; in principle the desired
vector c can be obtained using standard matrix algebra.
However, many of the component spectra have similar lineshapes, and the matrix VT
is often close enough to singularity that the presence of noise in the analyte spectrum creates instability in the conventional least squares solution. This instability is overcome by
decomposing the matrix VT using singular value decomposition (73): VT=QSPT, where Q is a
m × m orthogonal matrix and P a n × n matrix of singular vectors. S is a m × n matrix consisting of a diagonal matrix of singular values in the upper n × n portion of the matrix, with the remainder of the matrix containing zeros. Q and P effectively change the basis VT, with the magnitude of singular values corresponding to the vectors in this new basis
11 12 1
21 22 2
1 2
1 2
1 2
m
m
n n nm
k k km
I I I
m
V V V
V V V
V V V
V V V
P P P
⎡ ⎤ ⎢ ⎥ ⎢ ⎥ ⎢ ⎥ = ⎢ ⎥ ⎢ ⎥ ⎢ ⎥ ⎢ ⎥ ⎢ ⎥ ⎣ ⎦ V L L
M M O M
L
determining their relative contribution to the solution. When these values are very small, so that the contribution of their corresponding vectors to the solution has the same magnitude as the noise, they are eliminated by setting the singular values to zero, thus removing
statistically meaningless contributions to the fit.
Once the coefficients cj relating analyte data to the amplitude fraction of the reference components were solved, conversion factors relating reference spectra signal amplitude to subclass concentrations expressed in particle concentration units or in lipid mass
concentration units (cholesterol or TG) were then applied. Particle concentrations (nmol/L for VLDL and LDL; µmol/L for HDL) were calculated for each subclass standard by measuring the total concentration of core lipid (cholesterol ester plus TG) and dividing the volume occupied by these lipids by the core volume per particle calculated from the particle diameter of the isolated lipoprotein subclass reference. Lipid mass concentration estimates (VLDL in mg/dL TG and LDL and HDL in mg/dL cholesterol) were obtained by applying conversion factors that contained the lipid concentrations measured on each reference subclass. Weighted average VLDL, LDL and HDL particle sizes (nm diameter) were computed as the sum of the diameter of each subclass multiplied by its relative mass percentage as estimated from the intensity of its methyl NMR signal.
2.6 Output of deconvolution: NMR LipoProfile
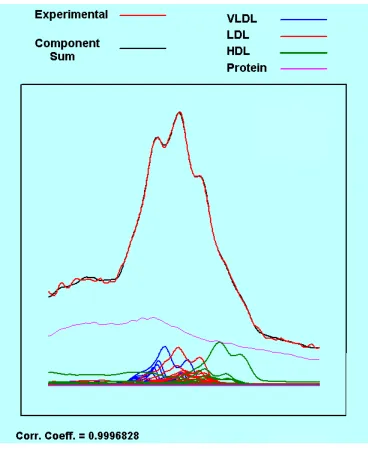
Figure 2.5. Plasma lineshape analysis results.
Visual output of a plasma lineshape analysis. The calculated (black) line closely match the experimental spectrum (red) with r=0.99968. The lower curves show the constituent
subclasses used in the fit, VLDL (blue), LDL (red), HDL (green). The large featureless curve (purple) represents the plasma protein peak included in the fit as a component.
B
Figure 2.6. Sample of NMR LipoProfile assay report
2.7 Correlation with chemical lipids
Chapter 3
Analytical Characterization and Validation of an Automated NMR Spectroscopic Method for Quantifying Lipoprotein Subclass Particles
Elias J. Jeyarajah1, Dennis W. Bennett3, Irina Shalaurova2, Lawrence L. Rudel4, David L.
Rainwater5, and James D. Otvos2*
1 Department of Chemistry, North Carolina State University, Raleigh, NC.
2 LipoScience Inc., Raleigh, NC.
3 Department of Chemistry, University of Wisconsin, Milwaukee.
4 Department of Biochemistry, Wakeforest University School of Medicine, Winston Salem, NC.
5 Department of Genetics, Southwest Foundation for Biomedical Research, San Antonio, TX.
* Address for correspondence to this author at: LipoScience Inc., 2500 Sumner Blvd, Raleigh, NC
27616, USA.
Background: The measurement of blood lipid levels has been central to the clinical
prediction of coronary heart disease (CHD) for many years. Traditionally, plasma lipid and
lipoprotein lipid concentrations have been measured chemically, but several recent studies
have established that lipoprotein subclass particle concentrations measured by proton nuclear
magnetic resonance (NMR) spectroscopy are a superior predictor of risk for CHD (1-6). The
NMR lipoprotein assay directly measures the particle concentrations of lipoprotein
subclasses of different size and, from this information, the average particle sizes of the major
lipoprotein classes. A description of the NMR lipoprotein particle assay and the results of
studies that provide analytic validation of the method are reported here.
Methods: Lipoprotein subclasses were isolated from human plasma using a combination of ultracentrifugation and agarose column chromatography. The purified subfractions were
characterized by NMR, lipid analysis, gradient gel electrophoresis (GGE), and electron
combinations of the purified lipoprotein subclass spectra using non-negative least squares
analysis.
Results: NMR-determined particle sizes correlated well with those estimated by GGE. Total LDL particle concentration measured by NMR was shown to be highly correlated with LDL
apolipoprotein B levels measured by immunoassay. Standard addition tests established the
linearity range and robustness of the assay. Intraassay and interassay precision data
demonstrated that NMR-derived lipoprotein particle concentrations and sizes are
reproducible. Normal ranges and intercorrelations for all of the NMR-determined lipoprotein
parameters were determined.
Conclusion: The NMR LipoProfile assay provides for a robust, accurate and precise tool for the measurement of lipoprotein parameters important in the assessment of CHD risk. Particle
concentrations of 10 lipoprotein subclasses can be rapidly generated with good analytical
precision and accuracy.
Lipoproteins play a key role in the development of coronary heart disease (CHD). The
assessment and management of CHD risk has been invariably tied to the measurement of
cholesterol carried by lipoprotein particles, primarily due to the ease with which cholesterol
can be measured using standard chemical assays. However, the total cholesterol in blood
plasma has turned out to be an unreliable predictor of an individual’s risk for CHD, and the
need for measuring the very low density, low density and high density lipoprotein (VLDL,
LDL and HDL) classes has emerged with the understanding that these major lipoprotein
classes have differing associations with heart disease risk. For example, it has been
association is reversed for HDL, with higher levels of HDL affording protection against heart
disease. Furthermore, the lipoprotein particles of different size (subclasses) that make up
each major lipoprotein class appear to have different CHD risks associated with them. These
observations have led to the motivation to develop an analytical tool to quantify VLDL, LDL
and HDL subclasses in a more automated and efficient manner than provided by existing
separation-based methods, which are relatively laborious and time-consuming.
Traditionally, lipoprotein subclass concentrations have been measured by separating
the lipoprotein fractions either by density, typically using density gradient
ultracentrifugation, or by size, using gradient-gel electrophoresis. Both methods are labor
intensive and therefore relatively costly, and produce data of limited precision. Even
measurement of the concentrations of the main lipoprotein classes by traditional methods is
somewhat problematic analytically. Despite its clinical importance, the LDL cholesterol
(LDL-C) concentration is difficult to measure chemically, and the most common method
employed in most clinical laboratories is to estimate the LDL-C concentration using the
Friedewald approximation (7), in which LDL-C is calculated from a measurement of total
cholesterol (TC), HDL cholesterol (HDL-C) and total triglycerides (TG) in a fasting blood
sample.The need for a fasting specimen, the requirement for TG to be under 400mg/dL, the
heterogeneity of TG content of VLDL, and the cumulative error from the measurement of
three different parameters all diminish the reliability of LDL-C derived from the Friedewald
relationship. Despite these considerable analytical disadvantages, the National Cholesterol
Education Program (NCEP) guidelines have made treatment goals for LDL-C measured in
this way the centerpiece of national recommendations to reduce CHD risk in the U.S.
guidelines to the extent that physicians are encouraged to consider non-HDL cholesterol
levels (TC - HDL-C) as an alternate target for therapy (8).
In the early nineties we introduced a nuclear magnetic resonance (NMR)
spectroscopic method as an alternative analytical tool for the measurement of lipoproteins in
blood plasma and serum (9-11). This method enabled the rapid quantification of several
lipoprotein classes and subclasses and determination of the average VLDL, LDL, and HDL
particle sizes, all without requiring any physical separation of the different lipoproteins. The
NMR method is based on the observation that the protons (hydrogen nuclei) in triglycerides,
and cholesterol esters, and phospholipids experience differences in chemical shift which
depend on the diameter of the lipoprotein particles in which they reside.These differences
are attributable to variations in anisotropic magnetic susceptibility resulting from the
orientational order of the phospholipid shells of different size that surround the neutral lipid
core (12).
Deconvolution of the lipid methyl signal envelope of the plasma spectrum as a linear
combination of the amplitudes of the methyl signals from a library of stored standard
subclass spectra results in the determination of the quantitative contribution made by each
subclass to the composite plasma spectrum. In order to perform this analysis, a representative
library of VLDL, LDL, and HDL subclass standards needed to first be isolated and
characterized chemically and physically, as well as by NMR analysis to provide the needed
reference spectra for the computational deconvolution.
The lipoprotein subclass information from the NMR assay was made available for
clinical use in the United States in 1999 in the form of the NMR LipoProfile® test report
Assessment Panel, Subclass Levels and NMR-Derived Lipid Values. The NMR-derived lipid
values for TC, TG, LDL-C and HDL-C are computed from the total lipid values for a given
subclass, based on the assumption that the normal triglyceride:cholesterol ratio of a particular
subclass is invariant in the population, and are expressed in familiar mg/dL lipid units. The
panel also highlights the risk status of the patient according to the NCEP guidelines. The
Lipoprotein Panel section contains the emerging risk factors LDL particle number, large
HDL and large VLDL subclass levels, and average LDL particle size with pattern A/B
classification. The section of the report titled Subclass Levels gives the concentrations of
large, medium and small VLDL, LDL and HDL along with IDL in a bar chart format, while
also depicting the concentrations as percentiles of population data based on results from the
Framingham Offspring Study. The Risk Assessment Panel section contains check boxes that
identify the patient as having higher risk, based on the four parameters in the Lipoprotein
Panel and the presence of lipoprotein traits associated with the metabolic syndrome or
atherogenic dyslipidemia. In the last five years, physicians have ordered and obtained over
one million NMR LipoProfile tests.
The NMR assay has been improved significantly from the time of its initial
introduction. Instead of using four major lipoprotein subclass spectra that were digitally
shifted to cover the span of size ranges from large VLDL to small HDL, more than 30
discrete purified subcomponents have now been included as a basis set. The exclusive use of
real lipoprotein components isolated from normal and dyslipidemic subjects covering the
lineshape and size heterogeneity of the general population has markedly improved the quality
In this paper we report results which establish normal ranges for all lipoprotein
subclass particle concentrations, since, as previously stated, they are the parameters which
exhibit the highest predictive value for the diagnosis of CHD. In addition, we present data
which shows a strong correlation between LDL particle concentration and LDL apoB
concentration. Good agreement for LDL and HDL particle sizes between NMR and GGE is
also established. The merits of using NMR-derived total triglycerides and HDL-C in place of
chemically measured lipids is presented. Finally, the results of standard addition experiments
and precision studies are described which demonstrate the analytical robustness of the NMR
assay.
Materials and Methods BLOOD SAMPLES
Blood was collected in commercially available evacuated tubes containing EDTA from
healthy volunteers after 10 to 14-h fasting. For harvesting chylomicrons, blood was drawn 1
to 3-h after a fat load (15). Informed consents were obtained following protocols approved by
the committee for protection of human subjects of the NC State University. Plasma was
separated by centrifugation (2000xg, 15 min) and kept refrigerated at 40C.
LIPOPROTEIN ISOLATIONS
Lipoprotein preparations were obtained by sequential ultracentrifugation as previously
described (9,16). For the purposes of generating highly purified lipoprotein subfractions with
very narrow size distributions, a combination of ultracentrifugation and agarose gel filtration