GLIMCHER, SHELLEY ANNE. Development of a Tactile-Based Spatial Thinking Assessment using a Hand-Held, Multi-Object Manipulative Puzzle. (Under the direction of Dr. Aaron C. Clark).
Spatial thinking abilities had been studied for over 60 years yet the opportunity existed to develop a new assessment for this construct involving the incorporation of a dynamic component using a manipulative object to better mimic real-world spatial tasks and to integrate
technological advances to go beyond traditional paper-pencil tests readily available for testing levels of the construct. Participants (N = 32) solicited for this dissertation study were students enrolled in an introductory technical graphics course that were willing to complete traditional approaches to evaluate spatial thinking and to attempt a spatial task that required object manipulation. For the study, participants completed a quartet of psychometric assessments followed by attempting to find solutions for five Soma Figure puzzles. The puzzle attempts were videotaped that allowed for a content analysis methodology to further collect information on the spatial thinking process participants preferred when developing a spatial solution.
The research project verified that it was possible to identify levels of intrinsic and extrinsic factors of spatial thinking ability with traditional psychometric assessments. The resulting correlations between the spatial thinking instruments were consistent with those found in previous literature and verified speculated relationships. However, the results of these traditional assessments did not predict success in the solving of the Soma Figure puzzles task highlighting a disconnect between standard spatial thinking assessment methods and an
manipulative objects for use in a classroom setting. A content analysis methodology was used to examine the videotaped Soma Figure puzzle attempts and found evidence that supported the use of holistic and analytical cognitive selection strategies to solve the dynamic task. Additionally, specific characteristics such as starting sequence preference and attempt length were determined and correlated to successful and unsuccessful Soma Puzzle attempts demonstrating the
importance of qualitative aspects in the evaluation of spatial thinking tasks that would not be observed if only quantitative assessment approaches were employed to determine spatial thinking levels as in many previous psychometric spatial thinking instruments. The collected time data from the Soma Figure puzzle attempts was used to suggest a tangible dynamic spatial thinking intervention with appropriate scaffolding designed for use in a technical graphics classroom to help build tactile-based spatial thinking ability skills. While the developed
assessment did not align as expected with the traditional spatial thinking paper-pencil evaluation approaches, the demonstration of the presence of intrinsic and extrinsic factors as well as
by
Shelley Anne Glimcher
A dissertation submitted to the Graduate Faculty of North Carolina State University
in partial fulfillment of the requirements for the degree of
Doctor of Education
Technology Education
Raleigh, North Carolina 2020
APPROVED BY:
_______________________________ _______________________________ Dr. Aaron C. Clark Dr. Cameron D. Denson
Committee Chair
DEDICATION
BIOGRAPHY
Shelley Anne Glimcher was born March 28, 1981 in Fairview Park, Ohio. She attended the Bay Village, Ohio school system from kindergarten through high school graduation in 1999 and then attended The Ohio State University where she double-majored and earned her
Bachelors of Science degree in Chemical Engineering in June 2004 and her Bachelors of Science degree in Biochemistry in August 2004. Between graduations, she married Leonid S. Glimcher in July 2004. She attended The Ohio State University for Graduate School and completed two graduate programs in parallel earning her M.S. in Clinical Pharmacology under Dr. Glen Apseloff and M.S. in Biomedical Engineering under Dr. Deborah Gryzbowski in 2007. Throughout her time at The Ohio State University, she was involved with the First Year
ACKNOWLEDGMENTS
While my name may be on the diploma, this journey was not possible with out the support and love of many people as a doctoral program is a grueling, years-long rollercoaster of a process. Making the change from engineering to education was challenging and I am grateful to many of the professors I’ve had along the way that have helped me realize that I am indeed capable. Specifically, thank you to Dr. Brad Mehlenbacher for a solid foundation into
educational research my first semester of the doctoral program as the lessons I learned in class served me very well the past few years. And thank you to Dr. Latrisha Townsend for
introducing me to qualitative research methods as my dissertation project would have not been possible without the outstanding instruction I received regarding the management, interpretation, and analysis of qualitative data. I’m grateful for the opportunities I had to teach many wonderful students, but one student in particular deserves recognition. Thank you A.J. Long for your unexpected e-mail that helped remind me exactly why I chose this path; the timing of the note’s arrival was better than you can possibly imagine.
management. Thank you to Dr. Brian Matthews for being a unwavering source of
encouragement over the years, for stepping in without question when I lost a committee member, and for the detailed remarks on content and mechanics on my dissertation to shape it a cohesive document worthy of submittal for a doctoral degree. Thank you to Dr. Cameron Denson for being an outstanding mentor that routinely challenged me to think out-of-the-box both inside and outside the classroom, for valuable guidance in my research project development and
methodologies, and for demonstrating so many different ways to show content knowledge that the way I approach teaching has fundamentally changed for the better. Thank you to my advisor Dr. Aaron Clark for the multiple opportunities for departmental graduate support through both teaching and research, for giving me the seed for this project along with the subsequent help necessary to cultivate various iterations until the project was ready to flourish, and
encouragement to take ideas one step further to make more meaningful conclusions.
check-in or making time for me whenever the opportunity arose for a visit, often on short notice regardless of your busy schedules.
I cannot thank my wonderful in-laws, Simon Glimcher and Irina Dlikman, and my amazing mother, Kaethe Buchholz, enough for their support and encouragement over this entire graduate school experience. Without them it would not have been possible to attend any
conference or departmental trips nor get the necessary amount of work done during track-out periods. Even when many miles separated us, their willingness to always take a phone call from their grandchildren and chat for indeterminate amounts of time permitted countless final pushes to finish numerous assignments and projects without the worry of bored minds and empty hands creating additional havoc around the house.
There are three people that sacrificed the most for me to chase this dream, my husband Leo Glimcher and our two children, Berko and Albert. To my husband Leo, to say a simple ‘Thank You’ seems woefully inadequate. For years you have supported this crazy endeavor and never let me quit even when I ready to do so many, many times. This doctoral process certainly has come with it ups and downs but through it all, I am incredibly grateful to have you as my partner. Time to put on our Red Polos and raise our glasses. To my children, thank you for your laughter on otherwise tough days, for tolerating numerous visits to campus and keeping
yourselves entertained, and for understanding that while I may not have always been as available as much as you may have liked, I tried extremely hard to give you a well-balanced, joy-filled life. I hope I have made the three of you proud.
TABLE OF CONTENTS
LIST OF TABLES ... xii
LIST OF FIGURES ... xv
CHAPTER 1: INTRODUCTION ... 1
Introduction...1
Spatial Thinking...3
Rationale ...4
Problem Statement ...7
Research Questions ...8
Research Questions: Phase 1... 8
Research Questions: Phase 2... 9
Methodology ...9
Limitations and Assumptions ...11
Limitations ... 12
Definition of Terms ...13
Summary ...16
CHAPTER 2: LITERATURE REVIEW ... 18
Introduction...18
Importance of Spatial Thinking Assessments ...19
Spatial Cognition ...28
Spatial Cognition: Navigation ... 28
Spatial Cognition: Symbolic ... 30
Spatial Cognition: Object Manipulation ... 33
Spatial Cognition: Limitations ... 34
Defining Spatial Thinking ...36
Spatial Thinking Framework ...48
Intrinsic-Static Spatial Thinking ...54
Intrinsic-Dynamic Spatial Thinking... 55
I-D Spatial Thinking: Spatial Visualization ... 56
I-D Spatial Thinking: Mental Rotation ... 59
Extrinsic-Dynamic Spatial Thinking ... 66
Tactile Spatial Thinking Assessments ...67
Tinkering Self Efficacy Assessment ... 70
Spatial Ability Self-Report Scale Assessment ...72
Santa Barbara Sense of Direction Scale ...76
Factor Analysis and Tactile-Based Spatial Thinking Assessments ...77
Cognitive Selection Strategies ...79
Spatial Thinking Assessments and Technical Graphics ...84
Conceptual Framework ...90
Ethical Considerations ...93
Summary ...94
CHAPTER 3: METHODOLOGY ... 96
Introduction...96
Population and Sampling ...96
Spatial Thinking Instruments ...100
Mental Rotation Test Assessment ... 100
Spatial Ability Self-Report Scale ... 100
Tinkering Self-Efficacy Assessment ... 101
Santa Barbara Sense of Direction Scale ... 102
Research Design ...102
Phase 1: Instrument Administration Design ... 103
Phase 2: Power Analysis and Randomized Complete Block Design ... 103
Procedures...108
Phase 1: Instrument Administration ... 109
MRT Assessment Administration ... 110
TSE Assessment Administration ... 110
SASRS Assessment Administration ... 111
SBSOD Assessment Administration... 111
Phase 2: Soma Figure Puzzle Administration ... 112
Data Analysis ...115
MRT Assessment Scoring... 116
TSE Assessment Scoring ... 116
SASRS Assessment Scoring ... 117
SBSOD Assessment Scoring ... 118
Instrument Correlations ... 118
Factor Analysis ... 121
Phase 2: Data Analysis: Overview ... 123
Soma Figures and Instrument Correlations... 123
Exploratory Factor Analysis ... 124
Non-Parametric Analyses ... 125
Friedman’s Test for Ranks ... 126
Page Test for Ordered Alternatives... 127
Content Analysis ... 129
Soma Figures and Demographic Correlations ... 130
Participant Compensation ...132
Study Limitations ...132
Summary ...136
CHAPTER 4: RESULTS ... 137
Revised Power Calculations ...137
Participant Demographics ...137
Phase 1: Assessment Results ...138
Normality ... 139
Correlation Analyses ... 140
Exploratory Factor Analysis ... 145
Classification of Spatial Thinking Ability ... 147
Demographic Comparison ... 150
Results Recap ... 151
Phase 2: Soma Figure Puzzle Results ...151
Data and Descriptive Statistics ... 152
Soma Puzzle Order Completion Rates ... 153
Overall Solving Time ... 155
Individual Soma Figure Shape Correlation Analyses ... 157
Soma Cube Analysis ... 157
Soma Steps Analysis ... 159
Soma Bathtub Analysis ... 160
Soma Tunnel Analysis ... 162
Exploratory Factor Analysis ... 163
Content Analysis ... 167
Intrinsic vs. Extrinsic Spatial Thinking Ability ...178
Solvers versus Non-Solvers ...181
Friedman’s Test for Ranks...187
Page Test for Ordered Alternatives ...189
CHAPTER 5: DISCUSSION ... 191
Introduction...191
Psychometric Assessments and Spatial Thinking Ability Levels ...196
Tactile-Based Assessment and Spatial Thinking Ability ...199
Recommendations for Future Work ...208
Summary ...215
REFERENCES ... 217
APPENDICES ... 242
APPENDIX A: IRB MATERIALS AND INFORMED CONSENT DOCUMENTS ... 243
APPENDIX B: SOMA FIGURE FORMS ... 247
APPENDIX C: DEMOGRAPHIC DATA COLLECTION SHEET ... 252
APPENDIX D: MENTAL ROTATION TEST ... 253
APPENDIX E: TINKERING SELF-EFFICACY ASSESSMENT ... 259
APPENDIX F: SPATIAL ABILITY SELF-REPORT SCALE ... 260
APPENDIX G: SANTA BARBARA SENSE-OF-DIRECTION SCALE ... 261
APPENDIX H: PHASE 2 SOMA FIGURE RANDOMIZATION ... 262
APPENDIX I: PHASE 2 DATA COLLECTION SHEET ... 263
APPENDIX J: SPATIAL ASSESSMENT SUMMARY DATA ... 264
APPENDIX L: INTRINSIC AND EXTRINSIC SCORES ... 271
APPENDIX M: CONTENT ANALYSIS CODEBOOK ... 272
APPENDIX N: SAMPLE CONTENT ANALYSIS RESULTS ... 275
LIST OF TABLES
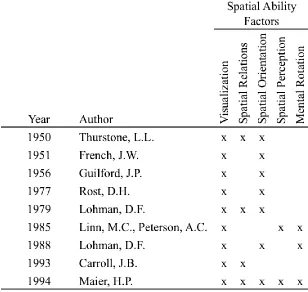
Table 2.1 Early research into spatial thinking ability factors. Modified from Maresch
(2014) and Ilić and Đukić (2017)... 40
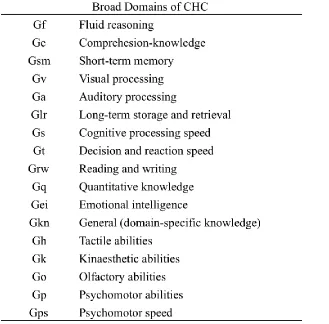
Table 2.2 CHC Broad Domains listed from Schneider and McGrew (2018) ... 42
Table 2.3 Visual processing narrow abilities in CHC Intelligence Theory (Schneider & McGrew, 2018) ... 44
Table 2.4 Additional proposed factors in the visual processing framework compiled from Buckley et al. (2017) ... 47
Table 2.5 Spatial training categories from meta-analysis by Uttal et al., (2013) as presented in Newcombe and Shipley (2015) ...53
Table 2.6 SASRS items for each factor (Turgut, 2015) ... 74
Table 2.7 Spatial Solution Strategies Questionnaire (Moe et al., 2009) ... 82
Table 2.8 Technical graphics topics and spatial instruments ... 88
Table 3.1 Sample RCBD for five participants ... 108
Table 3.2 SASRS items by factor ... 118
Table 3.3 Phase 1 correlations requiring examination ... 119
Table 3.4 Participant compensation ... 132
Table 4.1 Participant Demographic Information ... 138
Table 4.2 Phase 1 Assessment Descriptive Statistics ... 139
Table 4.3 Normality Analysis for Phase 1 Data ... 140
Table 4.4 Phase 1 Assessments Correlation Analysis... 142
Table 4.5 MRT Percentage data CI Intervals for Spearman Correlation Coefficients ... 145
Table 4.6 Phase 1 Exploratory Factor Analysis ... 146
Table 4.7 EFA Factor Loadings ... 146
Table 4.9 Intrinsic and Extrinsic Category Averages ... 149
Table 4.10 Differences in Male and Female Psychometric Assessment Scores ... 150
Table 4.11 Soma Figure Raw Data Collection Times ... 153
Table 4.12 Soma Puzzle Completion Rate Comparison ... 154
Table 4.13 Phase 1 Assessments and Overall Time Correlations ... 156
Table 4.14 Cube Solving Time and Phase 1 Assessment Correlations ... 158
Table 4.15 Steps Solving Time and Phase 1 Assessment Correlations ... 159
Table 4.16 Bathtub Solving Time and Phase 1 Assessment Correlations ... 161
Table 4.17 Tunnel Solving Time and Phase 1 Assessment Correlations... 162
Table 4.18 EFA for Solvers ... 164
Table 4.19 EFA Factor Loadings for Solvers ... 165
Table 4.20 EFA for Participants with at least one Success ... 166
Table 4.21 Factor Loadings for participants with at least one success ... 166
Table 4.22 Content Analysis Overall Results ... 171
Table 4.23 Comparison of Starting Sequence Combinations for Soma Figures ... 172
Table 4.24 Content Analysis Correlations ... 173
Table 4.25 Phase 1 Assessments and Content Analysis Correlations... 175
Table 4.26 Qualitative Content Analysis Items per Soma Figure... 177
Table 4.27 Intrinsic-Extrinsic categories and Content Analysis Results ... 179
Table 4.28 Intrinsic-Extrinsic Categories and Sequence Type Correlations ... 180
Table 4.29 Solvers versus Non-Solvers and Phase 1 Assessments... 184
Table 4.30 Low versus High Solvers of Soma Puzzles ... 186
Table H1 Randomization Order used for Phase 2 RCB Experimental Design... 262
Table J1 Phase 1 Psychometric Assessment Data ... 264
Table L1 Intrinsic and Extrinsic Scores for each Participant ... 271
Table N1 Content Analysis Results for Participant that Solved All Four Soma Figures ... 275
Table N2 Content Analysis Results for Participant that Solved Zero Soma Figures ... 276
LIST OF FIGURES
Figure 1.1 The seven Soma pieces shown in isometric configurations (Gardner, 1959) ... 15
Figure 2.1 Hierarchical arrangement of spatial thinking proposed by Tartre (1990) recreated from Sorby (1999) ...38
Figure 2.2 Carroll's (1993) description of spatial ability, recreated ... 39
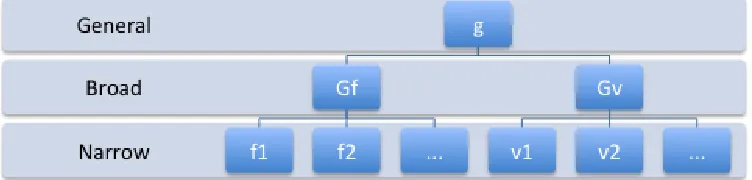
Figure 2.3 Modified partial hierarchical representation of CHC Theory ... 41
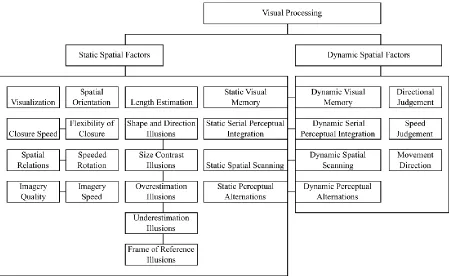
Figure 2.4 Expanded CHC theory factor structure for Visual Processing reproduced from Buckley et al. (2017) ... 46
Figure 2.5 Wooden child's block, photograph by author ... 54
Figure 2.6 Guay's Visualization of Viewpoints assessment sample questions ... 58
Figure 3.1 Soma Figures (L to R) Cube, Staircase, Steps, Tunnel, Bathtub ... 107
Figure 3.2 Soma pieces experimental starting template ... 112
Figure 3.3 Sample solution to the Soma Cube ... 113
Figure 4.1 Plot of Percentage MRT items answered correctly versus MRT Traditional Scoring ... 144
Figure 4.2 Extrinsic Scores versus Intrinsic Scores Graph ... 148
Figure B1 Orthographic and Isometric views of a Soma Cube ... 247
Figure B2 Orthographic and Isometric views of a Soma Staircase ... 248
Figure B3 Orthographic and Isometric views of a Soma Bathtub ... 249
Figure B4 Orthographic and Isometric views of a Soma Tunnel ... 250
Figure B5 Orthographic and Isometric views of the Soma Steps ... 251
Figure K1 Normal Probability Plot for MRT Scores ... 266
Figure K2 Normal Probability Plot for TSE Scores ... 266
Figure K3 Normal Probability Plot for SASRS Scores... 267
Figure K5 Q-Q Plot for MRT Percentage ... 268
Figure K6 Q-Q Plot for Total Solving Time ... 268
Figure K7 Q-Q Plot for Soma Cube Solving Time ... 269
Figure K8 Q-Q Plot for Soma Steps Solving Time ... 269
Figure K9 Q-Q Plot for Soma Bathtub Solving Time ... 270
CHAPTER 1: INTRODUCTION Introduction
“When you want to know how things really work, study them when they're coming apart.” ~William Gibson (2011)
There has been well over 60-years of empirical research on the educational and
occupational significance of spatial thinking abilities and their connection to a variety of STEM-based fields (Wai, Lubinski, & Benbow, 2009). Strong spatial thinking abilities have long been positively associated with technically-oriented fields associated with STEM such as engineering (e.g., Alias, Black, & Gray, 2002; Sorby, 2009; Lin, 2016; Duesbury, 1996; Sorby, 2007), technical graphics (e.g., Marunić & Glažar, 2014; Ernst, Lane & Clark, 2015; Branoff, 2000; Adanez & Velasco, 2004), physics (e.g., Kozhevnikov, Motes, and Hegarty, 2007), biology (e.g., Rochford, 1985), geology (e.g., Kali & Orion, 1996; Orion, Ben-Chaim, & Kali, 1997) and chemistry (e.g., Wu & Shah, 2004; Small & Morton, 1983; Talley, 1973).
number of factors associated with the spatial thinking construct, a general consensus supported the alignment of the various factors within a four-category spatial thinking framework outlined by Newcombe and Shipley (2015), expanded from Chatterjee (2008), Uttal et al., (2013), and Atit, Shipley, and Tikoff (2013). Since the majority of currently available spatial thinking instruments employed at the university-level were paper-pencil-based psychometric tests
involving transformations of 2-D objects to examine a specific factor associated within the broad spatial thinking domain, an opportunity existed to instead explore an object-centered, tactile-based dynamic assessment better mimicking the application of spatial thinking skills in the real world (Newcombe, 2018).
The expanded understanding of the importance of spatial thinking abilities to STEM fields (see Wai et al., 2009), increased integration of technological advances in design-related software such as computer-aided design and/or tools like 3-D printers (Ernst et al. 2015; Wilczynski, 2015), and the shift towards increased incorporation of hands-on learning
opportunities in engineering education (Telenko et al., 2016) were all items providing underlying support for the development of more robust tactile-based spatial thinking assessments. The need remains for innovative, creative, problem-solvers with high spatial thinking abilities leading to an increasing need of a method to identify these individuals (Wai et al., 2009), especially in the fields of engineering, technical graphics, and design (Buckley et al., 2017). Based on extensive previous research detailing the evolution of the understanding of the complexity of spatial thinking (see examples such as Buckley et al., 2017; or Schneider & McGrew, 2018; or
encourage these persons to enter and remain in STEM fields to solve tomorrow’s difficult technological challenges.
Spatial Thinking
With the evolution of the definition of spatial thinking explored in the expanded literature search, this research project focused on the definition provided by Sutton and Allen (2011, p. 5) that described spatial thinking ability as “the performance on tasks that require: (a) mental rotation of objects; (b) the ability to understand how objects appear in different positions; and (c) the ability to conceptualize how objects relate to each other in space”. The classification of spatial thinking abilities or specific factors by levels and/or demographics using psychometric assessments and the development of numerous training methods to improve this malleable ability, had a long and extensive history in higher education research as evidenced by a host of meta-analyses into spatial thinking abilities (see Linn & Peterson, 1985; Maeda & Yoon, 2013; Uttal et al., 2013; Voyer, Voyer & Bryden, 1995; Wang, Cohen, & Carr, 2014).
respectively (Chatterjee, 2008; Buckley et al., 2017). A lack of development of tactile-based assessments using multiple objects in a dynamic fashion to examine spatial thinking abilities existed, indicating that there might be relevant spatial thinking abilities applicable in design work not currently captured through the use of widely available paper-pencil instruments (Newcombe, 2018).
In addition to classifying a person’s spatial thinking ability level, interest remained in identifying and understanding the cognitive selection strategy or rather an individual’s preferred method of processing information to solve spatial problems (Kozhevnikov, 2007). Previous research hypothesized that individuals process spatial information in one of two ways when solving a spatial-based task; either analytically (i.e., partial, piece-by-piece) or holistically (as a whole) with the preference and capability to exhibit strategy flexibility directly related to a person’s inherent level of spatial thinking ability (Khooshabeh & Hegarty, 2010; Shepard & Metzler, 1971; Nazareth, 2015; Khooshabeh, Hegarty, & Shipley, 2013). The type of cognitive strategy selected may depend on task complexity and/or task familiarity with this dichotomy of analytical/holistic strategies valid for intrinsic spatial tasks like mental rotation as well as extrinsic spatial tasks involving orientation/navigation (Nazareth, Odean, & Pruden, 2017; Khooshabeh et al., 2013; Gluck & Fitting, 2003).
Rationale
different methods to assess spatial thinking abilities relevant to engineering design. Previous research emphasized identification of high-level of spatial thinking individuals (Wai et al., 2009) as they might have the potential capabilities to develop increasingly complex spatially-based engineering design solutions. To date, the vast majority of spatial thinking instruments employed in academic research remain paper-pencil-based psychometric tests involving transformations of 2-D objects (Newcombe, 2018). These 2-D based instruments were often employed in conjunction with a spatial training exercise to quantitatively demonstrate potential gains in spatial thinking abilities.
A lack of development of tactile-based assessments using multiple objects in a dynamic fashion to examine spatial thinking abilities currently existed, indicating that there might be relevant spatial thinking abilities applicable in design work not captured through the use of widely available paper-pencil instruments (Newcombe, 2018). This suggested the opportunity for the creation of different assessment methods to fill this knowledge gap. Newly developed spatial thinking assessments ought to focus on items such as object-based manipulatives (Newcombe, 2018; Hegarty, 2010; National Research Council, 2006) that better imitated real-world spatial thinking skills and potentially allowed for the evaluation of proficiencies difficult to capture with traditional 2-D assessment methods.
The organization of spatial thinking factors and assessments into four categories allowed for clearer identification in deficiencies in the spatial thinking research area, revealing the most prominent opportunities for new work existed in the ‘Extrinsic-Dynamic’ category (Newcombe & Shipley, 2015; Uttal et al., 2013). A major limitation in the development of extrinsic-dynamic assessments had been how to ‘scale-down’ a method that could be completed in an indoor
Kozhevnikov & Hegarty, 2001). This research project aimed in part to expand understanding of this extrinsic-dynamic grouping and strived towards the development of a tactile-based
assessment method to better examine encompassing factors not captured with current
psychometric instruments. This work might drive the understanding of an individual’s spatial thinking ability directly related to activities that feature increasingly prominent hands-on active learning opportunities in engineering education through items such as cornerstone or capstone courses, problem- or project-based learning experiences embedded in a course setting, or designettes (Telenko et al., 2016).
Methods currently used to examine and determine cognitive selection strategy include: self-assessments (e.g. Moè, Meneghetti, & Cadinu, 2009, Blough & Slavin, 1987; Lohman & Kyllonen, 1983), response time on a spatial thinking assessment (Goldstein, Haldane, & Mitchell, 1990), eye tracking software (e.g., Nazareth et al., 2017; Odean, Nazareth, & Pruden, 2015; Hegarty, 1992), and spatial language (Boone & Hegarty, 2017; Pruden, Levine &
Huttenlocher, 2011) each with their own pros and cons. While there was increasing interest in the incorporation of more eye-tracking methods in spatial thinking research, this method lacked robustness in data analysis due to technical limitations in data interpretation, required physical constraint in movement while wearing the apparatus, and was not able to evaluate multiple objects (Nazareth, 2015) making this approach not compatible with a potential extrinsic-dynamic spatial thinking task as designed for this study. Abbasi, Burkhardt, and Denis (2009) completed a study with a Soma Cube-like manipulative task and suggested observing the part order
of a content analysis methodology to gain information regarding how participants used different approaches with a dynamic-based multi-object manipulate spatial thinking task.
There was support in the research literature for gaps in the development of spatial thinking assessments that incorporated a manipulative object (Newcombe, 2018), opportunities for the creation of spatial thinking assessments appropriate for the extrinsic-dynamic framework category (Newcombe & Shipley, 2015), and continued examination of cognitive selection strategy with tasks mimicking real-world experiences (Kozhevnikov, 2007). These literature gaps led to the this research project that aimed to investigate the development of an extrinsic-dynamic, tactile-based spatial thinking assessment using a hand-held manipulative object with the ability for the examination of preferred cognitive selection strategies and identification of spatial thinking level abilities of individuals beyond traditional paper-pencil assessments. The development of these more robust methods to evaluate spatial thinking paralleled shifts in engineering education with increased use of 3-D technologies (Ernst et al., 2015).
Problem Statement
important for success in developing solutions to increasingly complex engineering design problems.
Research Questions
The hypotheses for this research project centered around determining a distinction between intrinsic and extrinsic spatial thinking abilities with psychometric assessments, development of a tactile-based spatial thinking assessment theoretically appropriate for the extrinsic-dynamic category of Newcombe and Shipley’s (2015) spatial thinking framework, finding evidence for cognitive selection strategies when solving hand-held manipulative puzzles, and the development of an intervention with appropriate scaffolding for use in a technical graphics classroom. The psychometric assessments chosen for this research study included the Mental Rotations Test (MRT; revised version by Peters et al., 1995), Tinkering Self Efficacy Assessment (TSE; Mamaril, Usher, Li, Economy, & Kennedy, 2016), Spatial Ability Self-Report Scale (SASRS; Turgut, 2015), and Santa Barbara Sense of Direction Scale (SBSOD; Hegarty, Richardson, Montello, Lovelace, & Subbiah, 2002). The hand-held manipulative object chosen for this study was a Soma Figure and various shape iterations using the same seven puzzle parts.
Research Questions: Phase 1
1.0 Is it possible to distinguish between the hypothesized intrinsic and extrinsic factors of spatial thinking from traditional 2-D psychometric assessments?
1.1 What correlations exist between the various combinations of the quartet of psychometric assessments?
Research Questions: Phase 2
2.0 Does the tactile-based Soma Figure puzzles spatial thinking assessment correlate to an extrinsic and/or intrinsic category of spatial thinking?
2.1 What correlations exist between combined overall solving time and specific shape solving time to the quartet of Phase 1 assessments?
2.2 Do the specific Soma shapes based on solving time load on an intrinsic or extrinsic factor of spatial thinking?
3.0 If evidence exists to support cognitive selections strategies using a content analysis methodology, how does this relate to an intrinsic and/or extrinsic categorization?
3.1 Does this change when examining solvers versus non-solvers?
4.0 Is it possible to rank order the Soma Figures by difficulty level based on completion time to help create a tactile-based spatial thinking intervention with appropriate scaffolding?
Methodology
quantitative and qualitative data analysis methods. The methods as described below were reviewed and approved by the North Carolina State University Institutional Review Board prior to any solicitation for study participants.
Potential participants in the research project were solicited to as a group by the researcher in all of the introductory level technical graphics courses in the Fall 2019 semester at North Carolina State University. Interested participants (over 60 students) provided contact information for a follow-up e-mail to set-up an individual research session. Subjects were enrolled in the study on a rolling basis over a two-week period until the minimum sample size was reached. Demographic information for every enrolled subject was collected prior to the start of the two data collection phases of this research project. Details regarding all of these above and following methods are available in chapter three.
Phase 1 was comprised of a quartet of psychometric assessments including the Mental Rotation Test (MRT; Peters et al., 1995), Tinkering Self Efficacy Assessment (TSE; Mamaril, et al., 2016), Spatial Ability Self-Report Scale (SASRS; by Turgut, 2015), and the Santa Barbara Sense of Direction Scale (SBSOD; Hegarty et al., 2002). These assessments provided baseline information about an individual’s spatial thinking ability as it had been traditionally tested and allowed for quantitative statistical analyses (parametric and non-parametric as appropriate) to examine correlations between the instruments, a factor analysis to delineate if it is possible to separate intrinsic versus extrinsic factors, and to determine spatial ability levels of the various individuals. The results from the analyzed Phase 1 data are provided in chapter 4.
Using a Randomized Complete Block Design, Phase 2 of the research study was
aligning with the extrinsic-dynamic category. The Soma Figure puzzles were selected along with technical graphics faculty based on familiarity, likeness to shapes on previous 2-D psychometric spatial thinking tests, and similarity to forms used in introductory technical
sketching exercises. The solving attempt time results were correlated to Phase 1 assessments and examined for evidence for underlying extrinsic and/or intrinsic factors to determine the spatial thinking category for this assessment. The results from the analyzed Phase 2 data are presented in chapter four.
The Soma Figure solving attempts were videotaped for a content analysis methodology to determine number and length of attempts, preference for attempt starting pieces, solving
sequence where applicable, and evidence supporting cognitive selection strategies. Lastly, non-parametric analyses were used to rank order the Soma Figures based on solving time to
determine if an order existed that would appropriately scaffold the figures by difficulty for an intervention intended for students in a technical graphics classroom. Data collection for Phases 1 and 2 was completed in a single 80-minute (maximum) session per participant. Each of the 32 participants was compensated for their time at the end of their data collection period.
The collected quantitative data was analyzed with appropriate calculations using the web-based Statcrunch statistical client, STATA/SE 15, or in some cases by hand using Excel if a large sample approximation was required or to calculate confidence intervals of correlation
coefficients. The specific statistical analyses used are outline in the chapter three methodology section.
Limitations and Assumptions
thinking assessment that could be attempted in a classroom-like setting within a reasonable time frame. In the same vein, replication of the study methods from one participant to another was assumed to be possible even if the research study might be administered in various spaces or at different times of the day. Second, it was presumed that the selected participant sample
reasonably represented the population in a university-level introductory technical graphics course for whom this research was intended to help, but not necessarily representative of all
undergraduate students in engineering or otherwise at a land-grant public university. Third, it was expected that participants were working to the best of their ability on timed portions of the data collection and did not have high levels of apathy due to illness, underlying stress, or intentional aloofness. It was not possible to neither predict nor control a participant’s mood, alertness, disinterest, nor half-heartedness towards completing any of the instruments or attempts at any Soma Figures. Active participation was evaluated with collected video data if there were significant doubts regarding effort. Lastly, specific assumptions with various statistical tests were included in the Chapter 3 methodology section as needed (e.g. assuming normal
distributions for collected instrument data). Limitations
Limitations in the following categories existed requiring acknowledgement and
and able to meet during the data collection time were enrolled in the study limiting the ability to have used a stratified sampling technique for demographic items of potential interest like gender. The population estimates for the power analysis were taken from results from a similar study performed by Abbasi (2010) with a Soma-like cube but that study did not use an exactly identical Soma parts as this study and was completed with a graduate student population. This indicated that the sample size calculation would need revisiting once data collection began to check the population parameters estimate assumption. While only five Soma Figures were selected for this research project, many others existed that might help better distinguish between high- and low-levels of spatial thinking abilities or better align with an intrinsic and/or extrinsic category. It was not viable to test tens or hundreds of different Soma Figures to determine the ideal
combinations due to limitations in time and participant willingness. While this study took place mid-semester of an introductory technical graphics class, some participants might still be
uncomfortable with translating the main features of the Soma Figure as shown in a 2-D isometric orientation to a 3-D model.
While there was confidence in the overall study methods, even with the assumptions and limitations of this research study, as the literature review backed the assessments selected and the outlined study design. The opportunity existed to complete a project that would contribute to the growing body of knowledge in spatial thinking and help with the development of a wider variety of assessments in the future.
Definition of Terms
Spatial thinking: “the performance on tasks that require: (a) mental rotation of objects; (b) the
conceptualize how objects relate to each other in space” from Sutton and Allen (2011, p.5).
Intrinsic-Static: Coding the spatial features of objects including their size and arrangement of
their parts; their configurations (Chatterjee, 2008; Newcombe & Shipley, 2015).
Intrinsic-Dynamic: Transforming the spatial coding of objects, including rotation,
cross-sectioning, folding, plastic deformations (Chatterjee, 2008; Newcombe & Shipley, 2015).
Extrinsic-Static: Coding the spatial location of objects relative to other objects or to a reference
frame (Chatterjee, 2008; Newcombe & Shipley, 2015).
Extrinsic-Dynamic: Transforming the inter-relations of objects as one or more of them moves,
including the viewer (Chatterjee, 2008; Newcombe & Shipley, 2015).
Soma Figure: A form created using all seven Soma pieces. The forms used in this research
project are available in Appendix B. A comprehensive listing of possible forms is available online:
https://www.fam-bundgaard.dk/SOMA/FIGURES/FIGURES.HTM
Soma Pieces: As shown in Figure 1.1, the seven irregular puzzle pieces used to construct a cube
Figure 1.1: The seven Soma pieces shown in isometric configurations (Gardner, 1959).
Mental Rotation Test (MRT): A psychometric assessment developed by Vandenberg & Kuse
(1978) to test mental rotation abilities of spatial thinking. Updated by Peters et al., (1995). The revised copy by Peters et al. (1995) is available in Appendix D.
Tinkering Self Efficacy (TSE) Assessment: A survey-based assessment developed by Mamaril et
al. (2016) to examine the connection between spatial thinking ability and self-efficacy of engineering students. The TSE Assessment can be found in Appendix E.
Spatial Ability Self-Report Scale (SASRS) Assessment: A survey-based assessment developed by
Santa Barbara Sense of Direction (SBSOD) Scale Assessment: A survey-based assessment developed by Hegarty et al. (2002) to evaluate large-scale spatial abilities in the
navigation area of spatial cognition. The items included in the SBSOD Assessment are available in Appendix G.
Cognitive Selection Strategy: An individual's preferential method of processing information to
solve spatial problems (Kozhevnikov, 2007) with the main strategies being ‘Analytical’ or ‘Holistic’.
Analytical Method: A cognitive selection strategy where individuals focus on only a piece of an
object at a time and then mentally rotate each piece in turn to mentally rotate an object (Khooshabeh et al., 2013); also referred to as the “Piecemeal” method.
Holistic Method: A cognitive selection strategy where individuals focus on an object as a whole
without needing decomposition to pieces and is noted as the “ideal” strategy (Khooshabeh & Hegarty, 2010); also referred to as the “Global” method. Summary
psychometric assessments as noted in Uttal et al. (2013). These traditional assessments were integrated into this study for comparison purposes to demonstrate potential connections to the tactile assessment centered on solving various Soma Figures in a controlled environment. The assessment described and implemented in this study aligned with curriculum shifts in
CHAPTER 2: LITERATURE REVIEW Introduction
“The qualities which make for greatness in scientists and engineers are of a different kind; ability to think abstractly and analytically together with skill in visualizing spatial relations in two or three dimensions, . . . All these qualities, which are vitally important in almost all branches of science and engineering, are measured by appropriate tests of spatial ability.”
- I. M. Smith (1964, p. 300)
This chapter served to provide information about the importance and development of spatial thinking assessments in general and with respect to technical graphics. While a clear consensus definition of spatial thinking did not exist, extensive previous literature and research suggested that multiple factors contribute to the construct with a host of psychometric tests developed to attempt to quantify spatial thinking ability levels. The literature review section was intended to describe the identification those various factors as spatial thinking research
available through academic search engines with access to the materials (articles, dissertations, theses, electronic books) via the NC State University library system.
Importance of Spatial Thinking Assessments
In 1957, a trio of publications laid the groundwork for the interest and development of spatial thinking assessments to identify individuals with high cognitive ability. Super and Bachrach (1957) published Scientific Careers, a National Science Foundation report that identified attributes necessary in successful scientists and engineers including spatial ability, mathematical ability, as well as persistence as each had a critical role. The idea was that if these traits, such as spatial ability, could be identified through assessments then energy and resources could be dedicated to nurturing individuals with potential technical gains coming in the form of scientific and technological advancement. Additional publications by Cronbach (1957) and Paterson (1957) emphasized the importance of tailoring educational interventions and
opportunities according to individual abilities, again calling for the nurturing of specific talents, an idea since echoed in later work by Wai et al. (2009). From these publications the era of standardized assessments and longitudinal testing of mathematical, verbal, and spatial abilities began with the original intent to identify intellectually talented youth and determine whether these individuals entered and then remained in STEM fields as they progressed through academic endeavors and into careers.
need for the development of spatial assessments across a wide spectrum of ages (e.g., Farmer,
Gerretson, & Lassak, 2003; Verdine, Irwin, Golinkoff, Hirsh-Pasek, 2014; Wolfgang, Stannard,
Jones, 2001). Earlier identification of spatial thinking ability levels permitted the selection of the
most appropriate trainings and interventions for each individual to appropriately enhance their
innate abilities. As recently as 2010, the National Science Board noted that rather than just focus
on verbal and math skills, searches for potential STEM talent ought to expand to include spatial thinking ability again highlighting the need for assessment methods available for a wide variety of populations (National Science Board, 2010). Based on longitudinal studies and previous research, Wai et al. (2009) outlined three major generalizations to support development of assessments to test spatial thinking:
1. Spatial thinking ability was an important characteristic among adolescents that achieved advanced education and occupational credentials in STEM fields.
2. Spatial thinking ability was an important factor not just for intellectual gifted individuals, but also played a role in educational and occupational outcomes in the general
population.
3. Contemporary talent searches overlooked many intellectually talented individuals by restricting selection criteria to mathematical and verbal abilities.
This last generalization applied directly to this research study, as one of the major aims was to develop a novel assessment administered differently than the typical paper-pencil instruments used in talent searches and traditional classroom settings.
Originally, it was widely assumed that spatial thinking ability was a static, innate
attribute that differed for each individual but remained constant over time. However, a recent
spatial thinking ability through the use of various interventions ranging from the formal training
available through the study of technical graphics (e.g., Asoodeh, 1993; Connolly, 2007; Ernst &
Clark, 2009; Marunić, & Glažar, 2014; Sorby, 2007; Spangler, 1994; Turner, 1997), to play with inherently spatial objects such as blocks (e.g., Cockburn, 1995; Day, Engelhardt, Maxwell, &
Bolig, 1997; Gibbon, 2007; Longstreth & Alcorn, 1990), to informal experiences that used virtual reality and/or video games (e.g., Larson et al., 1999; Rafi, Samsudin, & Said, 2008;
Miller, 1995; Basak, Boot, Voss, & Kramer, 2008; Cherney, 2008; De Lisi & Wolford, 2002; Okagaki & Frensch, 1994; Sims & Mayer, 2002; Terlecki, Newcombe, & Little, 2008) and even to a variety of athletic endeavors (e.g., Ozel, Larue, & Molinaro, 2002; Sridevi, Sitamma, & Rao,
1995; Goulet, Talbot, Drouin, & Trudel, 1988). Hawes, Tepylo, and Moss (2015) explored how spatial thinking could be improved through practice and targeted their study on examining
interventions designed for children that could be integrated into a classroom setting, such as
construction play with wooden blocks or Legos (e.g., Casey et al., 2008; Nath & Szucs, 2014),
puzzle play with jigsaw puzzles or tangrams (e.g., Levine, Ratcliff, Huttenlocher, & Cannon,
2012; Verdine, Troseth, Hodapp, Dykens, 2008), drawing tasks such development of 2-D
geometric designs (e.g., Tzuriel & Egozi, 2010), and paper folding like with origami (Taylor &
Hutton, 2013; Cakmak, Isiksal, & Koc, 2014). For adult learners, Sorby (2009) presented a pre-
and post-paper-pencil spatial assessment showing gains in spatial ability levels after students
participated in a technical graphics course involving technical drawing and mastering topics such
as orthographic and isometric projections. Many different experiences, opportunities, and
practices were available that might help individuals improve spatial thinking skills indicating that
for the continued development of a wide variety of spatial assessments to complement the
various methods used to study spatial thinking abilities and potential gains.
Recent research by Newcombe (2018, p. 535) specifically stated, “Despite the fact that
we have had hundreds of spatial tests, we have not exhaustively or rigorously explored
object-centered spatial skills” again highlighting the current need to keep developing more robust
testing options for spatial thinking ability. Many developed spatial thinking assessments relied
on static paper-pencil evaluation, especially for adult learners, leaving ample room for
development of assessments with a dynamic component that incorporated manipulation of an
object. This shift in assessment style might potentially help to identify individuals with high
spatial abilities previously overlooked with traditional spatial thinking instruments.
Lean and Clements (1981) compiled a list of categories that students with poor spatial
thinking skills might encounter difficulties with including: translations, reflections, rotations,
dilations, and expansions. Having the ability to mentally rotate objects and manipulate
geometric shapes formed the basis of being able to communicate graphically, an increasingly
important skill in STEM fields to clearly communicate design intent (Ernst et al., 2015)
suggesting that students with difficulties in spatial thinking skills might also have trouble
creating formal documentation often required with engineering design projects. As Uttal’s et al.
(2013) meta-analysis provided support for spatial thinking ability being malleable and
improvable with interventions, further suggested that deficiencies like those listed by Lean and
Clements (1981) could be mitigated with proper identification of an individual’s spatial thinking
ability level and then selection of appropriate spatial interventions. For example, Sorby (2009)
sought to create experiences to enhance spatial thinking through the use of technical graphics
and standard as well as auxiliary views all of which specifically helped to build skills relating to
the spatial concepts of translations, reflections, and rotations. Additionally in the realm of
technical graphics, course activities related to design such as freehand sketching and computer-aided design increased spatial abilities (Lord, 1985; Martín-Dorta, Saorin & Contero, 2008; Onyancha, Derov, & Kinsey, 2009; Rafi et al., 2006) by again giving individuals relevant experiences to help in the challenging areas outlined by Lean and Clements (1981). Lin (2016) suggested that these types of studies that focused on technical graphics topics as valid
intervention methods gave credence to the idea that this material ought to be further integrated into engineering design coursework to not only improve spatial thinking skills, but also mitigate potential problem areas that would hinder graphical communication (Lin, 2016).
how this ability was measured combined with the development of domain appropriate interventions.
For example, the concept of chirality was central to organic chemistry meaning that chemists needed the ability to understand how molecules existed in a 3-D space using mental imagery since it was (currently) difficult to directly examine a molecule in its native state. So, organic chemistry instruction greatly relied on 2-D printed images in textbooks, requiring mental transformation to be performed by students as they learned the abstract material (Abraham, Varghese, & Tang, 2010). Since these mental transformations could be difficult for entry-level organic chemistry students, instructors often encouraged students to obtain and use a set of readily available molecule-building kits that allowed a student to physically construct and manipulate representative models. This tactile method was shown in previous research as an effective way to teach domain-specific spatial skills in organic chemistry (Small & Morton, 1983; Gabel & Sherwood, 1980; Talley, 1973). This tactile approach to help build specific spatial thinking skills might be translated to other fields and replicated with domain-appropriate manipulative objects.
On a different end but similar note, an engineer might approach design through a
passively like in a lecture-based course (Prince, 2004). Tinkering with tangibles was an easy way to engage into a design problem (Jermann, Zufferey, & Dillenbourg, 2008) and was identified as lacking in current spatial thinking assessments. With this shift toward active learning along with team-based problem solving (Telenko et al., 2016) that gave additional opportunities for tinkering and increased incorporation of tactile spatial thinking skills, supported the urgency to develop an assessment aligning with this spatial thinking ability (Wilczynski, 2015; Smith, Sheppard, Johnson, & Johnson, 2005; Tsang, Van Haneghan, Johnson, Newman, Van Eck, 2001). A longitudinal study by Shea, Lubinski, and Benbow (2001) suggested a correlation between spatially-gifted individuals and not just high grades in science and math courses but also high marks in vocational coursework found in CTE-fields and with hobbies centered around building and/or tinkering. This suggested the importance of a hands-on
component in the development of high levels of spatial thinking skills useful in STEM domains including engineering design and technical graphics. In semi-formal interviews with working engineers and university-level engineering instructors regarding spatial thinking, Hsi et al. (1997) revealed general support for not only innate spatial thinking abilities, but also observation from professionals that a hands-on tinkering approach was a valid way to gain and/or increase spatial thinking skills that further suggested additional study of this phenomenon.
the user to make connections, combinations, find alternatives, problem solve, use spatial thinking ability, and explore variety within unity (the ability to make the same form in different ways) providing strong support for the idea that a Soma Cube might be an appropriate manipulative to use in a tactile spatial thinking study for the technical graphics domain.
As noted in Newcombe and Shipley (2015), the study of between-object spatial thinking skills had been largely neglected as the focus of spatial thinking had long been on paper-pencil assessments with normative questions that lend themselves to easy and quick quantification in the fields of cognitive science and neuroscience. Ernst et al. (2015) echoed the need for more research into testing and assessing spatial thinking as curriculums shifted to incorporate 3-D modeling, 3-D printing, increased levels of image processing and simulation such as with VR, and increased prevalence of these items in careers related to STEM fields. Previous work by Ho, Eastman, and Catrambone (2006) suggested a connection between 2-D and 3-D spatial skills did indeed exist based on experiments in a gaming environment. Therefore when exploring a new 3-D tactile-based method to examine spatial thinking, it was important to check for correlations to previous 2-D psychometric instruments which was done in this research study. Eventually, a 3-D tactile-based spatial thinking instrument might be used in conjunction with 2-3-D instruments to assess cognitive gains in dynamic interventions (e.g., hands-on cornerstone or capstone design projects) at the university level.
Tinkering was defined as a branch of making that emphasized creative, improvisational
problem solving using open-ended design principles to construct objects or installations using a
wide variety of tools to develop a personally meaningful idea (Bevan, Gutwill, Petrich, &
Wilkinson, 2015). The shift from traditional lecture-based classes to deliver technical
that involved more tinkering-like activities in university-level engineering programs illustrated
the shift to incorporate a wider variety of tactile experiences (Telenko et al., 2016). Thus, there
ought to be a parallel development of assessment methods to determine gains in spatial ability
better aligned with current pedagogical methods being employed in the classroom setting
expanding from assessments currently geared towards the evaluation of team effectiveness and
dynamics (Hirshfield & Koretsky, 2017). A dynamic assessment might better capture spatial
thinking gains in dynamic interventions. Solving spatial problems such as the Soma Figure
puzzles involved visualizing and manipulating a wide variety of spatial information including
different shapes, configurations and their alternatives, understanding of the relative locations
with respect to multiple object, and how these could all change during the problem solving
process (Atit et al., 2013) making this simple task that encouraged tinkering an ideal candidate
for the development of a 3-D spatial thinking dynamic assessment suitable for adult learners.
So, how might students that excel in activities that more align with tinkering be tested for
spatial thinking ability in a more familiar fashion than the traditional paper-pencil
assessments? Was there a link between confidence in tinkering and spatial thinking ability? Did
a correlation exist between standard 2-D static assessments and a tactile-dynamic assessment?
Was it possible to elucidate flexibility in solving strategies to give a more complete view of
spatial ability? Was it possible to devise a tactile-based intervention with appropriate
scaffolding? These were a sample of the questions explored within this research project that
aimed to develop a dynamic, tactile spatial assessment protocol suitable for use in conjunction
with current static psychometric methods to better evaluate an individual’s spatial ability in a
Spatial Cognition
Three types of spatial cognition were described by Newcombe (2018): Navigation in terms of location and movement tracking on a large scale, object manipulation of items that fit in a hand that involved some type of a transformation, and symbolic which might involve language, analogy, and/or gesture among others representations such as maps. This expanded upon
previous work where Newcombe, Uttal, & Sauter (2013) identified the two domains of spatial skills as navigation and tool design. These categories stemmed from distinguishing between
large-scale and small-scale spatial abilities and their respective frames of reference (Schneider &
McGrew, 2018).
Spatial Cognition: Navigation
Navigation referred to the ability to move bodies through space, understand the spatial relationships of static and dynamic bodies, and was a skill with distinct evolutionary roots (Newcombe et al., 2013; McGarvey, Luo, & Hawes, 2018; Newcombe, 2018). This large-scale spatial ability involved an egocentric spatial transformation meaning that a person’s internal perspective or frame of reference changed in regards to the environment but the relationship with the objects did not change (Schneider & McGrew, 2018; Hegarty & Waller, 2004; Newcombe et al., 2013; Wang et al., 2014). The ability to navigate permitted people to locate a new place, to maintain a sense of direction and location, to make the connection that a 3-D space could be represented with a 2-D map, and gain awareness to use landmarks to further orient themselves (McGarvey et al., 2018; Hegarty, 2010; Newcombe et al., 2013; Wolbers & Hegarty, 2010; Yilmaz, 2017).
Montello, 1998; Hegarty, Burte, & Boone, 2018). Landmark knowledge referred to knowing about discrete objects that were present in an environment such as recognizing a particular monument at a specific intersection. Route knowledge referred to knowing a sequence of landmarks and actions associated with them, like having to turn left onto a one-way street when you came to the intersection with a particular monument. Survey knowledge referred to an individual’s understanding of the layout of the environment, including distance and direction between landmarks, and potential routes of travel including short cuts that were not otherwise familiar. The advent of technology had made the process of navigation significantly easier, but only in recent years affordable global positioning systems had become readily available, an underlying reason for the lack of research into this spatial cognitive area compared to object manipulation and symbolic spatial cognition areas (Newcombe, 2018). Additionally, studies involving fMRI to better pinpoint the area of the brain responsible for navigation were not currently possible due to technical limitations and the lack of sensitive mobile instrumentation available for field-testing (Newcombe, 2018).
Evidence existed that large-scale spatial abilities such as navigation were distinct from small-scale spatial abilities (Lorenz & Neisser, 1986; Hegarty & Waller, 2004; Newcombe et al., 2013; Wang et al., 2014). Research by Kozhevnikov and Hegarty (2001) employed a novel spatial thinking test to show that an individual’s object manipulation ability did not reflect their spatial orientation ability suggesting that while difficult, it was possible to develop independent assessments for perspective-taking strategies associated with the spatial cognition area of navigation. This meant that testing an individual’s ability to navigate a cityscape did not
fall under the object-manipulation category and perspective-taking category under navigation had distinct neural bases indicating these items were supported by different brain areas
depending on the spatial task (Chatterjee, 2008). Additionally, most people could evaluate their own navigation abilities fairly well, so self-reported assessments of large-scale spatial abilities had shown as reasonable predictors of objective measures (Hegarty et al., 2002; Hegarty et al., 2018). Besides difficulty in creating assessments, a major issue plaguing the study of large-scale spatial abilities dealt with the potential ability of individuals to shift strategies in navigation tasks (e.g. from route knowledge to survey knowledge or from an egocentric to allocentric frame of reference) paralleling issues in solving small-scale spatial tasks detailed later. Hegarty et al. (2018) suggested that the difference in individual large-scale spatial ability might stem from flexibility to switch between strategies and hence the enhanced ability to select of the type of knowledge or frame of reference that best applies to the particular situation. This concept of cognitive strategy selection was explored in this research with regards to object manipulation. Spatial Cognition: Symbolic
benefits of incorporating higher rates of spatial words at a young age by caregivers while also highlighting a significant gender differences in that adults tended to use more spatial words with boys than girls. Also, research supported the observation that the sheer number of spatial utterances in a child’s vocabulary correlated to their spatial ability and performance on spatial tasks (Miller, Vlach, & Simmering, 2017). Spatial words helped to teach more complex mathematical concepts to children such as how to interpret angle size (Gibson et al., 2015) making the case for the increased inclusion of spatial-based language purposely incorporated into curricula. A number of limitations and challenges existed when examining the connection between spatial thought and language (Newcombe et al., 2013) including the concept of linearity where words were given one-at-a-time in a sequence, so only one spatial relation could be described at a time (Newcombe & Huttenlocher, 2000). Additionally, difficulty in
communicating multiple locations might present a challenge for a person to enumerate and subsequently equally difficult for a listener to completely process (Brunyé, Rapp, & Taylor, 2008). While the opportunity existed to examine the spatial language of adults when it comes to solving a spatial task, that was not a specific goal of this research project but potential a future addition to the research methods.
verbal abilities were associated with differences in gesture production (Alibali, 2005). For example,it was shown that individuals with high spatial ability but difficulty verbalizing thoughts, were more likely to gesture (Hostetter & Alibali, 2007). It was suggested that gesture might help reveal different spatial strategies that an individual was using to solve a spatial task (Kita, Danziger, & Stolz, 2001) highlighting this phenomenon as an item of potential interest when aiming to develop a tactile-based spatial assessment. With the increasing development and availability of technology aiming to bridge the gap of human-computer interaction, van den Hoven and Mazalek (2011) first defined the concept of Tangible Gesture Interaction that combined the communicative gesture with manipulation of the physical world leading to the development of items like the Tangible Gesture Interaction Frameworks (TGIF) to describe how objects were physically manipulated (Angelini, Lalanne, Hoven, Khaled, & Mugellini, 2015). Interestingly, as compared to children, adults tended to use significantly more spontaneous gestures when communicating spatial information (Sauter, Uttal, Alman, Goldin-Meadow, & Levine, 2012) further indicating potential examination of this symbolic spatial tool if/when considering the incorporation of a talk out-loud method to describe solving of a spatial task. The availability of video recording equipment and digital processing capabilities were no longer a major limitation to examining gesture as it might have been in past studies.
Much of the development of spatial cognition that occurred past the preschool years was largely attributed to interaction with symbolic systems (Newcombe et al., 2013). In addition to language and gesture, the act of sketching whether it was maps, diagrams, or simple 2-D
models, and their representative spaces (DeLoache, 1987; Loewenstein & Gentner, 2005; Blades & Cooke, 1994; Vosmik & Presson, 2004; Huttenlocher, Vasilyeva, Newcombe, & Duffy, 2008; Liben & Downs, 1993; Liben, Kastens & Stevenson, 2002; Uttal, Fisher, & Taylor, 2006; Davies & Uttal, 2007). The inclusion of a method to capture symbolic spatial cognition factors ought to be considered when designing spatial assessments as this might give a more comprehensive understanding of how individuals approach and solve spatial tasks.
Spatial Cognition: Object Manipulation
The vast majority of spatial cognition work occurred in the area of object manipulation (stemming from the interest in intelligence testing previously mentioned) due to the ability to validate spatial instruments manipulated into a common format (e.g., multiple-choice questions on paper) with administration possible under practical limitations such as material availability and time constraints (Newcombe, 2018). This area of spatial cognition included research into topics like mental rotation, mental transformation, cross-sectioning, bending, folding, and patterns; all of which had psychometric tests available to examine differences in spatial thinking ability levels between individuals. These psychometric assessments often focused on within-object skills such as the rotation or slicing of a single within-object but not on between-within-object spatial skills (Newcombe et al., 2013) meaning they did not necessarily test the spatial abilities
examined in far more detail later in this document with a discussion on nomenclature, theory development, framework for this research, and common spatial thinking assessments.
Spatial Cognition: Limitations
Even with the thousands of psychometric tests developed, Newcombe (2018) pointed out three serious limitations when studying spatial cognition:
1. The difficulty in separating the underlying factors even when using factor analysis and hence comparing the validity of competing assessments.
2. No systematic way of evaluating the types of spatial skills used by people in everyday life; the lack of tactile components.
3. Spatial testing not keeping up with the latest technology available or relying to heavily on outdated technology meaning whole areas of spatial skills might currently be completely overlooked.
These first two issues were echoed by Yilmaz (2017) while examining the development of tools to measure spatial ability. Factor analyses studies for the same instrument could come to statistically valid different conclusions. For example, see Ernst et al.’s (2017) factor analysis of the complete Purdue Spatial Visualization Test: Rotations (PSVT:R) versus that of Maeda, Yoon, Kim-Kang, and Imbrie (2013) to see the disagreement in the number of underlying factors associated with a widely-used spatial thinking assessment. Parsing through the pencil-paper spatial thinking assessments, one might notice that many of the instruments used objects not necessarily familiar to the average person. This unfamiliarity might be acceptable unless the information could be interpreted in different ways. Branoff (2000) demonstrated this
projection theory, a topic introduced in technical graphics instruction and used extensively to communicate design.
Branoff (2000) validated that converting the PSVT:R from isometric pictorials to trimetric pictorials of common objects was possible indicating that assessments might be
modified to better mimic real-world situations, an idea expanded on by Ernst et al. (2015). Even so, pictorial conversions still did not test spatial thinking abilities in a manner that truly
mimicked real-world spatial dilemmas people encountered on a regular basis like how to best pack a suitcase, a trunk of a car, or even a dishwasher. This suggested that an opportunity
existed to develop an assessment focusing on combining multiple objects to fit or create a certain form, that made a manipulative with many different forms like a Soma Figure an ideal candidate for a tactile-based assessment.