Extraction of Vegetation Regions in High
Resolution Satellite Data Based On Spectral
Indices and Marker Controlled Watershed
Segmentation
P.Swathika, A. Ravi Raja
M.Tech, Department of ECE, V R Siddhartha Engineering College, Vijayawada, India
M.Tech, Department of ECE, V R Siddhartha Engineering College, Vijayawada, India
ABSTRACT: Trees are known as structural element of ecosystems. Identifying and delineating the tree regions are
important to know the land occupied by them, for balancing the climate conditions. In this paper a series of steps are given to extraction the vegetation regions in Multispectral High Resolution Satellite Images. Image enhancement techniques are applied to satellite image for improving contrast of an image. Bands like Near Infra-Red band (NIR), Visible Red band (VIR), Visible Blue band (VIB) are extracted from the satellite image to calculate the spectral indices called Normalized Difference Vegetation Index (NDVI) for identify the vegetation area. Local threshold value based on NDVI is set for obtaining tree regions followed by pre-processing techniques for removal of noise, sharpening the edges, filtering the image. Region properties of trees are determined. The vegetation area boundaries and their locations are determined using Marker controlled watershed segmentation method. Watershed segmentation method produces a complete boundary around the vegetation area. The final results are compared with manual delineation to increase the accuracy.
KEYWORDS: Multispectral High Resolution Satellite Images, Image Enhancement, Normalized Difference
Vegetation Index (NDVI), Marker controlled watershed segmentation
I. INTRODUCTION
Trees are an essential segment on the earth due to enrich in their natural climate, moderating ground temperatures and upgrading their conditions. It is an essential part in providing oxygen and provides a habitat for many species of animals and plants.
The purpose of extraction of trees are used to find the land covered by forests, to know the available different variety of species, to balance environmental conditions, calculation of carbon dioxide (co2). The field investigation on wide area is almost impossible. It is costly, time- consuming and laborious. Automated or Semi- automated methods are employed to extract the trees easily. For the delineation of vegetation regions with image processing multispectral high resolution satellite images and aerial photographs are used.
Various image processing techniques are developing to detect the individual tree areas. Pre-processing techniques such as image enchantment, segmentation are used for smoothing, filtering, noise removal.
Detection and Delineation of tress areas are done by various methods like Normalized Difference Vegetation Index (NDVI) [1], Marker controlled watershed segmentation [3], Radius Distribution Method (RDI), Active Counter algorithm, Circle Unification Method [4] and Watershed Segmentation [6].
II. METHODS FOR DELINEATION OF VEGETATION
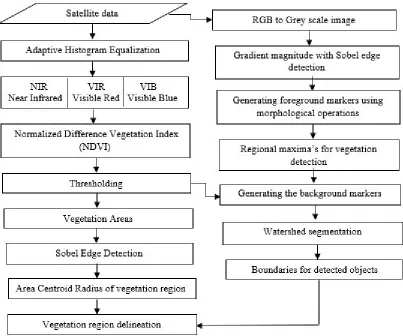
A schematic methodology for automatic delineation of vegetation area is given in the algorithms in Figure 1
Spectral indices
Spectral indices is like orthogonal transformation that combines the different bands. It extracts different natural sources like vegetation, water, soil etc.
Normalized Difference Vegetation Index (NDVI):
Normalized Difference Vegetation Index (NDVI) is one of the process of the spectral indices. NDVI is simply known as the indicator of vegetation structure. It estimate only the greenery part by absorbing the different wavelengths from the sunlight. It consider the parameters of vegetation like photosynthesis, ground water, area.
Mathematical form of NDVI is
NDVI= (NIR- VIR)/ (NIR+VIR)
Where NIR is Near Infra-Red band
VIR is Visible Red band
It subtracts the Red band value from the Near Infra-Red band value and divides it by the sum of Near Infra-Red and Red bands. Greenery part absorbs the red band and reflects Near Infra-Red band while less greenery part absorbs the Near Infra-Red band and reflects the Red band. NDVI value ranges from +1 to -1. Zero means no vegetation and +1 (0.8 to 0.9) more vegetation.
Vegetation detection:
The satellite data is a mixture of different elements like buildings, roads, trees etc. Our aim is to detect the vegetation region. Adaptive histogram equalization technique is applied to the satellite image for image enchantment while suppressing the noise. Adaptive histogram enhances the edges of the objects and increases the contrast level.
Now the data is converted into single format. Near Infra-Red band (NIR), Red band (VIR) and Blue band (VIB) are extracted from the single formatted image. NDVI is calculated using the NIR and VIR bands. Once the vegetation is identified a local threshold value is set to separate only the tree areas from other objects.
Vegetation region delineation:
After detecting the vegetation area from the satellite data the further step is to delineate those vegetation areas like finding edges, filtering, sharpening, smoothing etc.
Edge detection:
Edge detection is one of the technique that locate the edges of an image. Although it point out the sharp change in brightness of the image without any discontinuity.
Sobel operator:
The Sobel operator is an edge detection that calculates the gradient magnitude of the image and its directions. Consider horizontal and vertical edges at two directions x and y. The gradient magnitude is
‖G‖= +
Where Gx and Gy are the gradient components
=arc tan (Gx/Gy)
Where is the gradient direction
After applying the edge detection the Morphological dilation is applied to thicker the edges. The measurement properties like centroid, area, radius and boundaries are measured. Now the delineated image is overlapped on the original image to get the vegetation area exactly.
Marker Controlled Watershed Segmentation
Watershed segmentation:
Watershed segmentation is an image segmentation method. It gives the perfect results for segmented image. It forms the boundaries between the closed objects with satisfying the catchment basin condition called watershed lines. It is for both counter detection and region- based detection. The main disadvantage with watershed segmentation is the over segmentation. Over segmentation occurs due to noise and unwanted segmented region. Marker controlled watershed segmentation is the mathematical morphological tool to reduce the over segmentation.
Morphological operations:
Marker controlled watershed segmentation depends on the morphological operations. It is one of the image processing technique that undergoes dilation, erosion, opening and closing for both binary and grey- scale image. It explore the image with particular shape or size called Structuring element.
erosion added/removes the pixels from the boundaries of the objects in the images to reduce the gaps between the objects. Opening and closing is similar to erosion and dilation.
Formation of foreground and background markers:
Grey scale image is edge detected with Sobel operator for removing noise. Gradient magnitude is applied to known the highest and lowest intensity values for the image. Morphological operation using the structuring element forms the foreground markers at regional minima. Using thresholding the background markers are generated.
Vegetation area detection:
Watershed segmentation is applied to the image to forms boundaries between the objects. Now overlap the foreground and background images on each other to exactly fit the objects between the boundaries. Finally the vegetation area is detected.
III. RESULTS
The proposed algorithms are implemented using MATLAB software. The images are taken from the LANDSAT Multispectral High Resolution Satellite Data and required data is snipped using ERDAS Imagine software. The input satellite data for NDVI and Marker controlled watershed segmentation is given in Fig 2. Its Adaptive Histogram Equalization is shown in Fig 3
Normalized Difference Vegetation Index (NDVI):
Fig 2 Satellite data Fig 3 Adaptive histogram Fig 4 NDVI Equalization
Marker controlled watershed segmentation:
Satellite data as input shown in Figure 3.1
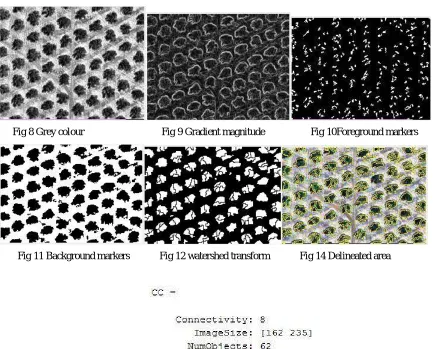
Fig 8 Grey colour Fig 9 Gradient magnitude Fig 10Foreground markers
Fig 11 Background markers Fig 12 watershed transform Fig 14 Delineated area
Fig 14 Vegetation region count
IV. COMPARISON OF DELINEATION METHODS
The final count of NDVI and Marker controlled watershed segmentation is represented in the below table. The manual inexact count of the vegetation area for the given satellite data is 65.
Method name Vegetation area count
NDVI 63
Marker controlled watershed
segmentation
62
V. CONCLUSION
The results obtained after delineation the both methods have approximate count of trees compared with manual count. NDVI has better vegetation area detection but delineation and boundaries are obtained with high accuracy in Marker controlled watershed segmentation. Pre- processing techniques used in this both methods removes noise, increase the image contrast level for good visualization. Morphological operations are used to thicker the edges and to obtain exact boundaries. All the measuring properties are obtained.
REFERENCES
1. Ryotaro KOMURA, Ken- ichiro MURAMOTO, Classification of forest stand considering shapes and sizes of tree crown calculated from high spatial resolution satellite image, 1-4244-1212 -9/07, 2007 IEEE.
2. Wang, L., P. Gong, and G.S. Biging, 2004. Individual tree-crown delineation and treetop detection in high-spatial resolution aerial imagery, Photogrammetric Engineering and Remote Sensing, 70(3): 351-357.
3. Duang Deng, Zengyuan Li, the study of improved Marker controlled watershed crown segmentation algorithm, Seventh International Conference on Computational Intelligence and Security 2011.
4. R. Komura, M. Kubo, K. Muramoto, Represent of tree crown by several circles using aerial image, Proc. IEEE Int. Conf. Geosci. Remote Sensing, pp.3411-3413, 2002.
5. Li P, Xiao X, Multispectral image segmentation by a multichannel watershed-based approach. International Journal of Remote Sensing. 2007; 28(19):4429–52.
6. Fumitaka Kanda, Mamoru Kubo, KenichiroMuramoto, watershed segmentation and classification of tree species using high resolution forest imagery. 0-7803-8742-2/04,
2004 IEEE.
7. Le Wang, Peng Gong, Gregory S. Biging, individual tree crown delineation and tree top detection in high spatial resolution aerial imagery, Photogrammetric Engineering & Remote Sensing Vol. 70, No. 3, March 2004, pp. 351–357.
8. K. G. Karantzalos, D. P. Argialas, towards automatic olive tree extraction from satellite imagery, Geo-Imagery Bridging Continents. XXth ISPRS Congress, 12-23.
9. Christopher mei, Sylvie Durrieu, tree crown delineation from digital elevation models and high resolution imagery, international archives of photogrammetry, remote sensing and spatial information sciences, vol. XXXVI- 8/W2.
10. Jain Yang, Yuhong He and John Caspersen, a multi-band watershed segmentation method for individual tree crown delineation from high resolution multispectral aerial image, IGARSS 2014 978-1-4799-5775-0/14, 2014 IEEE