BASANTA PANDEY
LTE-3G INTER-OPERABILITY STUDY
Master of Science ThesisTopic approved by: Faculty Council of Electrical Engineering on
6th February 2013. Examiners: Professor, Dr. Tech. Mikko Valkama Dr. Tech. Jarno Niemelä
ABSTRACT
TAMPERE UNIVERSITY OF TECHNOLOGY Master's Degree Programme in Electrical Engineering
PANDEY, BASANTA: LTE-3G INTER-OPERABILITY STUDY Master of Science Thesis, 95 pages. 2 Appendix pages
October 2013
Major: Radio Frequency Electronics
Examiner(s): Prof., Dr. Tech. Mikko Valkama Dr. Tech. Jarno Niemelä
Keywords: LTE, 3G, mobility, inter-RAT handover, KPIs
In this thesis the author has studied and measured how LTE Release 8 interworks with previous legacy 3G networks in real environmental conditions. At present, LTE tech-nology is deployed based on service hotspots that cover small geographical areas. It is expected that full scale deployment of LTE network will take a considerable time, which also means the mobile users have to primarily depend on legacy 3G and 2G net-works for years to come. Therefore, it is important to study the interworking mecha-nisms between LTE and legacy networks in order to provide seamless mobility and un-interrupted user services in primarily available LTE hotspots.
In order to perform this study, field measurements have been carried out in DNA com-mercial network in outdoor and indoor environments. Initially, cell selection and rese-lection criteria for inter-RAT mobility in idle condition is mathematically checked and verified. Then, channel conditions are studied and analyzed based on radio parameters like RSRP, RSCP, RSRQ, Ec/No, SNR and CQI when inter-RAT handover is per-formed. After that, an inter-RAT handover test from LTE towards 3G is studied with the help of signalling message. Next, the impact of inter-RAT handover on KPIs like MAC DL throughput, handover success rate, RTT, handover latency and user plane delay are studied and analyzed. Finally, performance of inter-RAT handover in outdoor and in-door measurement environment is compared based on KPI measurements.
From this study, it is found that inter-RAT mobility from LTE towards 3G network is working in both idle and connected modes with 100 percent handover success rate, however, the user experienced network latency around 4 seconds in average. The user experienced degradation in throughput because of decreasing link quality. The user data service interruption is roughly for 3-4 seconds and the RTT value for 32 bytes of data is observed to be around 300 ms in average during handover. It is also found that the im-pact of inter-RAT handover in indoor environment is higher than outdoor environment based on KPIs results.
PREFACE
This Master of Science Thesis has been written for the completion of Master of Science Degree in Electrical Engineering from the Tampere University of Technology, Tampe-re, Finland. The thesis work has been carried out in the Department of Electrical Engi-neering under Radio Network Planning Group during the year 2012 and 2013.
I would like to thank my examiner Professor, Dr. Tech. Mikko Valkama and supervisor Dr. Tech. Jarno Niemelä for supervising and guiding me throughout my thesis work. I would also like to thank Tero Isotalo and Professor Jukka Lempiäinen for their continu-ous guidance and support during thesis. I am extremely grateful to my supervisor Jarno Niemelä for helping me in drive test during the measurement. Without this, completion of thesis would not be possible. Thanks to all my colleagues in Radio Network Group for their friendly behaviour and support during this thesis.
Finally I would like to express my gratitude to my family members for their continuous encouragement throughout my studies.
Tampere, 11th October, 2013 Basanta Pandey
TABLE OF CONTENTS
1. INTRODUCTION ... 1
1.1 Objectives and Limit of the Research ... 1
1.2 Research Methods ... 2
1.3 Thesis Structure ... 2
2. MOBILE COMMUNICATION SYSTEM ... 3
2.1 Cellular Concept ... 3
2.2 Location Management ... 5
2.2.1 Location Area (LA) ... 5
2.2.2 Routing Area (RA) ... 5
2.2.3 Tracking Area (TA) ... 5
2.3 Handovers... 6
2.4 Radio Propagation Environment ... 6
2.5 Radio Channel Properties ... 7
2.5.1 Multipath Propagation and Delay Spread ... 7
2.5.2 Angular Spread ... 8
2.5.3 Fast fading and Slow fading... 8
2.5.4 Propagation Slope ... 9
2.5.5 Characteristics of Radio Propagation Environments ... 10
2.5.6 Propagation Path Loss Models ... 10
2.6 Multiple Access Schemes... 12
3. HISTORY AND LTE OVERVIEW ... 14
3.1 History of Mobile Networks ... 14
3.1.1 Evolution towards 1G ... 14
3.1.2 Evolution towards 2G ... 15
3.1.3 Evolution towards 3G ... 15
3.1.4 Evolution towards 4G ... 16
3.2 Overview of UMTS System ... 16
3.2.1 UMTS Network Architecture ... 17
3.2.2 UMTS Physical, Transport and Logical channels ... 18
3.3 High Speed Downlink Packet Data Access (HSDPA) ... 20
3.4 LTE Evolution and Upgrade Path ... 20
3.5 LTE Network Architecture... 21
3.5.1 User Equipment (UE)... 22
3.5.2 Evolved UMTS Terrestrial Radio Access Network (E-UTRAN) . 22 3.5.3 Evolved Packet Core (EPC) ... 23
4. LTE RADIO INTERFACE ... 25
4.1 Air Interface Technologies for LTE ... 25
4.1.1 OFDMA for Downlink Transmission ... 25
4.1.3 Multiple Antenna Technology ... 28
4.2 LTE Framing Structure ... 29
4.3 LTE Interface and Protocols ... 30
4.4 LTE Physical, Transport and Logical Channels... 32
4.4.1 Physical channels and signals ... 33
4.4.2 Transport Channels ... 34 4.4.3 Logical Channels... 35 4.5 Scheduling ... 36 4.6 Link Adaptation... 36 4.7 HARQ... 36 4.8 Power Control ... 37 4.9 RRM Functions ... 37 5. MOBILITY IN LTE ... 39
5.1 EPS Mobility and Connection Management ... 39
5.1.1 EPS Connection Management (ECM) ... 39
5.1.2 EPS Mobility Management (EMM) ... 40
5.2 Mobility Management in Idle Mode ... 40
5.2.1 Public Land Mobile Network (PLMN) selection ... 40
5.2.2 Cell Selection ... 41
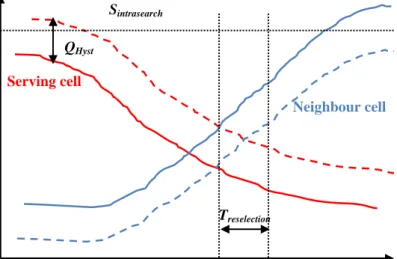
5.2.3 Cell Re-selection ... 42
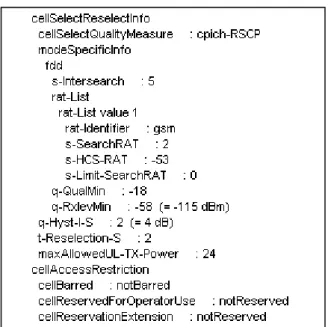
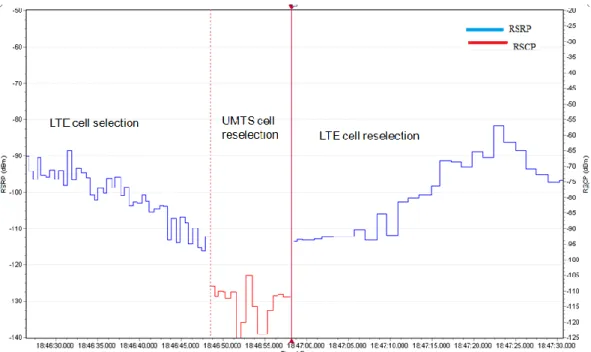
5.2.4 Example of inter-RAT cell selection and reselection ... 44
5.3 System Information ... 46
5.3.1 System Information Block 1 (SIB1) ... 47
5.3.2 System Information Block 3 (SIB3) ... 47
5.4 Mobility Management in Connected Mode ... 48
5.5 Hard Handover in LTE ... 48
5.5.1 X2 based Handover ... 48
5.5.2 S1 based Handover... 49
5.6 Inter Radio Access Technology Handovers ... 50
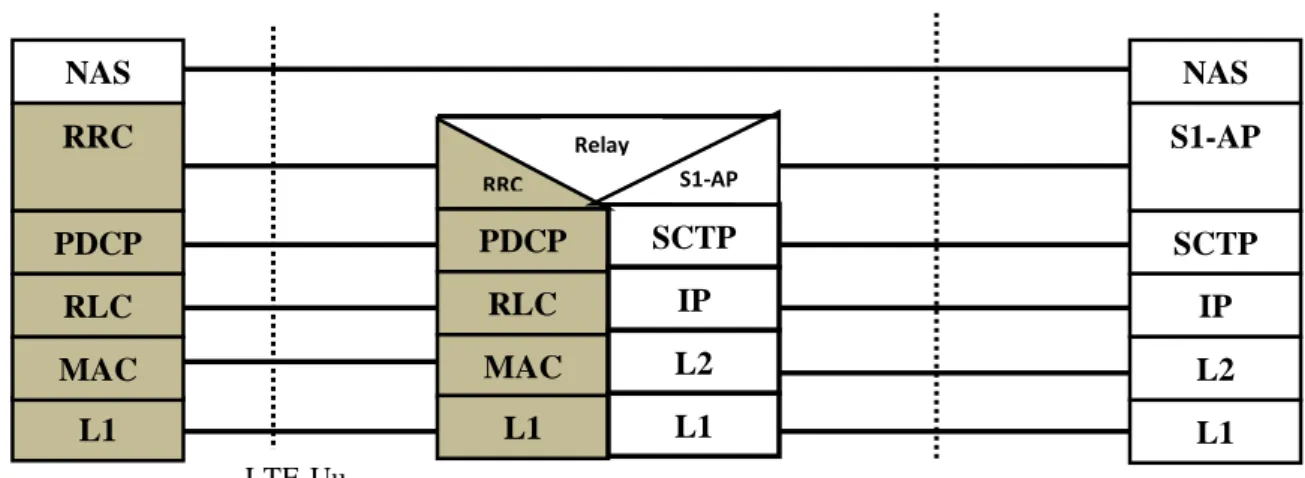
5.6.1 Handover from EUTRAN to UTRAN ... 50
5.6.2 Handover from UTRAN to EUTRAN ... 54
5.7 Measurement Events and Triggering ... 57
5.8 VoLTE and SR-VCC ... 64
6. MEASUREMENT AND RESULTS ... 66
6.1 Performance Parameters ... 66
6.1.1 UMTS User Equipment Measurements ... 66
6.1.2 LTE User Equipment Measurements ... 67
6.1.3 Downlink Throughput ... 67
6.1.4 Link Adaptation ... 68
6.1.5 Handover Success Rate ... 69
6.1.6 Control Plane Latency ... 70
6.2 Measurement and Post-processing Tools ... 72 6.3 Measurement Campaigns ... 73 6.4 Measurement Setup ... 74 6.4.1 Outdoor Scenario ... 74 6.4.2 Indoor Scenario ... 75 6.5 Measurement Results ... 75
6.5.1 Connected Mode Mobility ... 76
6.5.2 Channel Condition Comparison ... 77
6.5.3 MAC DL Throughput ... 81
6.5.4 Handover Success Rate ... 84
6.5.5 Control Plane Latency ... 85
6.5.6 User Plane Latency ... 86
7. CONCLUSIONS AND DISCUSSION ... 90
REFERENCES ... 92
LIST OF ABBREVIATIONS
1G First Generation
2G Second Generations
3G Third Generations
3GPP Third Generation Partnership Project
4G Fourth Generations
AM Acknowledge Mode
AF Application Function
AMPS Advanced Mobile Phone System
APN Access Point Name
AuC Authentication Centre
ATM Asynchronous Transfer Mode
AT&T American Telephone & Telegraph
BCH Broadcast Channel
BCCH Broadcast Control Channel
BSS Base Station Subsystem
CA Carrier Aggregation
CDF Cumulative Distribution Function
CN Core Network
CP Control Plane
CP Cyclic Prefix
CPICH Common Pilot Channel
CQI Channel Quality Indicator
DCCH Dedicated Control Channel
DFT Discrete Fourier Transform
DHCP Dynamic Host Control Protocol
DL Downlink
DLSCH Downlink Shared Channel
DSP Digital Signal Processing
DTCH Dedicated
EDGE Enhanced Data rates for GSM Evolution
EIR Equipment Identity Register
EMM EPS Mobility Management
eNodeB Evolved NodeB
EPC Evolved packet Core
EPS Evolved Packet System
EUTRAN Evolved UTRAN
FACH Forward Access Channel
GGSN Gateway GPRS Support Node
GI Guard Interval
GPRS General Packet Radio Service
GSM Global System for Mobile Communications
GTP GPRS Tunnelling Protocol
HLR Home Location Register
HO Handover
HSDPA High Speed Downlink Packet Access
HS-DSCH High Speed Downlink Shared Channel
HSPA High Speed Packet Access
HSS Home Subscription Server
HSUPA High Speed Uplink Packet Access
HTTP Hypertext Transfer Protocol
iDEN integrated Digital Enhanced Network
IETF Internet Engineering Task Force
IFFT Inverse Fast Fourier Transform
IMEI International Mobile Equipment Identity IMSI International Mobile Subscriber Identity
IP Internet Protocol
IS Interim-Standard
ISDN Integrated Services Digital Network
ISI Inter Symbol Interference
J-TACS Japanese Total Access Communication System
KPI Key Performance Indicator
LTE Long Term Evolution
MAC Medium Access Control
MCH Multicast Channel
MCCH Multicast Control Channel
MIB Master Information Block
MIMO Multiple Input Multiple Output
MISO Multiple Input Single Output
MME Mobility Management Entity
MMS Multimedia Message Service
MSISDN Mobile Station Integrated Service Digital Network
MTCH Multicast Traffic Channel
NAS Non-Access-Stratum
NMT Nordic Mobile Telephone System
NSS Network Switching Subsystem
NTT Nippon Telephone and Telephone Company
O&M Operation & Maintenance
OFDMA Orthogonal Frequency Division Multiple Access
PAPR Peak to Average Power Ratio
PBCH Physical Broadcast Channel
PCC Policy and Charging Control
PCH Physical Control Channel
PCCH Paging Control Channel
PCFICH Physical Control Indicator Channel
PCI Physical Cell Identity
PCRF Policy and Charging Resource Function
PDCCH Physical Data Convergence Protocol
PDCP Packet Data Convergence Protocol
PDC Personal Digital Cellular Technology
PDCCH Physical Downlink Control Channel
PDSCH Physical Downlink Shared Channel
PGW Packet Data Network Gateway
PHY Physical Layer
PHICH Physical Hybrid ARQ Indicator Channel
PLMN Public Land Mobile Network
PMI Precoding Matrix Indicator
PRACH Physical Random Access Channel
PRB Physical Resource Block
PSTN Public Switched Telephone Network
PUCCH Physical Uplink Control Channel
PUSCH Physical Uplink Shared Channel
QAM Quadrature Amplitude Modulation
QoS Quality of Service
QPSK Quadrature Phase Shift Keying
RACH Random Access Channel
RAT Radio Access Technology
RLC Radio Link Control
RNC Radio Network Controller
RRC Radio Resource Connection
RRM Radio Resource Management
RSCP Received Signal Code Power
RSRP Reference Signal Received Power
RSRQ Received Signal Received Quality
RTT Round Trip Time
SC-FDMA Single Carrier Frequency Division Multiple Access
SCTP Stream Control Transfer Protocol
SFBC Space Frequency Block Code
SGSN Serving GPRS Support Node
SGW Serving Gateway
SIMO Single Input Multiple Output
SMS Short Message Service
SMPT Simple Mail Transfer Protocol
SNR Signal to Noise Ratio
SR-VCC Single Radio Voice Call Continuity
TA Tracking Area
TACS Total Access Communication System
TAI Tracking Area Identity
TAL Tracking Area List
TAU Tracking Area Update
TDMA Time Division Multiple Access
TM Transparent Mode
TTI Transmission Time Interval
TTY Tampereen Teknillien Yliopisto
UE User Equipment
UM Unacknowledged Mode
UMTS Universal Mobile Telecommunication System
UP User Plane
USIM Universal Subscriber Identity Module
USCH Uplink Shared Channel
UTRAN Universal Terrestrial Radio Access Network
WCDMA Wideband Code Division Multiple Access
VAS Value Added Service
VLR Visitor Location Register
VMS Voice Message Service
VOLTE Voice over LTE
LIST OF SYMBOLS
Srxlev Cell selection received signal level
Ec/No Energy per chip divided by power density of the band
Qrxlevmeas Measured RSRP value
Qrxlevmin Required minimum RSRP value
Qrxlevminoffset Offset to signalled Qrxlevmin
Pcompensation Power compensation
Sservingcell Serving cell measured value
Sintrasearch Intra-frequency cell selection search threshold
Snonintrasearch Inter-frequency cell selection search threshold
Qmeas,s Serving cell measured value
Qmeas,n Neighbouring cell measured value
Qhys Hysteresis value
Qoffset Offset value
Treselection Time to trigger
PEMAX maximum allowed uplink transmit power within a cell
PUMAX maximum transmit power capability of the UE
Rn Rank of the neighbour cell
1.
INTRODUCTION
Technology with low cost and offering high quality of service are always on user's choice. Several efficient technologies are developed and implemented by the mobile operators to satisfy mobile users. In order to meet the expectation of high mobile data rate, quality of service, faster communication and facilitating multimedia service; High Speed Packet Access (HSPA) technology based on the Universal Mobile Telecommuni-cation System (UMTS) called 3G networks is introduced and deployed. This technology has made drastic change in raising the numbers of mobile data service users day by day at exponential rate. As this growth continuous in future, the 3G network might not be enough to hold the network load. Therefore, a new technology providing even more capacity and high data rates than 3G network is developed by 3rd Generation Partner-ship Project (3GPP) called Long Term Evolution (LTE) to fulfil the requirement. LTE is a 4th generation (4G) wireless network based on packet switched technique with flat architecture. This architecture is able to provide high data rates, lower latencies, high spectral efficiency and compatible with previous 3GPP networks like UMTS and Global System for Mobile Communication (GSM) as well as non-3GPP networks. Users always expect uninterrupted, efficient and stable service from mobile network while moving from one place to another. Mobility supports user to move from one place to another without breakdown of ongoing service within coverage area. Mobility of a user is controlled by the handovers algorithms. These algorithms are developed to en-sure the consistent performance of the cellular network to offer seamless mobility such that user quality of service is always maintained.
1.1
Objectives and Limit of the Research
The goal of this thesis is to study and perform the test measurements regarding LTE interworking with previous legacy 3G networks. Measurement should be done in realis-tic radio conditions and test the actual mobility to see the impact on different KPIs for commercial network operators like DNA and Elisa in Finland.
The main outcome of this thesis is the analysis of inter-RAT mobility testing in DNA network from LTE to 3G network in Tampere University of Technology (TUT) campus region in indoor and outdoor measurement environments. The analysed results in this thesis are for the connected mode inter-RAT mobility with a data connection experi-enced by a single user.
The main limitation is the mobility from 3G towards LTE in this thesis. This is because of wide coverage of 3G networks including LTE hotspot areas. But theoretical explana-tion of inter-RAT handover from 3G to LTE process is given in detail. One major diffi-culty during this thesis research is finding the LTE to 3G inter-RAT handover spots during mobility.
1.2
Research Methods
This thesis starts from the literature study from different books, technical papers, con-ference papers, journal documents and different websites. In the beginning the neces-sary background theory is provided in simplest manner to help the reader to understand the basic concept, terms and the theories used while analyzing the measured results. The relevant documents used are enlisted under reference headings. Before starting actual measurement, two other measurements were performed: one on intra-cell mobility in LTE within Nokia Test Network in Tampere University of Technology (TUT) premises and other inter-Frequency mobility in LTE between indoor test network of TUT and test network of Nokia in Hermia region. These are done for background information and understand the basic concept of handover signalling message flow between the network elements. After that inter-RAT mobility measurement is conducted in two locations: outdoor and indoor. Both measurements are done in Tampere University of Technology (TUT) campus area. Nemo Outdoor is used to monitor and record the measurement while Nemo Analyzer is used for analyzing the data. The data is extracted and filtered with the help of MS-Excel and the required data is plotted in the Matlab for results. Fi-nally analysis and conclusion is made based on these results.
1.3
Thesis Structure
The entire thesis is divided into seven chapters. Chapter 1 introduces the topic, goals and limitation and the research methodology used in this thesis. Chapter 2 explains the cellular concept, location management schemes used in mobile communication and dif-ferent types of radio propagation environments. It also deals with the properties of radio channel and different types of channel accessing schemes used in mobile technology. Chapter 3 gives a brief discussion on LTE. It also explains history about the mobile network and evolution path towards LTE. It also gives a detail description on network elements associated with UMTS and LTE network architecture. Chapter 4 focuses on the air interface technology used in LTE. The framing concept, interface and protocols and the different channels used are discussed under same chapter. It explains about the Medium Access Control (MAC) layer and physical layer functions as well. Chapter 5 is the core chapters of literature for this thesis to understand the analysis and results. Chapter 5 begins with a short introduction on system information message and the measurement events in LTE. After that, it gives a detail description on the mobility management within LTE and with previous legacy 3G networks in both idle and con-nected mode with examples. At last this chapter ends by giving a short introduction on Voice over LTE (VoLTE) and Single Radio Voice Call Continuity (SR-VCC). Chapter 6 begins with the discussion on different key performance indicators used to evaluate the network performance and gives detail information about the measurement and ana-lyzing tools. This chapter ends with measurement results and discussions. Finally Chap-ter 7 concludes the overall thesis.
2.
MOBILE COMMUNICATION SYSTEM
Communication system helps to exchange the information between a sender and a re-ceiver. The communication process becomes effective only when a receiver understand the exact information sent by a sender. A sender and a receiver are always connected with each other by means of communication medium. These communication medium may be guided lines or wireless. In guided lines, the information is guided along a phys-ical path directly connected between a sender and a receiver. Twisted pair cable, coaxial cable and optical fibers are some examples of guided lines. In wireless, the information propagates in the form of electromagnetic waves through air. Microwaves and radio waves are examples of wireless media. Mobile communication, a wireless technology allows a sender or a receiver to communicate with each other anytime, anywhere and anyone.
This chapter starts with the introduction on cellular concept. It contains the detail de-scription about different radio propagation environment and its channel properties. It also explains about the different access technologies used in wireless communication. A short concept behind the spread spectrum technology is explained at the end of this chapter.
2.1
Cellular Concept
The idea of the cellular concept was proposed by Bell Labs (AT&T) in 1947. The main aim behind the development of this concept was to use the available spectrum in effi-cient manner using low power transmitters and to provide full coverage with high ca-pacity and to ensure full mobility within coverage area with uninterrupted service. In this concept, a large geometrical area is divided into smaller areas called cells and these cells are grouped together to form a cluster. These sub divided areas utilized fre-quency reuse mechanism. In this mechanism, the radio frefre-quency or radio channel used by a cell can be utilized by another cell after a certain physical distance called reuse distance. It means the radio channels cannot be used in adjacent neighbouring cells. This is done to avoid co-channel interference. This frequent use of radio resources in-creases the capacity. The reuse distance, D is calculated by: [1]
3
DR N (2.1) where R is the radius of the cell and N is the number of cells per cluster. The valid cluster size can be constructed if:
2 2
*
N i i j j (2.2) where i and j are non negative integers and is given as: i0 and ji.
The shape of the cells can be square, circular, and hexagonal or some other irregular shapes. The shape is chosen in such a way that it should be geometrical, cover the areas without overlap or leave no gaps and has the largest area. The hexagonal shape is the best that satisfies all these conditions. So, it is universally adopted. Figure 2.1 is an ex-ample of hexagonal cellular concept with frequency reuse factor 3. Here a geometrical area is subdivided into small cells. Each cell is separated by different colours using three different frequency f1, f2 and f3 after certain reuse distance.
Figure 2.1: Hexagonal cell with frequency reuse factor 3
The different types of cell size are deployed depending upon the coverage and capacity.
Macro cells: These types of cells are deployed to cover remote and sparsely
populated areas. They cover around 10km or even more.
Micro cells: They cover around 1km in diameter and mostly deployed in densely
populated areas.
Pico cells: They are deployed to cover very small areas like buildings and
offic-es or to such typoffic-es of place where the coverage from the large cell is not possi-ble.
As the height of the base station decreases, the size of the cell becomes smaller. Smaller cell radius requires smaller transmit powers. This helps to reduce the mobile battery consumption. More number of base stations can be added to increase radio capacity from fixed radio spectrum to serve more users. The cellular concept has some draw-backs. To increase the capacity, more number of base stations is required. This increases the cost. It should also support seamless handoff between the cells as radio channel condition varies throughout the network. Management of the resource is required and need to track the user location to route incoming call/message.
Those channels assigned to a cell are classified as downlink channels and uplink chan-nels. Downlink channels are used to carry traffic from the base station to mobile stations whereas uplink channels are used to carry traffic from mobile stations to the base sta-tion. These channels are further divided into control channels and traffic channels. Con-trol channels carry conCon-trol information while the traffic channels carry user voice or data information. A mobile station communicates another mobile station via base sta-tion. At first, the network needs to know the location of the target mobile station in a cell before starting communication.
f1 f1 f1 f2 f2 f2 f3 f3 f3
2.2
Location Management
In cellular network Location Management (LM) tracks the location of an active mobile station. A mobile is said to be active if it is powered on. The LM involves two opera-tions: location update and paging.
Paging: Paging is always performed by cellular network. The cellular network
will page in all possible cells to find out the cell in which the active mobile sta-tion is located.
Location update: This operation is always performed by the active mobile
sta-tion. This is done either by globally or locally. A global location update scheme allows all mobile stations to update their locations at the same set of cells whereas local location update allows each mobile user to decide when and where to perform location update.
2.2.1 Location Area (LA)
This is an approach for location management used in first generation and second gen-eration system like Global System for Mobile Communication (GSM). A serving area is subdivided into location areas and each location area consists of several adjacent cells. The base station of each cell broadcast the identification of the location area which is called Location Area Identity (LAI) to which the cell belongs. A mobile station updates its location area and informs the cellular network by sending Location Area Update (LAU) code whenever it enters into a cell which belongs to a new location area.
2.2.2 Routing Area (RA)
This approach is used for location management in second generation and third genera-tion system like Universal Mobile Telecommunicagenera-tion System (UMTS). The routing area is sub-area of a location area with specific means for PS services. Each user in-forms Serving GPRS Support Node (SGSN) about RA to which the user resides. Each RA has its own Routing Area Identity (RAI) and is updated when a mobile station's routing area is changed. This RAI consists of Location Area Code (LAC) and RAC message.
2.2.3 Tracking Area (TA)
This location management approach is used for Evolved Universal Terrestrial Radio Access Network (E-UTRAN) cells. They are used to track the mobile stations which are in standby mode. Adjacent EUTRAN cells are grouped together to form tracking area. These grouped cells have same Tracking Area Identity (TAI). TAI may vary when the mobile station moves from one cell to another cell. The mobile station reports TAI up-dates by sending Tracking Area Update (TAU) message. The number of cells to be paged to find the location of the cell depends on tracking area. Signalling overhead may
rise if frequent TAU happens. Therefore a concept of Tracking Area List (TAL) is in-troduced. In this concept, each cell belongs to only one TA but a mobile station can be registered to many TAs at the same time. These TAL is formed by the collection of TAs to which a single UE is registered.
2.3
Handovers
Handover maintains a connection between the network and the Mobile Station (MS) when MS moves from one cell to another. As the mobile station moves towards the cell edge the signal strength starts to deteriorate. Therefore the MS has to find the new cell and camped into it before ongoing services session gets disturbed. Therefore handover process helps to find a suitable cell for UE to maintain quality of service. Generally, handover may be hard, soft and softer. Hard handover is the 'break-before-make' hando-ver. In this type, the channel of the source cell is released before connecting to the channel of the target cell. Soft handover is the 'make-before-break' handover in which the channel of the source cell is released only after connecting to the target cell. Softer handover is a type of soft handover the radio channels that are connected and released belong to the same site.
The handover process comprises three steps. The first step is the handover initiation. Either MS or network initiates the handover once needed. The second stage is the new connection establishment by finding the available resources for handover process and routing operations. Last stage is the successful data flow from the new established con-nectivity. Handover may be intra-cell, inter-cell and inter-RAT cell. Intra cell occurs when the MS moves within a serving area of the same network. Inter cell handover oc-curs when the UE moves into adjacent cell within a network and inter-RAT handovers occurs when the MS moves from one technology to another. Refer Chapter 5 for detail.
2.4
Radio Propagation Environment
The transmitted radio waves from transmitter and receiver depend upon the environ-ment on which it propagates. The propagation paths between them vary the performance of the communication system. Therefore the coverage and the capacity of any cellular systems rely on the behaviour of different environment. The classification of the envi-ronment is done to make the network planning process easier. Figure 2.2 is the classifi-cation of the environment in terms of: [2]
Mobile location: The mobile terminal outside the buildings environment is
termed as outdoor whereas mobile located inside is termed as indoor.
Antenna location: Depending upon the location of antenna, the environment is
classified as macro, micro and pico. In macro-cellular, the location of the anten-na is above the average height of the buildings whereas in micro-cellular the an-tenna is below the rooftop level. In pico-cellular the anan-tennas are completely lo-cated inside the buildings.
Morphography type: The environment is classified into urban, suburban and ru-ral depending upon the population density and naturu-ral obstacles present in the surroundings. Urban areas are characterized by the high population densities like cities or towns. Suburban area may be a part of city with low population density compared to urban type. Rural areas are village areas located outside the cities and have least population density.
Figure 2.2: Classification of radio propagation environments
2.5
Radio Channel Properties
This section describes the parameters that characterized the propagation environment. 2.5.1 Multipath Propagation and Delay Spread
In mobile communication, the signal propagation path between the mobile station and base station is affected by the objects/obstructions present in between them. These ob-stacles cause the transmitted signal to reflect, diffract and scatter. Reflection is caused by the wall of the buildings and earth surface. Sharp edge of walls, mountains and roof-tops cause diffraction of the signal and trees are the source of scattering the signal. Due to these obstacles the received signal consists of several replicas of the originally trans-mitted signal. These replicas have different amplitudes, phase, polarisation and angle of arrival. This phenomenon of transmitted signal arriving from different path at the re-ceiver is called multipath propagation.
The multipath propagation caused the signal to arrive at different time instants. The variation of this timing instant is measured by delay spread. The delay spread Sis cal-culated from power delay profile (PDP)P
. [2]Micro celluar Urban Suburban Rural Propagation Environment Indoor Outdoor Macro cellular Pico cellular
2
0 * * total P d S P
(2.3) where power delay profile is power of the received signal received at different time in-terval through multipath.
is the average delay and P totalis the total received power.
Different propagation environment has different delay spread. The macro cellular envi-ronment has high delay spread than in micro cellular and indoor envienvi-ronment due to high arrival time of multipath component.
Frequency separation of the multipath components is given by the coherence bandwidth
c f
which depends upon the delay spread. Coherence bandwidth is range of frequencies over which a channel is considered flat. The relation between the coherence bandwidth and delay spread is given by,
1 2 c f s (2.4) where sis the delay spread. [2]
2.5.2 Angular Spread
The variation of the signal incident angle of the received power due to multipath is giv-en by angular spread (S). It can be calculated either in horizontal or vertical planes using formula,
2
180 180 total P S d P
(2.5) where
is the incident angle,
is the mean angle, P
is the angular power distri-bution and Ptotal is the total power. The angular spread from the horizontal planes ismostly concerned. This is due to large amount of propagation paths between the mobile station and base station. The horizontal angular spread is high in indoor and micro cellu-lar environment than in macro cellucellu-lar environment. In indoor environment, it has 360 degrees of variation; in micro environment it has 45 degrees deviation value and in mac-ro cellular envimac-ronment, it has 5-10 degrees variation. [2]
2.5.3 Fast fading and Slow fading
Different replicas of the transmitted signal arrive at the receiver due to reflection and diffraction. These replicated signals vary in amplitude and phase than original one. At the receiver side, the total received signal is achieved by the superposition/combination of these replicated signals. The received signal can be constructive if the phase is same otherwise it is destructive.
As the mobile station moves, the amplitude and phase change of the replicated signals change very quickly as a result the total received signal also change very fast. This phe-nomenon of rapid fluctuation of amplitude and phase is fast fading. Fast fading is shown in Figure 2.3 with solid lines.
Figure 2.3: Slow fading and fast fading [2]
The distribution of fast fading varies according to the LOS (Line-of-Sight) and NLOS (Non-Line-of-Sight) environment between transmitter and receiver. In NLOS, there exists no single dominating path. This results in random uniformly distributed phase of all multipath components and the amplitude of received signal is Rayleigh distributed. The fading in NLOS condition is Rayleigh fading. In LOS condition, the amplitude of direct signal always has higher amplitude than the others. When a direct path exists, the total signal amplitude is Rician distributed and the fading caused by LOS is Rician fad-ing.
Slow fading is a slow variation of the received signal level. It is defined as the variation of the local mean value of the fast fading over a wide area. It is due to shadow effect caused large buildings, hills and trees between the transmitter and receiver. These ob-stacles blocks the main direct path as a result the propagation takes place only from re-flection and diffraction. Therefore the change in received signal power can be modelled using log-normal distribution. A dash line in Figure 2.3 shows the slow variation of re-ceived signal amplitude over a wide area. [2]
2.5.4 Propagation Slope
Propagation slope is the attenuation of the radio wave with respect to the distance in dB/decade. The propagation slope is defined by the propagation exponent denoted by . The propagation exponent differs with the environment. In free space, 2, which cor-responds to 20dB/decade propagation slope. The propagation slope plays an important role in the estimation of path loss denoted by Land can be calculated by the equation,
10 0 L L d (2.6) Distance Slow fading Fast fading A m pl it ud e
where L0 is the path loss at the reference point, d is the distance between the transmit-ter and receiver and is the propagation exponent.
The variation of radio condition between the base station and mobile station varies the propagation slope all the time. The distance where the propagation slope change is breakpoint distance, B which is calculated by using the equation [2]
4hBTS MSh
B (2.7) where hBTS is the height of the base station antenna, hMS is the height of the mobile
sta-tion antenna and is the wavelength of the received signal.
2.5.5 Characteristics of Radio Propagation Environments
The characteristics of radio propagation environments for Global System for Mobile Communication (GSM) 900 MHz system are summarised in Table 2.1
Table 2.1: Radio channel characteristics for different environment at 900MHz [2] Environment type Angular spread(degree) RMS Delay spread (µs)
Fast fading Slow fad-ing standard deviation (dB) Propagation slope (dB/dec) Macrocellular Urban 5-10 0.5 NLOS 7-8 40 Suburban 5-10 NLOS 7-8 30 Rural 5 0.1 (N)LOS 7-8 25
Hilly rural 3 (N)LOS 7-8 25
Microcellular 40-90 <0.01 (N)LOS 6-10 20
Indoor 90-360 <0.1 (N)LOS 3-6 20
These radio channel characteristics parameters for different environment are taken into account in the radio planning. In microcellular and indoor environment, Line of Sight (LOS) and Non Line of Sight (NLOS) are responsible for fast fading. The propagation slope is lower in indoor environment while macrocellular has the highest value of 40 dB/decade. The angular spread is higher whereas delay spread is lower in macrocelluar environment.
2.5.6 Propagation Path Loss Models
Propagation models are used to predict the significant path loss between the base station and mobile station. These models help the mobile network providers to plan and opti-mize their network. Depending upon the propagation environment, path loss models are classified as empirical models, physical models or semi-empirical models, deterministic models and indoor models.
Empirical models are mainly for macrocellular environment based on extensive meas-urement campaigns. They are accurate in environments with same characteristics de-fined by the land use, not by reflections and diffractions. The environment is specified as urban, suburban, rural and open areas. These models are simple and require low computational time but they have accuracy problems. Different environment requires tuning to use empirical model. Okamura-Hata is the most accurate empirical model which is formulated as
10 10 10 10
log 13.82log bs ms 6.55log bs log m
L A B f h a h C h d C (2.8)
where
L Path loss [dB]
A Constant (see Table 2.2)
B Constant (see Table 2.2)
f Frequency [MHz] (150MHz f 2000MHz)
bs
h Height of the base station antenna [m]
30mhbs 200m
msh Height of the mobile station antenna [m]
1mhms10m
C Propagation slope
d Distance between mobile station and base station [km]
1Km d 20Km
mC Area type correction factor
The constant parameters A and B differs with respect to frequency and is given as: Table 2.2: Value of A and B [2]
Parameters Frequency
150-1500MHz 1500-2000MHz
A 69.55 46.3
B 26.16 33.9
Depending upon the size of the city, a h
ms can be formulated as For small and medium city,
ms 1.1log10 0.7
ms
1.56log10
0.8
a h f h f (2.9) For large city,
210
3.2 log 11.75 4.97
ms ms
a h h (2.10) In Equation 2.8 the area correction factor varies typically from -3dB (water) and up to 30dB (buildings).
Physical or semi-empirical models are suitable for macro and micro cells are completely based on geometry of the buildings. They are more accurate than empirical models but
require more precise description of the environment and more computation time. COST-231-Walfisch-Ikegami is the famous semi-empirical model.
Deterministic models are based on analytical estimation of the electromagnetic waves equation or using ray optical methods. They are mainly for microcellular and picocellu-lar environment which produces very accurate results in high computation time. These models rely on accurate 3D building information and material information.
Indoor models are based on the layout of the buildings and building materials. This is because of the propagation due to reflection, refraction and diffraction of the radio waves caused by the walls, windows and doors inside the buildings.
2.6
Multiple Access Schemes
Access techniques allow multiple users to share the limited amount of radio spectrum at the same time. Time Division Multiple Access (TDMA), Frequency Division Multiple Access (FDMA) and Code Division Multiple Access (CDMA) are the three major ac-cessing schemes used in a wireless communication system are shown in Figure 2.4.
Figure 2.4: Multiple access techniques: (a) FDMA, (b) TDMA and (c) CDMA [3] Frequency Channel 4 Frequency Channel 1 Frequency Channel 2 Frequency Channel 3 T i m e S l o t 1 1 1 T i m e S l o t 2 T i m e S l o t 3 T i m e S l o t 4 T i m e S l o t 5 5 Guard Band Guard Band Guard Band Guard Band Gu ar d T im e Gu ar d T im e Gu ar d T im e Gu ar d T im e Gu ar d T im e Frequency Frequency Time Time (a) (b) Time Frequency Code (c)
In TDMA technique, each user is allocated with unique time slot to access a single radio channel. These time slots are separated by the guard slots. Data in this scheme is trans-mitted in the form of burst and hence synchronization is needed. In FDMA technique the available radio spectrum is divided into large number of narrowband channels. Each user is allocated with fixed channels and is retained until it is released. These narrow band channels are separated by guard bands. In this scheme, an unused channel in idle mode and uneven distribution of the traffic lead towards the wastage of the resources. The combination of TDMA and FDMA schemes are used in GSM system. In CDMA technique, the narrowband message signal is multiplied by the spreading signal to pro-duce a wideband signal. These spreading signals are the sequence of pseudorandom code which has a chip rate higher than the data rate of the message signal. Each user is allocated with unique pseudorandom code and they are orthogonal to each other.
3.
HISTORY AND LTE OVERVIEW
This chapter presents a short history on the development of mobile networks and the communication methods used back to ages till present. An introduction on today 3G and 4G networks and their evolution path from the previous legacy networks is also ex-plained in detailed.
3.1
History of Mobile Networks
Going back to the ages, people have their own way to communicate. During those days people used flag as a medium to convey the information. Later on around 150 BC Greek people start to use smoke signals for communication. Then after around 1794 Claude Chappe invented optical telegraph for communication purpose. This is regarded as '' The Mother of all Networks''. This method was limited by the geography and weather condi-tions. After that to overcome the limitation, electromagnetic waves were discovered. In 1857 Clark Maxwell derived a theory on electromagnetic fields and introduced wave equations. Later in 1888 Heinrich Hertz demonstrate the first experiment in Germany on wave characteristics in space. Based on the Maxwell equations Guglielmo Marconi demonstrates on wireless telegraphy based on radio waves in 1901. He used huge transmitter's stations with very high antennas. This system requires high power for transmission. In 1920 Marconi discovered the short waves which overcome the re-quirement of huge transmitters and receivers. During this year the technology was in-stalled in police cars for one way communication. As time passed, radio telephony was used for military purpose during Second World War. In 1940's hand held transmitters were available which were bulky and consumes high power. During 1946 US engineers from Bell lab develop a system which allow user to transmit and receive from automo-biles. Soon after, American Telephone and Telegraph (AT&T) launched Mobile Tele-phone service in urban areas with limited coverage. [4]
3.1.1 Evolution towards 1G
In 1970s the modern cellular network were launched. The system utilizes Analog cir-cuit- switched mainly designed for voice using Frequency Division Multiple Access (FDMA) technology. This was called First Generation (1G) network. These analog sys-tems were developed in different parts of the world using Advanced Mobile Phone Sys-tem (AMPS) in America, Total Access Communication SysSys-tems (TACS) and Nordic Mobile Telephone System (NMT) in Europe and Japanese Total Access
Communica-tion Systems (J-TACS) in Japan. In 1979 Nippon Telephone and Telephone Company (NTT) launched commercially so called 1G network in metropolitan areas of Japan. This analog system worked on 800-900 MHz frequency bands and used frequency modulation to transmit the signals. This system was designed to support more number of users and support user mobility. These analog supporting devices were lighter than previous development. The main drawbacks of this system are the lack of security and short battery life. [5]
In 1980s a packet switched technology called X.25 was deployed for data networks whereas voice networks deployed circuit switched technology. During this stage the networks for voice and data were completely separated.
In the 90s a new circuit based telephony Integrated Service Digital Network (ISDN) was introduced to replace the circuit switched analog technology by the digital lines. This standard helps to transmit voice and the limited data simultaneously. Later, a new technology Asynchronous Transfer Mode (ATM) was introduced to support data, voice and video signals to overcome the limitation of X.25. But due to the expensive of the ATM switches, scientists develop the new technology standard called frame relay. This standard was simple and support voice and data. [6]
3.1.2 Evolution towards 2G
A new modern digital technology called Global System for Mobile (GSM) was intro-duced in Finland in 1991. The other systems were Personal Digital Cellular Technology (PDC), integrated Digital Enhanced Network (iDEN), Interim-standard (IS-95) based on CDMA, IS-136 based on TDMA. They were regarded as the Second Generation (2G) digital cellular network. Among those systems GSM and IS-95 standard were much popular. All the limitations of the 1st generation were overcome by this technology as a result the GSM was spread worldwide. It provides the roaming facilities across the car-riers. Later, a new packet switched technology was launched to transfer data as short messaging service with a speed of 9.6 kbps. The use of this technology gave rise to the use of internet and its protocols. It is designed to operate in 900 MHz and 1800 MHz frequency band in Europe. The devices were much lighter and cheaper due to digital technique implementation. The battery life was improved; encryption technique was implemented for security purpose and more immune to noise. In late 1990s, general packet radio service (GPRS) was introduced to support high data packets to the existing GSM networks supporting speed up to 114 kbps. After that Enhanced Data rates for GSM Evolution (EDGE) come on exists. It uses 8 phase shift keying (8-PSK) modula-tion technique and combines with GPRS to support the data rate of 200kbps. [5] [6]
3.1.3 Evolution towards 3G
During 2000, data services were in high demand. To support this growing, the third generation mobile communication systems were introduced. This 3G technology
ports the high speed internet browsing from the mobile devices. This system also sup-ports the additional features like video streaming, TV streaming, navigation and multi-media support. This technology used packet switching for data transmission. Under In-ternational Telecommunication Union project IMT-2000; a set of 3G standards were developed such as Universal Mobile Telecommunication System (UMTS), CDMA 2000, Digital Enhanced Cordless Telephone (DECT) and EDGE. The 400MHz to 3GHz frequency band was allocated for 3G communication systems. In 2001 NTT DoCoMo launched 3G in Japan based on WCDMA standard. This technology utilizes frequency reuse concept. In late 2001, UMTS technology was launched commercially in Europe. It was based on CDMA concept which offers different data rates providing up to 144 kbps for moving vehicles, up to 384 kbps for pedestrian users and up to 2 Mbps for stationary users. Due to this technique global roaming and internet connection from any location was possible. [5]
In 2002, the SK Telecom from South Korea introduced another 3G technology 1xEV-DO based on CDMA. On the same year the Monet Mobile Network from America launch 1xEV-DO based on CDMA 2000 standards. Later new protocol standards High Speed Downlink Packet Access (HSDPA) and High Speed Uplink Packet Access (HSUPA) were introduced in Release 5 and Release 6 termed in WCDMA evolution to improve the data transmission rate in mobile communication for downlink and uplink. It utilizes different modulation and coding techniques. HSDPA offers data rate up to 14.4 Mbps in downlink whereas HSUPA offers 5.76 Mbps in uplink direction. On further development HSPA+ was introduced in Release 7 to offer higher data traffic up to 84 Mbps in downlink and 22 Mbps uplink direction. [7]
3.1.4 Evolution towards 4G
LTE is the next evolution from 3G in wireless mobile networks to 4G introduced in Release 8. It is IP based technology with flat architecture providing data rate of 100Mbps in downlink and 50Mbps in uplink direction. Low latency, seamless mobility and efficient use of radio resources are the characteristics of LTE. This emerging tech-nique can work with previous 2G and 3G networks. LTE-Advanced is another upgrade evolution from LTE. It is defined in Release 10. It mainly focuses on higher capacity. It supports multiple antenna systems and Carrier Aggregation (CA) concept.
3.2
Overview of UMTS System
The Universal Mobile Telecommunication System (UMTS) is the 3G cellular technolo-gy standardized by the 3GPP in Released 99 for voice and data. It uses WCDMA tech-nique to offer high spectral efficiency and bandwidth. It offers data rate up to 2 Mbps, seamless handover to GSM/GPRS and high quality speech.
3.2.1 UMTS Network Architecture
The UMTS network architecture is classified into three major domains: User Equipment (UE), UMTS Terrestrial Access Network (UTRAN) and Core Network (CN). Figure 3.1 shows the complete view of the UMTS network architecture with associated elements.
3.2.1.1 User Equipment (UE)
It is the user end device which contains UMTS Subscriber Identity Module (USIM) and Mobile Equipment (ME). Both are interconnected with each other by Cu interface. The USIM is a smartcard and it contains the subscriber information, authentication and en-cryption keys. The ME is used to terminate the radio connection with the network.
Figure 3.1: UMTS network architecture [8]
3.2.1.2 UMTS Terrestrial Access Network (UTRAN)
The UTRAN is similar like Base Station Subsystem (BSS) in GSM technology. It com-prises of two elements: NodeB and the Radio Network Controller (RNC). The UTRAN is connected with the UE via Uu interface for communication.
NodeB: It is a base station responsible for handling the user physical data and signal-ling between the UE and RNC. It performs the power control and load control mecha-nism. Channel coding, error handling and modulation and demodulation are other major functions of NodeB.
Radio Network Controller (RNC): It is equivalent to Base Station Controller (BSC) of GSM. It controls and serves the NodeBs. It is mainly responsible for radio resource management and controlling the radio channels. It also takes part in routing and switch-ing the calls to gateway MSC (GMSC). It is interconnect with NodeB via lub interface. Each RNC are interconnected with lur interface.
CN VLR PSTN GMSC Uu MSC lucs Au C lub EIR HLR Node B USIM Cu GR Gn lups ME Node B RNC Node B UE GGSN Gi SGSN Internet UTRAN CN
3.2.1.3 Core Network (CN)
Its performance is similar to the Network Switching Subsystem (NSS) of 2G system. The core network is divided into three different categories according to the data they carried.
Circuit switched elements: It comprise of Mobile Switching Centre (MSC) and
Gateway MSC. The primary function of MSC is to route the voice traffic and data traffic as well as other value added services. It is also responsible for end to end connectivity between the users, handling the user mobility and charging. A database known as Visitor Location Register (VLR) is also included in the MSC. This data base stores the information of active users connected to the network. The Gateway MSC forms a gateway to connect UMTS core network with exter-nal circuit switch network like PSTN.
Packet switched elements: The key elements are Serving GPRS Support Node
(SGSN) and Gateway GPRS Support Node (GGSN). The SGSN is responsible for carrying and delivering the data packets from one user to another user. It also takes part in mobility management, logical management and authentication and billing. The GGSN forms the gateway to connect the GPRS network with exter-nal packet switched networks like internet.
Shared elements: This section comprises Home Location Register (HLR),
Equipment Identity Register (EIR) and Authentication Centre (AuC). The HLR is a data base which contains the information of registered users to the network i.e. all active as well as non active users. The EIR is responsible to decide whether UE is valid and authorized to access the network or not. Each UE has its unique International Mobile Equipment Identity (IMEI) code to check the validi-ty of the device. The AuC is a data base which stores the cipher text of each user for security purpose. [8]
3.2.2 UMTS Physical, Transport and Logical channels
UMTS channels are classified into three categories: physical, transport and logical channels. [8]
Table 3.1: UMTS physical channels and their descriptions
Channels Descriptions
Common Control Physical Channel (CCPCH)
It broadcast the system information in Broadcast Channel (BCH) and paging information in Paging channel (PCH) Common Pilot Channel
(CPCH)
It is responsible to identify the scrambling code for syn-chronization between UE and NodeB
Physical Random Access Channel (PRACH)
It is responsible to send random access message for syn-chronization between UE and NodeB
Physical Downlink Shared Channel (PDSCH)
It is used to share the control information among the UEs within the NodeB coverage
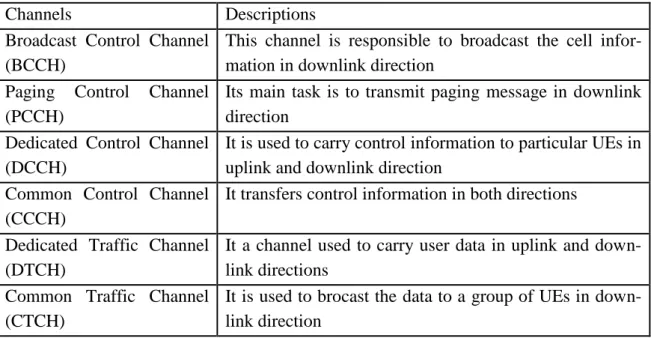
Table 3.1 shows physical channels which are responsible to exchange the information between the user and UMTS Terrestrial Area Network (UTRAN) in UMTS. In UMTS, common control physical channel is classified as Primary CCPCH (P-CCPCH) and Secondary CCPCH (S-CCPCH). Primary common control channel is responsible to carry system information in Broadcast Channel (BCH) and secondary common control channel is responsible to carry paging information in transport Paging Channel (PCH).
Table 3.2: UMTS transport channels and their descriptions
Channels Descriptions
Broadcast Control Channel (BCCH)
This channel is responsible to broadcast the cell infor-mation in downlink direction
Paging Control Channel (PCCH)
Its main task is to transmit paging message in downlink direction
Dedicated Control Channel (DCCH)
It is used to carry control information to particular UEs in uplink and downlink direction
Common Control Channel (CCCH)
It transfers control information in both directions Dedicated Traffic Channel
(DTCH)
It a channel used to carry user data in uplink and down-link directions
Common Traffic Channel (CTCH)
It is used to brocast the data to a group of UEs in down-link direction
Table 3.2 shows transport channels that describe the characteristics of the data trans-ferred on the physical layer. The transport layers are interface between physical and MAC layer.
Table 3.3: UMTS logical channels and their descriptions
Channels Descriptions
Synchronization Channel (SCH)
It is responsible for synchronization between the UEs and NodeBs
Dedicated Transport Chan-nel (DCH)
It is responsible to transport the data to the particular UE in both uplink and downlink directions
Broadcast Channel (BCH) It broadcasts the information necessary to UE to identify the cell and the network
Forward Access Channel (FACH)
It mainly transmits the control data or user data to UE in the downlink direction
Paging Channel (PCH) It carries paging information to establish the connection with UE in the downlink direction
Random Access Channel (RACH)
It is responsible to carry service request from UEs in up-link direction
Downlink Shared Channel (DCH)
This channel is shared by different UEs to transmit con-trol information or user information in downlink
Table 3.3 presents logical channels which are interface in between Medium Access Control (MAC) layer and Radio Link Control (RLC) layer whereas. Logical channels are mapped into transport channel in the Media Access Control (MAC) layer. They de-scribe what type of data is transferred between the user and the network.
3.3
High Speed Downlink Packet Data Access (HSDPA)
High Speed Packet Access (HSPA) introduced by 3GPP is evolved from WCDMA network to support the high data rate, reduce latency and increased capacity. Initially High Speed Downlink Packet Data Access (HSDPA) was introduced in Release 5 and later on High Speed Uplink Packet Data Access (HSUPA) was introduced in Release 6. HSDPA protocol supports high speed data in the downlink direction.
A new transport channel High Speed Downlink Shared Channel (HS-DSCH) is added to WCDMA for HSDPA for faster downloads in downlink directions. This channel ena-bles to allocate a fraction of radio resources to a specific user for data transmission. HSDPA improves the data rate by a factor of 5 as compare to the WCDMA. Theoreti-cally, it gives the data rate of 8-10 Mbps and even more with Multiple Input Multiple Output (MIMO) technique. This technology can be implemented on 5 MHz channels available for UMTS system. [8] [9]
3.4
LTE Evolution and Upgrade Path
LTE was introduced by 3GPP to overcome the limitations of the previous network tech-nology in terms of system coverage, performance and capacity. This new techtech-nology provide high data rates, supports new features like video chatting and multimedia ser-vices and serve the existing terminals at the same time in efficient manner. The 3GPP emphasized the key features and performance requirement targets for LTE. [10] [11]
Higher peak data rate of 100 Mbps for downlink and peak 50 Mbps for uplink in 20 MHz band. It offers downlink data rate of 150 Mbps in downlink using 2 2
MIMO and 75 Mbps in uplink using 1 2 antenna configuration for 20MHz channel.
Significantly improved spectral efficiency, 2 4 times higher than that of 3GPP Release 6 standards. Peak spectral efficiency is 5 bps/Hz in downlink and 2.5 bps/Hz in uplink is achieved with two receive antennas and one transmit antenna configuration.
Interoperability with previous 3G or 2G systems and other non-3GPP technolo-gies. It is optimized for low speed ( 0 15 km h/ ) mobile terminals and support high speed
120 km h/ 350 km h/
mobile terminals or even higher up to500 km h/ depending upon frequency band.
Provides high quality of service. It has radio access network latency less than 10 ms. The control plane latency from idle mode to active mode is less than 100 ms
while for user plane latency is less than 50 ms for real time application and voice.
Bandwidth flexibility allocation with 1.4, 3, 5, 10, 15 and 20 MHz
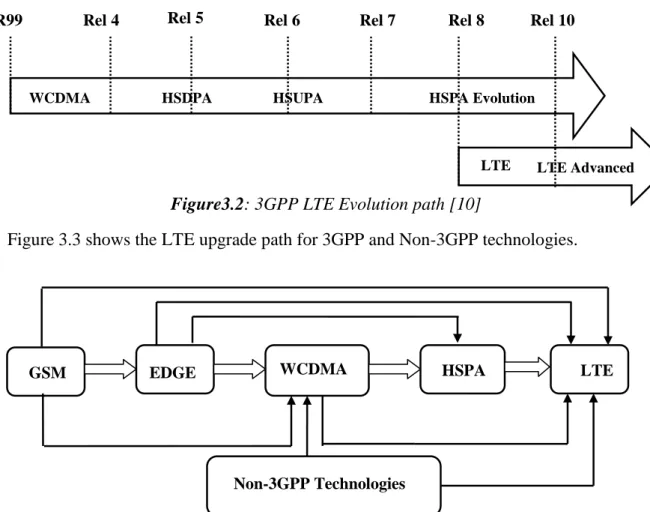
With growing demand of new technologies to support high data rates and minimum latency with low cost and higher performance, evolution is always needed. These de-mands are always taken into account during evolution on cellular network for users. LTE is the new emerging technology evolved from 2G and 3G standards like Global System for Mobile Communication (GSM), Universal Mobile Telecommunication Sys-tem (UMTS) and High Speed Packet Data (HSPA). Figure 3.2 shows the LTE evolution path from its predecessor networks based on release dates.
Figure3.2: 3GPP LTE Evolution path [10]
Figure 3.3 shows the LTE upgrade path for 3GPP and Non-3GPP technologies.
Figure3.3: LTE upgrade path for 3GPP and Non-3GPP technologies [8] [10] Any 2G and 3G network can be upgraded directly towards LTE by any vendors and operators without following any specific path. This upgrade path helps to reduce cost while adopting new technologies and standards.
3.5
LTE Network Architecture
Figure 3.4 shows the LTE network architecture and the elements associated with it. This architecture is mainly designed to support the IP system. The architecture was made flat
WCDMA HSDPA HSUPA HSPA Evolution
LTE LTE Advanced
R99 Rel 4 Rel 5 Rel 6 Rel 7 Rel8 Rel 10
GSM EDGE WCDMA HSPA LTE
to reduce the number of network elements. This helps to increase the system perfor-mance. The User Equipment (UE), Evolved Universal Terrestrial Radio Access Net-work (EUTRAN), Evolved Packet Core (EPC) and Service layer are the major logical elements in LTE which are briefly described below. [11]
Figure 3.4: LTE system architecture [10] 3.5.1 User Equipment (UE)
User Equipment are hand held devices for user. It may be a smart phone, dongle device or a laptop used to establish, maintain and remove the radio connectivity according to user requirement. Each UE has its own Universal Subscriber Identity Module (USIM) to separate and authenticate from other UEs. They are connected with EUTRAN with LTE-Uu interface. [12]
3.5.2 Evolved UMTS Terrestrial Radio Access Network (E-UTRAN)
The EUTRAN is the evolution from UTRAN network which contains only one node called eNodeB. The NodeB and Radio Network Controller (RNC) are combined to form a single eNodeB to flatten the network architecture in LTE. This reduces the network latency. The eNodeB performs the function of both NodeB and RNC. Each eNodeB are interconnected with each other via X2 interface. The EUTRAN also interconnects MME and SGW with S1-MME interface and S1-U interface respectively. Figure 2.4 also shows the EUTRAN interface with other network elements. These interfaces are stand-ard and defined by 3GPP to facilitate the multi-vendors.
The main functions of EUTRAN are the physical layer processing, Radio Resource Management (RRM) and Mobility Management. It performs power control of the sig-nal, analog-digital-analog conversion of the signal at the air interface, encryption and decryption of user plane data as well as compression of IP header to reduce redundancy. The EUTRAN also manage the radio resources. It indicates the type of modulation used, retransmission of the data, Quality of Service (QoS) management, resource
sched-PCRF P-GW HSS S-GW MME UE eNodeB eNodeB E-UTRAN EPC LTE-Uu S1-U S1-MME Gxe S5/S8 S11 S6a Gx
uling etc. It receives measurement report of RSRP and RSRQ value from UE for hand-over decisions.
3.5.3 Evolved Packet Core (EPC)
EPC is the core of the network. The architecture is evolved from the GPRS architecture which is completely based on end to end IP connectivity. The main functions of EPC are to support seamless mobility, QoS and charging functions of IP based networks. The major elements of EPC discussed below.
3.5.3.1 Mobile Management Entity (MME)
MME is a control node in LTE network. It is responsible for mobility management, tracking the location as well as security functions between the UE and the network. It is linked with Home Subscription Server (HSS) via S6a interface for authentication and authorization of the users. It performs activation and deactivation of the radio bearers with Serving Gateway (SGW) connected with S11 interface. The MME also involved in management of Non-access stratum (NAS) signalling security. At the radio interface the NAS forms the apical stratum of the control plane between UE and MME. Its task is to support user mobility and authentication and session management for IP connection between UE and Packet Gateway (PDN- GW). The MME is also responsible for hando-ver performance in between the LTE and previous legacy 3G/2G networks via S3 inter-face (SGSN to MME). It performs selection of MME and Serving GPRS Support Node (SGSN) for handover change. [10]
3.5.3.2 Serving Gateway (S-GW)
The S-GW is a user plane element for forwarding and receiving the IP packets from UE to P-GW and vice versa. It acts as a local or mobility anchor during handover process. The S-GW switched the user plane path from serving eNodeB to a new eNodeB when MME sends the request depending upon the UE mobility. The IP packets received from the eNodeB are forwarded to the GW using GPRS Tunnelling Protocol (GTP). The S-GW receives the IP packets and forward to the Packet Gateway (PDN-S-GW) using the same GTP. The same thing happens in reverse way. As in case when a UE goes to idle mode all of sudden while receiving the data packets from PGW, the SGW resumes the data flow towards the MME and holds all the incoming packets in its buffer container. Meanwhile it request MME to send a paging message to that idle UE. Once UE in con-nected mode, the buffer data packets are forwarded towards UE along with the new packets from the PGW. [10]
3.5.3.3 Packet Gateway (P-GW)
The P-GW is the gateway to the external network. The working function is somewhat similar with GPRS Support Node (GGSN) in UMTS system. Internet, IP Multimedia Subsystem (IMS) and other service type networks are the example of external packet data networks. All these packet data networks are identified within the LTE networks by
![Figure 2.4: Multiple access techniques: (a) FDMA, (b) TDMA and (c) CDMA [3]](https://thumb-us.123doks.com/thumbv2/123dok_us/10177900.2920141/23.892.170.765.574.1094/figure-multiple-access-techniques-fdma-tdma-and-cdma.webp)
![Figure 3.4: LTE system architecture [10]](https://thumb-us.123doks.com/thumbv2/123dok_us/10177900.2920141/33.892.172.808.243.498/figure-lte-system-architecture.webp)
![Figure 4.2: OFDM transmitter and receiver [10]](https://thumb-us.123doks.com/thumbv2/123dok_us/10177900.2920141/37.892.190.783.803.972/figure-ofdm-transmitter-and-receiver.webp)
![Figure 4.4: Block diagram of SC-FDMA transmitter and receiver [10]](https://thumb-us.123doks.com/thumbv2/123dok_us/10177900.2920141/39.892.175.820.142.318/figure-block-diagram-sc-fdma-transmitter-receiver.webp)