20th International Conference on Structural Mechanics in Reactor Technology (SMiRT 20) Espoo, Finland, August 9-14, 2009 SMiRT 20-Division V, Paper 1857
Finite Element Analysis of the Primary Shield Structure and Evaluation for
Postulated Reactor Pressure Vessel Head Drop
Necip Onder Akinci
a, Jaspal Singh Saini
a, William H. Johnson
aa
Bechtel Power Corporation, Frederick, MD, USA, e-mail: [email protected]
Keywords: Impact, Concrete, Anchor Bolt, Primary Shield Structure, Finite Element, ANSYS
1
ABSTRACT
The primary shield structure of a nuclear power plant was evaluated for a postulated reactor pressure vessel head (RPVH) drop using finite element analysis. Dynamic response analysis and concrete evaluations were performed in accordance with the guidelines developed by the Nuclear Energy Institute (NEI, 2008) in response to the regulatory concerns. A solid element model and linearly elastic transient response time history analysis using the ANSYS program (2007) were utilized in conjunction with energy balance techniques to determine concrete inelastic response. Specifically, concrete evaluations were performed in accordance with ACI 349 (2006), and inelastic capacity was calculated with the impacted structures absorbing a fixed amount of energy. Based on this energy absorption, maximum strains were determined and compared with allowable and/or rupture strains. The anchorages were evaluated for tension and shear forces due to impact.
2
INTRODUCTION AND BACKGROUND
Reactor pressure vessel head lifts are required for head replacement operations and refueling outages at nuclear power plants. To ensure that the reactor core remains covered with coolant and sufficient cooling is available following a postulated RPVH drop, it is required to evaluate the consequences of impact loading from a concentric flat head drop [e.g. more than 400 kips (1780 kN) free-falling through 40 ft (12.2 m) or more] onto the vessel flange (NUREG-0612, 1980). Available literature for this non-design basis event is limited and structural response acceptance criteria are currently under development jointly by the US Nuclear Regulatory Commission (NRC) and the industry group Nuclear Energy Institute (NEI, 2008). Determination of system responses for implementation of these criteria entails transient linear or nonlinear dynamic analysis of the nuclear steam supply system, internal concrete structure and containment system by Finite Element (FE) software such as ANSYS (2007). As it is convenient and necessary, due to contractual and division of responsibility requirements, to separate the design/analysis considerations for the nuclear steam supply system (NSSS) from those for the supporting internal concrete structure (ICS), a decoupled approximate approach must be taken. Also, there are unique and special response and design evaluation considerations for this impact loading condition. This investigation provides general guidance and recommendations for addressing the NSSS interface with boundary and supporting structures and ICS in the performance of FE analysis and design evaluations for this beyond design basis RPVH postulated drop event.
3
DESCRIPTION OF STRUCTURE AND FINITE ELEMENT MODEL
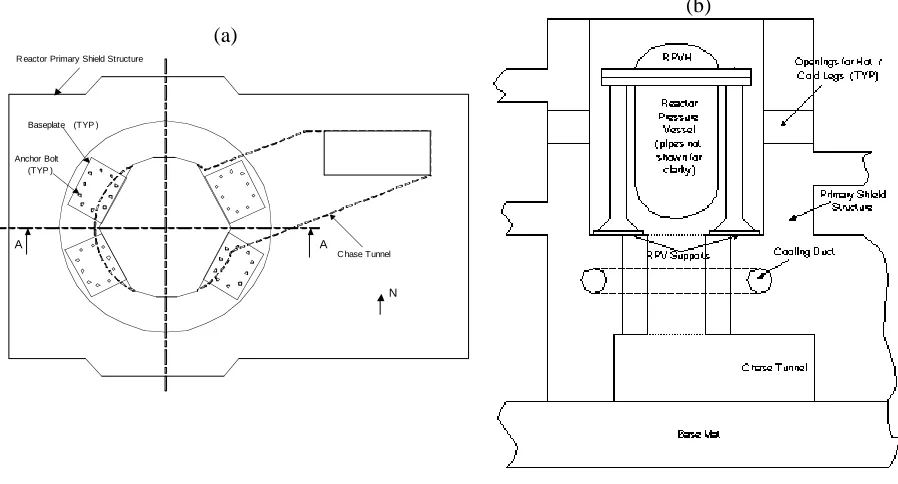
The Reactor Pressure Vessel (RPV) for the pressurized water reactor is supported on the RPV support structure, which primarily consists of reinforced concrete corbels projecting from the heavily reinforced concrete walls in the cavity of the reactor primary shield structure. The steel columns supporting the top flange of the vessel are supported on steel base plates, which in turn are anchored to the concrete corbel by high strength steel bolts. The support configuration is however different over the chase tunnel portion of the structure, and the steel column in this region is supported by a deep reinforced concrete beam, which in turn is supported by the walls of the primary shield structure. Figure 1 show the typical plan and cross-section of the RPV support structure, including the reinforced concrete corbels, the chase tunnel, and the base plates with anchor bolts. Figure 1(a) also shows the considered North direction, which is used to label the base plates in the subsequent sections of this paper.
(a)
Baseplate (TYP )
Anchor Bolt (TYP )
C hase Tunnel
A A
R eactor Primary Shield Structure
N
(b)
Figure 1: Geometry of RPV Support Structure. (a) Plan, and (b) Cross-Section.
The structural geometry of the reactor primary shield structure is very complicated since it contains numerous openings, and the profile of the reactor cavity changes substantially along the height. The reactor cavity starts as a rectangular shape at the basemat, which is 8 ft (2.4m) thick, and fill concrete is placed to maintain the desired level. The primary shield walls, which act as the RPV support structure, except over the chase tunnel, start from the top of basemat. Steel liner plates of varying thickness separate the fill concrete and reinforced concrete, and the structural continuity is maintained by welding vertical rebar to the liner plates on both sides. Cooling ducts with circular cross-section are located within the concrete corbels, and openings for hot and cold legs are located near the top of the primary shield structure. The primary shield structure is connected to the secondary shield structure by numerous slabs of varying thicknesses. The depth of the concrete corbels and the tunnel beam is 159.5 in (4.1 m) and the RPV columns are supported on 10 in (25.4 cm) thick steel base plates with plan dimensions of 73.5 in by 57.5 in (1.9 m by 1.5 m). There are 10 in (25.4 cm) deep notches in the primary shield wall at the base plate locations to ensure proper fit of the base plate (not shown for clarity in Figure 1). The base plates are anchored to the concrete corbels and tunnel beam by ten 3.5 in (88.9 mm) diameter ASTM A540 Gr. B22 bolts.
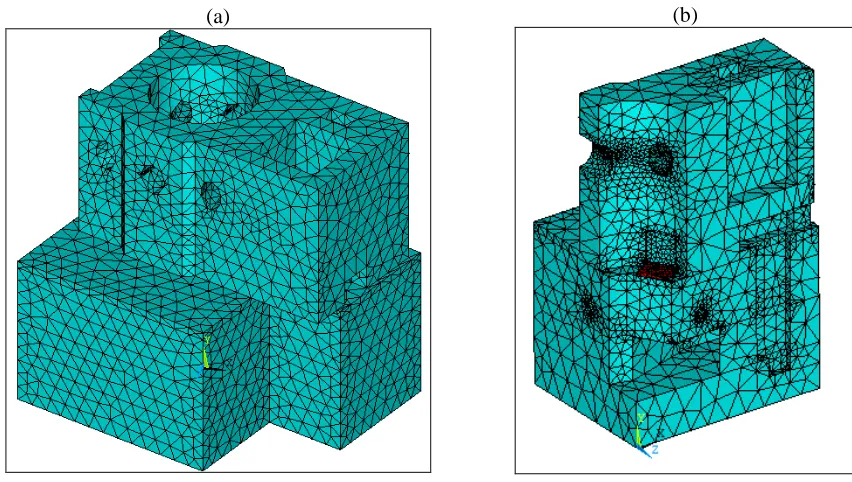
structure is very complex, meshing of the geometry using 8-noded brick element (ANSYS Element Type SOLID45) was impractical. Therefore, meshing was done using 10-noded tetrahedral element (Type SOLID92), which matches the accuracy of the 20-noded brick element (Type SOLID95) while leading to a substantial reduction in the model size. Figure 2(a) shows the full mathematical model of the structure, and Figure 2(b) shows the mesh for the Northeast (NE) quadrant of the model.
(a) (b)
Figure 2. Finite Element Model of Primary Shield Structure. (a) Full Model, and (b) Model for NE Quadrant.
The input from the RPV head drop consists of force and moment time histories in all directions, which are transferred to the support structure from the RPV support columns. Since the steel columns were not included in the FEM of the primary shield structure, the interface between the steel base plates and the base of the columns was modeled using a special technique. The SOLID92 elements used to model the concrete elements and the steel base plate does not support rotational degrees of freedom (ANSYS, 2007). Therefore, the top surface of the base plates was superimposed with ‘dummy’ shell elements (element ype SHELL93, which is an 8-noded structural shell and supports six degrees of freedom at each node). The thickness of these ‘dummy’ elements was kept sufficiently small so that it doesn’t add any stiffness to the structural system. In order to transfer the load at the exact location corresponding to the center of the column, the force and moment time histories from the RPV support column were applied to a master node corresponding to the center of the column. Using the rigid region constraint of ANSYS, all nodes at the top of the base plate were connected to the master node.
4
TRANSIENT ANALYSIS
A dynamic analysis was performed with the ANSYS computer program (2007). The stress resultants were calculated at the critical sections to determine the maximum moments and shear forces. The input time histories of 0.12 sec duration were applied to the base plate master node in each of the six degrees of freedom. The full solution option of ANSYS program (2007) was used to solve the equation of motion directly. The Newmark time integration method was used for calculating the time history response. Eigenvalue analysis of a sub-model simulating the concrete support indicated the fundamental vibration mode frequency to be 332 Hz. As a conservative upper bound it was assumed to be 500 Hz, and 20 times the natural frequency was chosen as the time step interval to capture the dynamic response of the structure. Therefore the time interval was set to 1x10⁻⁴ sec. Material damping was not included in the analysis, since it doesn’t affect the transient response in an impact simulation.
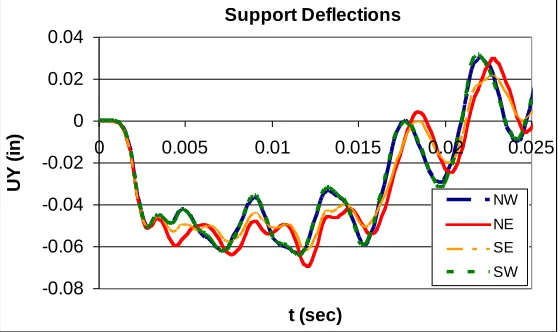
Concrete response was evaluated at the section cuts over the chase tunnel shown in Figure 1. Furthermore, the stresses are evaluated under the steel plates over the supports to evaluate the possibility of local crushing. For section cuts, only the initial compression portion of the loading curve was considered. After the full rebound of load, the bolts were subjected to tension and would fail as discussed below in Section 6. Figure 3 shows the vertical deflection response at the supports.
Support Deflections
-0.08 -0.06 -0.04 -0.02 0 0.02 0.04
0 0.005 0.01 0.015 0.02 0.025
t (sec)
U
Y
(
in
)
NW
NE SE
SW
Figure 3. Vertical Deflections of Supports (1 in = 25.4 mm)
Figure 4. Shear Forces and Moments on the Critical Surfaces above the Chase Tunnel
Figures 5 and 6 show the vertical shear and moment resultants at the rear face of the evaluated block (Cut 3). The moments and shears were obtained for all critical sections. Furthermore, the maximum moments and shears resisted by the anchor bolt groups were evaluated over time.
Cut 3 Vvertical
-15000 -12000 -9000 -6000 -3000 0 3000 6000 9000 12000 15000
0 0.005 0.01 0.015 0.02 0.025
t (sec)
V
(
k
ip
)
Figure 5.Vertical Shear Resultant at Cut 3 (1 kip = 4.448 kN)
Cut 2
Cut 3
NE
N
V
verticalV
verticalV
radialM
M
Cut 3 Moment Resultant
-40000 -30000 -20000 -10000 0 10000 20000 30000 40000 50000
0 0.005 0.01 0.015 0.02 0.025
t (sec)
M
(
ft
-k
ip
)
Figure 6.Moment Resultant at Cut 3 (1 ft-kip = 1.356 kNm)
5
REINFORCED CONCRETE EVALUATION
Figures 2(a), 2(b), and 7 depict the geometry of the concrete supporting the RPV. The normal and shear (radial and tangential) impact loading time histories resulting from the dropped vessel act at the center of each base plate. Selected shear and moment response time histories are shown in Figures 5 and 6. Any increases in concrete stress due to interaction effects between support loads were indicated by analysis to be negligible so that the concrete evaluations for each of the four supports could be performed independently.
Three of the four reactor column supports are located at ledges on walls which bear directly on the basemat and the fourth support spans over a tunnel as shown in Figures 1(a), 1(b) and 2(b). The critical location for concrete response evaluation is over the tunnel, as discussed in Sec. 3. This support is essentially a double-spanning shear beam, acting as cantilever shear beam spanning in the radial direction and as a fixed-fixed beam spanning in the tangential direction as shown in Figure 7.
From the finite element time history transient dynamic analysis for the concrete response, the maximum response stress resultants (for the significant stress components) are determined on the cut sections 1, 2 and 3 identified in Figures 4 and 8. These resultants, are compared with the cut section ultimate strengths (parenthesized), determined in accordance with ACI 349-06. Where and if one of more of the cut section strengths are exceeded by the section stress resultants, the system response forces are redistributed and the system response ductilities evaluated and compared with allowable ductilities.
87.5" 1 5 9 .5 " P P 6 0 " 2 4 " 105" TUNNEL 7.5" 40 #14 BARS TOP
23 #14 BARS BOTTOM
11 LAYERS (LAYERS SPACED AT 12") #9 BARS (12 BARS EA.
LAYER) a b d c #10 HOOP BARS @ 11" #10 BARS
73 X 57.5 BASEPLATE
e
f
PLANT NORTH
PLAN
Figure 7. Concrete Reinforcement Details at Tunnel
1 3 2 17034 11513 14461 45282 4949 27879
P e ey R emax e1 P1 a b c d e f g h
µ = !max /!y
Figure 8. Moment and Shear Figure 9. Energy Balance for Elastic- Stress Resultants Plastic Response
achieved by placing reinforcement across this anticipated crack so that the tension developed by the reinforcing bars …”). Shear friction pushoff test results for shear force vs. interface displacement, conducted by Bass et al (1989), indicate that over a wide range of system parameters (reinforcement ratio, interface surface preparation, concrete strength, embedment depth), there is practically no degradation in shear friction resistance up to about 0.10 in of interface surface relative displacement and for increasing relative displacements beyond 0.10 in, the shear friction resistance, for fully developed reinforcement, drops off to not less than 50% of the initial resistance at a displacement of 0.4 to 0.5 in. Comparing the external work done with the energy absorption capacity in shear friction (neglecting other energy absorption mechanisms)
External Work = (1/2)K 2 = (Slip) (6460+5818)
and solving, the interface slip is determined to be 0.06 in < 0.4 in.
For the other three supports, the local crushing of concrete is considered as the possible mode of concrete failure. The continuous concrete volume under the base plates makes it very unlikely for another mode of failure due to compression. Therefore, the concrete stresses in the vertical direction are considered for the damage evaluation of these supports due to compression. The stress in the vertical direction beneath the base plates at the instant of maximum total compression is 6500 psi, which is less than the allowable of DIF x fc
’
= 7425 psi for a compressive strength of fc ’
= 6750 psi (1 psi = 6895 Pa), where DIF = 1.10 with respect to ACI 349 (2006). Note also, that some very localized areas have vertical stresses as high as 7400 psi, which is near the concrete compressive capacity of 7425 psi. This is not a concern, as minor, localized crushing of the concrete does not inhibit any global structural function.
6
EVALUATION OF ANCHORAGE
The column base load input time history provided by the NSSS supplier indicated that the rebound of load may result in a net peak tension of 16700 kips (74285 kN). Response history analysis of the primary shield structure based on these column loads indicated a maximum tensile load of 21000 kips (93413 kN) on the anchorages. Since this was an elastic analysis, concrete breakout and yielding of rebar or the bolts were not considered in the FEM. Several possible failure mechanisms were investigated in accordance with related ACI 349 (2006) and ACI 318 (2008) provisions.
6.1 Shear Friction (Block) Failure
Failure of the concrete block under the steel columns due to upward force is resisted by shear friction developed at the interface between the supports and the walls if the concrete pullout does not control the capacity. ACI 349 Section 11.7.3 (2006) permits use of any shear transfer design method that results in prediction of strength in substantial agreement with results of comprehensive tests. Therefore, the method presented in ACI 318 Section R11.6 (2008) is considered appropriate for the calculation of shear friction resistance. All the #9 rebars crossing the hypothetical failure surface [ABC in Figure 10(c)] were considered in the analysis. Development lengths were also checked for these bars.
(a) Single support failure
(b) Failure of two supports
(c) Postulated Failure surface in Section
A
B C
Figure 10. Failure Surfaces for Shear Friction (Block) Failure (only reactor cavity shown for clarity)
6.2 Anchor Bolt Failure
Failure of the anchor bolts in tension was investigated as another probable mode of failure. A spreadsheet program, developed in-house was used for calculation of anchor bolt capacity according to ACI 349 (2006). Calculated anchorage capacities are summarized below in Tables 1 and 2. Nn is nominal tension strength, Vn is nominal shear strength and
φ
is strength reduction factor in Tables 1 and 2.Table 1. Anchorage Capacities for Possible Tension Failure Mechanisms (1 kip = 4.448 kN)
TENSION Nn (kip)
φ
φ
Nn (kip)Bolt Tension 12026 0.7 8418
Pullout 94686 0.75 71015
Shear Friction Failure 13603 0.75 10202
Capacity Based on Anchor Reinforcement Strength 5209 0.75 3907
Table 2. Anchorage Capacities for Possible Shear Failure Mechanisms (1 kip = 4.448 kN)
SHEAR Vn (kip)
φ
φ
Vn (kip)Bolt Shear 7216 0.75 5412
Pryout* 2197 0.75 1648
Capacity Based on Anchor Reinforcement Strength 4408 0.75 3306
* Conservatively, contribution of the compressive stresses to pryout resistance is not considered in the calculation of pryout strength. The actual pryout resistance is expected to be significantly higher.
The anchorage capacities presented above, together with time history response results were used in the anchorage evaluation. These comparisons enabled determination of the actual failure mode. Compression failure is not expected except for crushing of concrete at some localized regions. Hence, axial compression due to impact was not considered as a failure mechanism. Local crushing of concrete due to compression at the supports is considered to be very unlikely after checking the compressive stresses. However, tension capacity to resist the uplift force needed to be evaluated. Tensile capacity of the bolt group can be exceeded after the rebound of load. Shearing of the bolts is not expected to be probable, based on the shear force history for the bolt groups. Shear capacity due to concrete breakout was not considered in the evaluation, since the shear forces due to impact load were acting from reactor cavity towards the walls. Therefore, it can be concluded that the failure mode is tension rather than shear if the structure can sustain the initial impact.
expected to result in a relatively ductile behavior. ACI 318 (2008) Section D.5.2.9 indicates that a strength reduction factor () of 0.75 should be used in the design of anchor bolt reinforcement. Section RD.5.2.9 also reveals that the behavior of anchor reinforcement in tension is similar to that of strut and tie models. Hence, the failure mechanism exhibits a behavior similar to that of stirrups resisting shear completely. Therefore, a ductility factor of 3 can be considered based on ACI 349 section F.3.7 (2006).
In conclusion it can be said that the anchor bolt capacity resisting uplift during rebound is expected to be around 4,000 kips with a ductility ratio of 3 and the upper bound for the capacity is about 12,000 kips. Hence, the applied load exceeds the tensile capacity of the anchor bolts. Nonlinear analysis of concrete structure could also be a possible alternative, but the improvement in the accuracy of the results would be questionable and it would require a dedicated study.
7
CONCLUSION
Evaluation of primary shield structures for postulated load drop events requires a rigorous analytical approach and realistic calculation of structural capacity. Faithful representation of the concrete structure is the main advantage of developing a solid model. Use of a detailed finite element model enables calculation of stresses and stress resultants at critical sections in an irregular and complex geometry. This in turn allows evaluation of critical sections using reinforced concrete principles and code equations. However, current code provisions do not address all aspects of the primary shield capacity evaluation. Therefore, use of state of the art techniques may be needed for a realistic analysis. Also, a conservative approach needs to be followed in the absence of data and code provisions. An example of this can be evaluation of long anchor bolts with a large diameter such as those used for bolting the RPV support columns to the primary shield structure.
Evaluation of the reactor primary shield structure analyzed in this study indicates that this structure can withstand the initial impact due to the RPVH drop. However, the anchorages are expected to fail due to the rebound response.
REFERENCES
ACI 318-08, Building Code Requirements for Structural Concrete and Commentary. 2008.
ACI 349-06 & 349R-06, Code Requirements for Nuclear Safety Related Concrete Structures and Commentary. 2006.
ANSYS Version 11, "User Manual." ANSYS, Inc. Software Products. Pennsylvania. 2007.
Bass, R. A., Carrasquillo, R. L., and Jirsa, J. O., “Shear Transfer across New and Existing Concrete Interfaces”, ACI Structural Journal, Vol. 86, No. 4, July-August 1989.
NEI 08-05, Rev. 0, "Industry Initiative on Control of Heavy Loads." Nuclear Energy Institute, Washington D.C. 2008.
NUREG-0612, "Control of Heavy Loads at Nuclear Power Plants." Office of Nuclear Reactor Regulation, U.S. Nuclear Regulatory Commission, Washington D.C. 1980.