Abstract
WEBER, VICTORIA LYNN. Defining the Relationship Between Learning Statistical
Computing and a Student's Ability to Think and Reason Statistically. (Under the direction of Dr. Hollylynne Lee).
The purpose of this study was to begin examining the relationship that exists between a
student’s use of statistical computing tools and the ways in which students think statistically. To
explore this relationship, a qualitative research study was designed to collect multiple instances of
statistics problem solving with statistical computing tools in both written form and through a
one-on-one problem solving session with the researcher. Fourteen students in a second semester
statistics course completed a total of 91 written assignments across a semester. Additionally, a
subset of 5 volunteer students also completed task-based interviews. These assessments required
the students to use statistical computing software and their core knowledge of statistics to give
complete results. A qualitative analysis of the students’ work was conducted and an initial
definition of the relationship between statistical computing and thinking was formed. The results
of the study are organized in three manuscript Chapters.
The purpose of the first manuscript is to show how written work can be used to assess
statistical thinking. The paper discusses some popular forms of written assessment used by
instructors of statistics and other quantitative fields. An argumentation structure, similar to a model
defined by Toulmin (1958) is defined. More detail is then given on three of the writing assignments
utilized in the course, their intended assessment purpose and the types of answers teachers may
expect to see if they were to give these assessments to their students.
The purpose of the second manuscript is to begin defining the relationship between
statistical computing and statistical thinking. Through a qualitative study of the written
identified and illustrated with examples from students work. Implications for teaching and research
due to these patterns follow.
The purpose of the third manuscript is to provide an in-depth analysis of how statistical
computing is used by students to solve statistical problems. Since written work does not always
give the best picture of the problem solving process, task-based interviews from 5 students were
conducted and analyzed to provide a more in depth view of how students use statistical computing
tools to solve statistical problems. Mimicking a problem solving analysis structure originally
created by Lee and Hollebrands, the ways in which students use statistical computing while solving
problems are described, and ways in which instructors may be able to help students solve problems
using statistical computing software are given.
Results from the study indicate that there is a relationship between statistical thinking and
statistical computing. When students are able to use statistical computing and possess good
problem solving habits, they tend to produce logical arguments that show the strength of their
statistical thinking sophistication. However, when students do not possess the capability to utilize
the statistical computing technologies, statistical problem solving becomes very difficult or nearly
Defining the Relationship Between Learning Statistical Computing and a Student's Ability to Think and Reason Statistically
by
Victoria Lynn Weber
A dissertation submitted to the Graduate Faculty of North Carolina State University
In partial fulfillment of the requirements for the degree of
Doctor of Philosophy
Mathematics Education
Raleigh, North Carolina 2017
APPROVED BY:
___________________________ ___________________________
Dr. Karen Keene Dr. Herle McGowan
___________________________ ___________________________
Dr. Hollylynne Lee Dr. Justin Post
ii
Biography
Victoria Weber was born in Cleveland, Ohio on February 6, 1984. She is the daughter of Harold and Lynn Weber and sister to Matthew Weber. After graduating from Berea High School in 2002, she attended Ohio University where she received a bachelor’s in actuarial science (2006) and a masters of mathematics with an emphasis in education (2007). After graduation she moved south to teach mathematics at Surry Community College in Dobson, North Carolina for three years. During her time at Surry she developed her love of teaching and her love of statistics, which is what prompted her to continue her education.
In 2010 she moved to Raleigh, North Carolina to earn a master’s in statistics from North Carolina State University. After graduation she was offered a position at Meredith College, an all-women’s college, in Raleigh, NC. She has been teaching statistics and mathematics there for more than five years.
While teaching at Meredith, she decided to go back to school to earn her PhD in mathematics and statistics education. In the spring of 2014 she started in the mathematics education program at North Carolina State University under the direction of Dr. Hollylynne Lee.
iii
Acknowledgements
First and foremost, I would like to thank my advisor, Hollylynne. Without her “many smiles” I probably never would have come this far. She spent many hours discussing the path this document should take and making edits to drafts. She has been very patient with me and has been an amazing mentor. I cannot imagine having completed my PhD with anyone else at the helm.
I would also like to thank my committee members, Karen, Herle and Justin for always being so flexible. Trying to make the schedules of 5 very busy academic professionals mesh is no easy task. Even finding an hour or two in a month where we were all free sometimes seemed impossible. But somehow we made it work.
Next, I would like to thank my family members. To my loving fiancé Roger, for being so very patient with me as I finished my dissertation and always offering me help when you knew the stress was getting me. To my parents, Harold and Lynn, who always told me I needed to get an education before getting married, you probably never thought I would take it this seriously. To my brother, Matthew, for teaching me how to write a term paper several years ago. And to my grandparents, Jack and Julia, for granting your generous financial support that helped to make my dreams come true.
iv
v
Table of Contents
List of Tables ... vii
List of Figures ... viii
Chapter 1 : Introduction ... 1
Statistics Technology: Where we are ... 1
Statistics Technology: Where we are going ... 3
Research Questions ... 4
Organization of the Document ... 5
Chapter 2 : Literature Review and Theoretical Framework ... 6
Statistical Reasoning ... 6
Statistical Thinking ... 7
Statistical Computing ... 13
Assessing Statistical Thinking and Statistical Computing ... 20
Problem Solving Methods ... 21
Chapter 3 : Methodology ... 25
Study design ... 25
Participants ... 25
Data Sources ... 26
Analysis ... 30
Ethical Considerations... 33
Chapter 4 : Writing Assignments to Assess Statistical Thinking ... 35
Journal ... 35
Abstract ... 35
Introduction ... 36
Literature Review ... 37
Methods ... 47
Writing Assignment Examples... 49
Discussion and Implications... 57
Chapter 5 : How Learning Statistical Computing May Impact a Student’s Ability to Think and Reason Statistically ... 62
Journal ... 62
Abstract ... 62
Introduction ... 63
Guiding Framework ... 68
vi
Overview of Analysis ... 73
Results ... 77
Implications for Teaching and Research ... 94
Chapter 6 : How Students Use Statistical Computing in Problem Solving ... 100
Journal ... 100
Abstract ... 100
Introduction ... 101
Framework ... 104
Methods ... 111
Results ... 119
Discussion ... 130
Chapter 7 : Summary and Conclusion ... 136
Summary ... 136
Answering the Research Questions ... 139
Implications for Teaching ... 145
Implications for Research... 146
Future Research ... 149
References ... 151
Appendices ... 163
Appendix A: Writing Assignments ... 164
Appendix B: Interview Protocol ... 168
Appendix C: Student Demographic Survey ... 172
Appendix D: NCSU IRB approval ... 173
Appendix E: Meredith College IRB approval ... 174
vii List of Tables
Table 2.1 Framework for identifying statistical thinking ... 13
Table 2.2 Framework for identifying the benefits of statistical computing ... 19
Table 5.1 Framework for identifying statistical thinking and statistical computing ... 69
Table 5.2 Number of co-occurrences between statistical thinking and statistical computing codes in ninety-one documents ... 82
Table 6.1 Affordances for different aspects of statistical computing ... 110
Table 6.2 Number of statistical computing actions used in each of the problem solving phases ... 118
viii List of Figures
Figure 2.1 Proposed relationship between statistical thinking and statistical computing ... 20
Figure 2.2 Phases of problem solving ... 23
Figure 3.1 Example color coding scheme to aid in writing assignment analysis ... 31
Figure 3.2 Example of a document diagram for the four sentence structure and use of statistical thinking and computing in a student's document ... 32
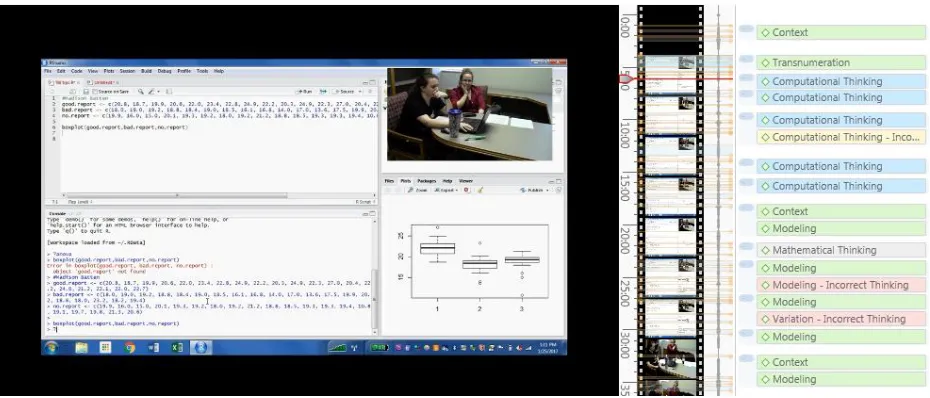
Figure 3.3 Picture-in-picture task-based interview example with statistical thinking and statistical computing codes ... 33
Figure 4.1 Weird Statistics: Regressing a Prom Date ... 50
Figure 4.2 Rubric for Weird Statistics: Regressing a Prom Date ... 51
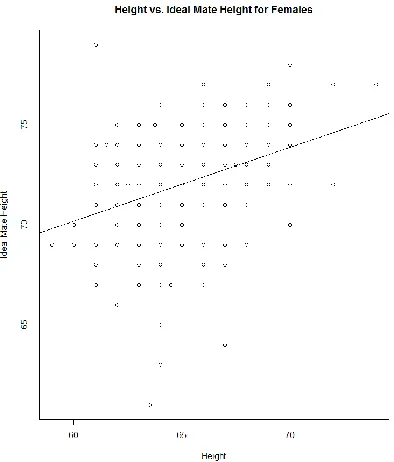
Figure 4.3 Scatterplot and regression line of the female data for Weird Statistics: Regressing a Prom Date ... 52
Figure 4.4 Chi-square Conditions Conundrum ... 54
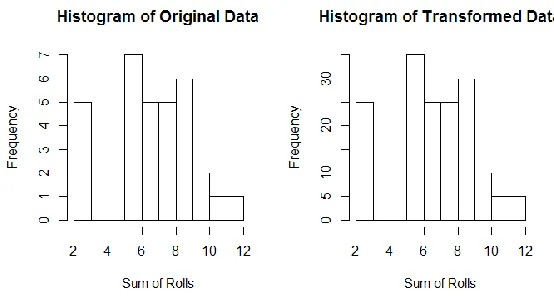
Figure 4.5 Histograms of original and transformed data for Chi-square Conditions Conundrum ... 55
Figure 4.6 Rubric for Chi-square Conditions Conundrum ... 56
Figure 4.7 Average score on writing assignments 3 through 10 ... 59
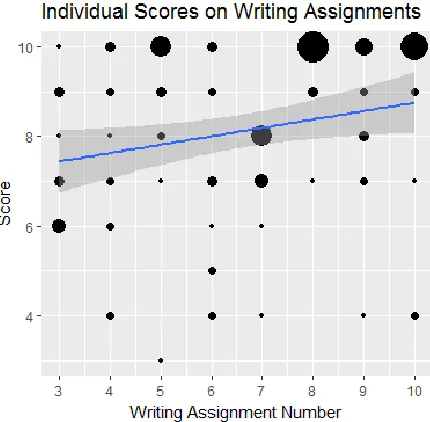
Figure 4.8 Bubble plot of scores for individuals on writing assignments 3 through 10 ... 59
Figure 5.1 Relationship between statistical thinking and statistical computing ... 70
Figure 5.2 Example document from writing assignment 4. Shows partitioning, color-coding and connections made in the document ... 75
Figure 5.3 Example of a document diagram for the four sentence structure and use of statistical thinking and computing in a student's document ... 76
Figure 5.4 Relationship between statistical thinking and statistical computing when correct thinking and computing are utilized ... 83
Figure 5.5 Demonstration of a correct strategy but incorrect programming ... 86
Figure 5.6 Relationship between statistical thinking and incorrect statistical computing ... 89
Figure 5.7 Relationship between statistical thinking and statistical computing when pitfalls are present ... 94
Figure 6.1 Phases of problem solving ... 111
ix
Figure 6.3 Sequence of problem solving phases in the task-based interviews ... 117
Figure 6.4 Proportion of time each student spent on the different problem solving phases ... 119
Figure 6.5 Website with misleading information that was utilized by Samantha... 130
Figure 7.1 Relationship between statistical thinking and statistical computing when correct thinking and computing are utilized ... 140
1
Chapter 1 : Introduction Statistics Technology: Where we are
With the creation of products such as Fathom (Finzer, 2000), TinkerPlots (Konold, 2007) and
StatCrunch (West, Wu, & Heydt, 2004), the integration of technology into statistics classes has
become widespread. These “learning tools” (Moore, 1997), are useful for quick calculations, but
more importantly, their dynamic nature and ease of use make it so that students can spend more
time exploring, visualizing and interacting with data to help them learn statistical concepts (Moore,
1997). This has recently become a high priority in statistics classrooms trying to adhere to the
Guidelines for Assessment and Instruction in Statistics Education (GAISE) college standards
(American Statistical Association, 2005; American Statistical Association, 2016).
Several researchers have found evidence that using these learning tools are helpful in
developing students’ statistical thinking and reasoning skills, especially in introductory statistics
courses. Several studies (delMas, Garfield, & Zieffler, 2014; Garfield, delMas, & Zieffler, 2012;
Watson, 2014) have looked at students’ ability to understand inference when using a program like
TinkerPlots to conduct a simulation. For example, Garfield, delMas and Zieffler (2012) found that
students in an introductory statistics course using TinkerPlots for randomization testing
“developed good statistical thinking about statistical inference” (p. 896). Chance et al. (2007) also
claim that these technologies are good for automating calculations, emphasizing data exploration
and visualizing abstract concepts, which are all elements that could improve student learning.
Students majoring in STEM fields or minoring in statistics may be required to take statistics
courses beyond the introductory level. For example, Brieger and Hardin (2012) discuss the need
for more sophisticated statistical knowledge in students studying in the health sciences to improve
2
argues that engineering students need a course in statistics that focuses on probability and
experimental design, with engineering specific examples presented.
One of the overarching goals of these courses is to prepare students who need to conduct more
advanced statistical analysis in their field, as opposed to learning statistics mainly to improve their
statistical literacy. Since the goals of the course are different from regular introductory statistics
courses, the technology that is used in them may also need to be different. Programs that are often
used in professional settings, which Moore has dubbed technology that “does statistics” (Moore,
1997) may be more helpful in preparing students for their future careers. These tools, such as R
and SAS, tend to be more powerful and more flexible for large scale statistical analysis, though
less user friendly than the tools used for “learning statistics”.
Especially with the introduction of the field of Data Science – a field that combines computer
science and statistics - one such course that has become more prevalent in statistics curricula is
statistical computing (Baumer, 2015; Chance, et al., 2014; Hardin, et al., 2015). This is a course
that encompasses the breadth of topics that merge statistics and computer science (Monahan,
2004). Users must be comfortable using a wide array of software tools - and perhaps hardware –
while understanding programming and logic to fully complete the spectrum of statistical tasks they
need to perform.
While there has been a push to implement such courses in undergraduate curricula (Gentle,
2004; Hardin, et al., 2015; Nolan & Temple Lang, 2010) the research on how students learn using
programs that are designed for doing statistics has not kept up with research on how students learn
using programs that are designed for learning statistics. Specifically, little research has been done
to document what affordances and constraints statistical computing technologies might have on a
3 Statistics Technology: Where we are going
The expectation for statistics majors and minors to learn computing tools in their curriculum
has recently grown (Chance, et al., 2014; Horton, Baumer, & Wickham, 2014; Nolan & Temple
Lang, 2010). Within statistics courses, students are learning data cleaning, graphical displays and
multiple techniques to aid them in their analyses (Hardin, et al., 2015). It is not enough to expect
students to teach themselves the majority of the technology while the instructor teaches only the
statistical concepts. If students are forced to learn the technology mainly on their own, they will
focus on getting the answers to the problems they have been assigned and often pick up bad
programming habits due to the lack of instruction and direction (Nolan & Temple Lang, 2010).
Conversely, focusing too much on how one uses the technology to conduct statistical tests may
teach the students that it is not important to explore the data before conducting formal inference
procedures. Thus, it is important for teachers to find the appropriate balance between teaching the
statistics and teaching the technology that is used to conduct the analysis.
Despite the cautions of the ASA about including programs like R and SAS in introductory
statistics courses (American Statistical Association, 2016), some students can successfully learn
these higher level languages while still grasping the concepts traditionally taught in introductory
statistics courses. Horton and his colleagues were able to successfully introduce the statistical
language R into their introductory statistics courses. Using RStudio and the MOSAIC platform,
their students were able to perform higher level statistical processes with a more difficult
technology earlier in their statistical careers. They do note however, that in teaching the statistical
computing ideas, there should be more examples and activities, but less content taught overall
4
Additionally, teaching statistical computing topics can been seen as a chicken and the egg
dilemma. Using technology to explore data and analyze data is one of the six recommendations of
the GAISE college standards for introductory statistics courses (American Statistical Association,
2005; American Statistical Association, 2016). However, the same reports also caution about
introducing higher level technologies - those normally seen in statistical computing courses - too
early. While these tools are powerful, they may confuse students and may be more of a hindrance
than help. This raises the question of when and how statistical computing should be taught when
students need to learn the technology. An answer to these questions may be found if we can
determine if and how a students’ use of statistical computing technology is related to how students
think and reason statistically.
Thus, this research aim is to develop a better understanding of the ways in which statistical
computing affects a student’s ability to think and reason statistically, and how a student’s ability
to think and reason statistically may affect their use of statistical computing to solve statistical
problems.
Research Questions
Through this research, the aim is to determine if there is a relationship between a student’s
statistical thinking and statistical computing abilities and being to develop a description of the
relationship that exists between statistical thinking and statistical computing. The main research
questions can be summarized as:
What are the ways in which statistical thinking and statistical computing may be related to each other, including the ways in which the two items help and hinder
5
In what ways are statistical computing techniques used by students in a problem solving setting and how do differences in statistical computing sophistication affect
students’ abilities to solve statistical problems with statistical computing
technologies?
Organization of the Document
In Chapter 2, the reader will find a literature review where statistical thinking and
computing are defined and a framework for identification is made. In Chapter 3, a description of
the study design and methodology is given. Chapters 4 through 7 contain manuscripts that are to
be submitted to reputable journals in statistics education. Specifically, Chapter 4 discusses the
benefits of using written work to assess students’ statistical thinking and gives a structure to assist
students in writing statistical arguments. Chapter 5 begins to define the relationship observed
between statistical thinking and statistical computing in students’ written work. Chapter 6 shows
how students use statistical computing in problem solving. A discussion and conclusion of all work
6
Chapter 2: Literature Review and Theoretical Framework
Being able to think and reason statistically are two important outcomes of any statistics
class. The GAISE college report identifies “emphasizing statistical literacy and developing
statistical thinking” (American Statistical Association, 2005; American Statistical Association,
2016) as its first of six recommendations for college statistics courses. Many statistics teachers
would probably agree that one of the main goals of their course has been accomplished when
students are able to demonstrate higher levels of statistical thinking and reasoning.
While we can agree that we want our students to think and reason statistically, this may
look different depending on who you ask. Several statistics education researchers have attempted
to define statistical thinking and reasoning, leading to a mass of definitions, yet little consensus on
the proper meanings.
Statistical Reasoning
While thinking and reasoning normally go hand-in-hand, these two terms do not mean the
same thing (Garfield & Ben-Zvi, 2008). Reasoning is a specific form of thinking that is aimed at
reaching justifiable conclusions. This can include logical reasoning, scientific reasoning or moral
reasoning (Barrouillet & Gauffroy, 2013).
In a somewhat broad sense, statistical reasoning is “the way people reason for statistical
ideas and make sense of statistical information” (Ben-Zvi & Garfield, 2004, p. 42). This could
include connecting statistical concepts to justify patterns observed in the data, combining ideas of
data and chance, understanding and being able to explain statistical processes, accurately
interpreting results of statistical studies (Garfield & Ben-Zvi, 2008) making predictions from the
7
key ideas for statistical reasoning are that students can explain why and explain how different
statistical concepts work (Garfield & Ben-Zvi, 2008).
The current research on statistical reasoning focuses on either developing or assessing
student’s reasoning ability for given statistical topics. For example, some of these topics include
students’ reasoning about data (Chinn & Brewer, 2001; Lee H. S., et al., 2014) students reasoning
about samples or sampling distributions (Ainley, Gould, & Pratt, 2015; Garfield, delMas, &
Zieffler, 2012) students’ reasoning about distributions and variation (Reading & Reid, 2006) and
students’ reasoning about inference (Zieffler, Garfield, delMas, & Reading, 2008).
A common theme of the above cited research is that the authors use statistical technology
meant for teaching statistics, to either help develop or assess their students’ statistical reasoning.
As will be described in more detail below, technology can be very helpful to aid in student learning.
It helps to automate procedures which could reduce cognitive load (Baglin, 2013; Biehler,
Ben-Zvi, Bakker, & Makar, 2012) so the student can focus on recognizing patterns that emerge and
making decisions about statistical tests instead of spending their mental energy on creating graphs
and summaries. The technology can open the door for students to think about data and chance in
new ways, for example, by helping them to present the data in different ways (Lee, et al., 2014) or
allowing them to explore new methods for conducting inference (delMas, Garfield, & Chance,
1999). Part of this research study will be to determine if tools meant for doing statistics provide
the same affordances to students.
Statistical Thinking
Again, while there is no consensus on what statistical thinking and reasoning are, this
author believes that statistical reasoning is a subset of statistical thinking. As defined above,
8
beyond the depth of knowledge that is required for statistical reasoning. In essence, a person who
can reason statistically understands which formulas to use, how to use those formulas, and why
they should use it. A statistical thinker could do all this and also potentially find new directions
for the analysis or find new meanings within the given data set.
In general, thinking can be defined as using one’s knowledge and ability to coordinate that
knowledge to answer questions, make judgement calls and plan procedures (Barrouillet &
Gauffroy, 2013). This means that thinking can take on several forms, such as problem solving,
decision making, judgment and planning. Hence someone who exhibits statistical thinking might
be more specifically defined as one who uses data to solve problems, make decisions and
judgements or plan an analysis.
Similar to definitions of statistical reasoning, Ben-Zvi and Garfield define statistical
thinking as “an understanding of why and how statistical investigations are conducted and the big
ideas that underlie statistical investigations” (Ben-Zvi & Garfield, 2004, p. 7). Chance adds to this
that a statistical thinker can apply concepts they have learned in a course to other situations and
are likely to use their knowledge to question or investigate issues they encounter (Chance, 2002).
In more detail, Wild and Pfannkuch (1999) describe a framework to be used as a tool in
organizing the different dimensions of statistical thinking. One of the dimensions of the framework
defines five types of thinking that are fundamental to statistical thinking. These will be used to
identify statistical thinking and reasoning in this research and are described in more detail below.
Recognizing the need for data. The first fundamental type of thinking is that, in doing analyses, one needs to recognize the need for data. One way that this could apply is to have students
include a statement about their data in justifying the results that they have found. In their
9
should make statistical inference statements as “Probabilistic – Generalization – From data”. The
authors don’t consider a given conclusion complete unless the student includes a statement about
data that was used.
Another way that this could apply is that students recognize that data they are using was
properly collected, by including some element of randomization (Ben-Zvi & Garfield, 2004).
Students need to be skeptical about how data was collected (Chance, 2002). Thinking about how
the data was obtained and ensuring no bias exists in the data, is important to ensure that proper
conclusions can be made. Evidence based on personal experience can also lead to poor decisions
(American Statistical Association, 2016). Students need to be aware that anecdotal evidence is not
enough to make proper statistical inference (Moore, 1990). Statistical decisions should be based
on purposefully collected data and not on speculative observations.
Transnumeration. The second type of statistical thinking (Wild & Pfannkuch, 1999) is transnumeration. Transnumeration is a student’s ability to recognize that different presentations of
data might tell a different story. Chance (2002) describes habits of mind of statistical thinkers, one
of which states that statistical thinkers are constantly thinking about the variables that are involved
in the study and they are curious of ways they can represent and visualize patterns in that data.
This means that exploratory data analysis (EDA) is extremely important for statistical
thinkers. Ben-Zvi believes that EDA is not just a set of techniques that are taught to students, but
it is a tool for the students to use, to help them explore and make sense of the data. Proper
exploratory data analysis goes beyond a surface understanding of the data. This process is meant
to give a statistician a preliminary understanding of what they might find if they dig deeper into
10
isn’t always easy, as finding and describing patterns in the data can take a high level of abstraction
(delMas R. , 2004).
Lee et al. (2014) attempted to describe elements of transnumeration that pre-service
teachers exhibit when analyzing data. They found that this may include making different graphical
displays for the same set of data - such as comparing the output for both a dot plot and a box plot,
using different bin widths in a histogram to tell a different story, or using multiple graphs in a
dynamic software to demonstrate linking between variables. They also found that this can extend
beyond graphical presentations of data, such as creating statistical summaries or using the original
data table to find individuals who might not be conforming to the expectations the rest of the data
set adheres to.
Consideration of variation. The third type of statistical thinking (Wild & Pfannkuch, 1999) is knowing that variability is an inherent part of a statistical analysis. Good statistical
thinkers understand that all data collection involves variability (American Statistical Association,
2016). Whether this variability is because of individual differences, or if it is because of repeated
measures on the same individual, students need to recognize that variability exists in all data and
that it is natural (Moore, 1990). As an example, Pfannkuch and Wild (2004) discuss the importance
of identifying variability in data and making attempts to reduce or even eliminate it through
designing better experiments.
Being able to quantify and use the variability of the data is also an essential part of being a
good statistical thinker. According to the GAISE report “it is essential to work on the development
of skills that will allow students to think critically about … the quantification and explanation of
variability” (American Statistical Association, 2016, p. 13). Without this understanding of
11
understand (Chance, delMas, & Garfield, 2004). If a student cannot easily think or reason about
the variability of the data, then they will likely struggle to understand why specific models work
and why those models are appropriate for inference.
Reasoning with statistical models. The fourth element of statistical thinking (Wild & Pfannkuch, 1999) is knowing when and why it is appropriate to use a statistical model and the
consequences of using an incorrect model. According to McCullagh (2002), a statistical model is
a set of probability distributions. When conducting inference, traditional analysis is dependent on
defining the probability distribution that best models the data, when parameter values are assumed
true. For example, in a hypothesis test for a proportion, provided that certain conditions are met, a
normal distribution with mean 𝜋 and variance 𝜋∗(1−𝜋)𝑛 will approximately model the possible
sample proportions that may occur. However, students need to recognize that, among other things,
this model will only be a good fit for the data if a sample of size n is taken from a binomial
population with probability of success, 𝜋.
As George Box famously quoted, “essentially, all models are wrong, but some are useful.”
(Box & Draper, 1987). As a statistical thinker, it is up to the student to determine which model
should be used and whether the model they have chosen is appropriate (Chance, 2002; Garfield &
Ben-Zvi, 2008). To demonstrate, one might say for the example above that if the sample size is
large enough, a normal distribution is an appropriate model for the sampling distribution of the
sample proportion.
In addition to this, statistical thinkers must have a deep understanding of theories
underlying the statistical models they choose to use and understand any limitations the chosen
model might have for analysis (Garfield & Ben-Zvi, 2008). It is not enough for the students to just
12
to conduct inference. They should also understand the reasons why those conditions are in place
and the consequences of not meeting those conditions. For our example, if the sample size is not
large enough, then the central limit theorem doesn’t apply. The true sampling distribution that
models the data will be skewed, implying that a normal model would not be an appropriate fit for
the data. The consequences would be that any inference that is conducted using the normal model
is likely incorrect.
Integrating the statistical and contextual. The last type of thinking described by Wild and
Pfannkuch (1999) is being able to synthesize context clues from the problem with one’s own
statistical knowledge. The first reason that this is important is because by knowing the context of
the problem, students can then better plan the data collection and analysis (Garfield & Ben-Zvi,
2008). For example, when students are aware of the context of the problem, they may be better
aware of sources of variability that exist naturally in the data, and may be able to take steps to
reduce that variability in the analysis (Moore, 1990). It might also be the case that through
contextual knowledge the student knows the distribution of the population will be skewed,
implying that a large enough sample needs to be taken to ensure that the central limit theorem will
apply, yielding an approximately normal sampling distribution of the statistics.
The second reason that it is important for students to be able to synthesize context clues
from the problem with their own statistical knowledge, is that it helps them to make better
conclusions from the data (Wild & Pfannkuch, 1999). One of the habits of mind that a statistical
thinker should have is that they are continuously reminding themselves of the context of the data
so that they can give their final conclusions in the context of the problem, avoiding the meaningless
13
Table 2.1 gives a summary of the information presented on statistical thinking and
reasoning. Thinking and reasoning were defined separately above to give the reader a sense of the
types of outcomes that will be identified in student work throughout the research. However, a
distinction between the two will not be made when identifying them in the research artifacts.
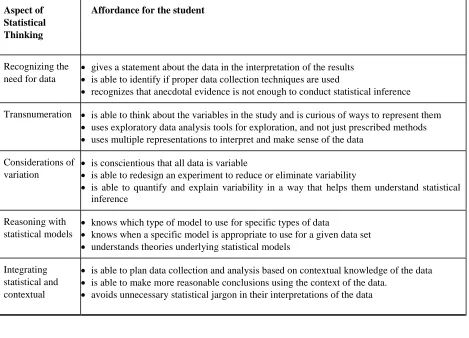
Table 2.1 Framework for identifying statistical thinking
Aspect of Statistical Thinking
Affordance for the student
Recognizing the need for data
gives a statement about the data in the interpretation of the results is able to identify if proper data collection techniques are used
recognizes that anecdotal evidence is not enough to conduct statistical inference Transnumeration is able to think about the variables in the study and is curious of ways to represent them
uses exploratory data analysis tools for exploration, and not just prescribed methods uses multiple representations to interpret and make sense of the data
Considerations of variation
is conscientious that all data is variable
is able to redesign an experiment to reduce or eliminate variability
is able to quantify and explain variability in a way that helps them understand statistical inference
Reasoning with statistical models
knows which type of model to use for specific types of data
knows when a specific model is appropriate to use for a given data set understands theories underlying statistical models
Integrating statistical and contextual
is able to plan data collection and analysis based on contextual knowledge of the data is able to make more reasonable conclusions using the context of the data.
avoids unnecessary statistical jargon in their interpretations of the data
Statistical Computing
Data science and statistical computing tools are no doubt becoming more common in the
statistics classroom (Horton, Baumer, & Wickham, 2014; Baumer, Cetinkaya-Rundel, Bray, Loi,
& Horton, 2014). While not everyone agrees on what precisely constitutes statistical computing -
14
agree that our students need to learn how to integrate computer science into the entire statistical
analysis process.
Some common themes occur in the literature of topics that could be covered in an
undergraduate level statistical computing course. These topics include graphical displays,
exploratory data analysis, data cleaning, non-parametric statistics including bootstrapping,
simulations, Markov chain Monte Carlo (MCMC) , the use of more than one language - such as
teaching students R, but supplementing with a secondary language such as SQL – and teaching
students presentation methods like LaTeX in R Markdown or HTML for web design (Dierker,
Kaparakis, Rose, Selya, & Beveridge, 2012; Gentleman, 2004; Hardin, et al., 2015; Monahan,
2004; Nolan & Temple Lang, 2010).
Suppose a statistician has been tasked with conducting a statistical analysis. If her only job
was to put the data into her favorite statistical programming package, run a few tests to find results,
then report those back to her employer, she really wouldn’t be doing statistical computing. The
use of the technology in this case is what Pea (1987) dubs an amplifier. The technology is being
used to simplify tasks, helping the statistician to use their time more efficiently. According to
Nolan and Temple Lang (2010), statistical computing is
about using the computer to make sense of data. It is inherently interactive, with
the next step determined dynamically by the content we see in the previous
steps. It is the tightly coupled combination of programming, visualization and
statistical reasoning (p. 5).
Suppose instead our statistician did the following. First, she went to a website and scraped
the data she needed, using data mining tools. Then upon inspection of her results, she realized the
15
SQL - to clean and sort the data for relevant information. Next she explored the data through
graphical displays to find patterns or points of concern which helped her determine the type of
statistical test she was going to use in her analysis, and if conditions for inference for that test were
met. Next, she used the technology to crunch the numbers and find an answer for her problem.
During the analysis, she saw that data she collected behaved differently over time, so she decided
to create an interactive presentation of the results on a webpage that helped to demonstrate this.
We can see that this process is much different than the first one given above. This statistician is
engaging in statistical computing.
Every one of these steps is not necessary to be considered as doing statistical computing.
However, statistical computing is not just about using a computer to get the answer to a statistical
problem. Statistical computing is the integration of technology into all steps of a statistical
analysis, from data collection to presentation. As we saw above, this could include data mining,
data cleaning, exploratory data analysis, statistical analysis and presentation of results.
Affordances of statistical computing. The main advantage that students probably recognize about taking a statistical computing course is that the use of statistical computing skills
has become more prevalent in the work force. In their paper, Hardin et al. (2015) speak of several
students who had written to their professors after graduating and telling them the usefulness of the
statistical computing course they had taken. This is no wonder, since students graduating at the
Bachelor's and Master’s level spend much of their time in the workforce using skills like
“retrieving, filtering and cleaning data and doing initial exploratory data analysis” (Nolan &
Temple Lang, 2010, p. 4)
Phillip, Schuler-Brown and Way (2013) note that while it is becoming more and more
16
such a way limits other important goals that students might have when obtaining a higher
education, such as intellectual, social, civic, ethical and aesthetic reasons.
In particular, students can benefit intellectually from taking a statistical computing course.
While, statistics and computer science are different fields, they both require many of the same
skills for a student to be successful, such as logic and abstraction (Wing, 2008; delMas R. , 2004)
and both help their students to develop these skills. Some researchers have found (Kafura, Bart, &
Chowdhury, 2015; Yuen & Robbins, 2014) that when students not majoring in computer science
or statistics learned computing with a statistical context, both their computational and statistical
thinking grew and supported the other. In particular “programming assists students in
understanding how data is organized, structured, and presented so that they can accurately analyze
it in both numeric and graphical form” (Yuen & Robbins, 2014, p. 14) while the “quantitative
concepts were also developing their programming skills”.
One major reason that researchers have found to support students learning statistical
computing is that (if done properly) it automates computational procedures and helps to reduce the
cognitive load on the student (Baglin, 2013). “Attention to key statistical concepts seems to be
easier if the cognitive load required for computation and graph drawing is minimized by software”
(Biehler, Ben-Zvi, Bakker, & Makar, 2012, p. 680). Students can more easily explore trends in the
data (exploratory data analysis) when they aren’t worried about the nuances of how a graph is
drawn. Or they can spend more time interpreting and understanding why the results of a statistical
study make sense since they haven’t spent all their cognitive capacity trying to manually compute
the results of that analysis.
The second major benefit of studying statistical computing is increased computational
17
scientific and engineering thinking that is not constrained by the bounds of reality. It allows one
to think critically and abstractly about real world problems, while allowing for the use of the almost
infinite power of the computer to solve problems that might not otherwise have solutions strategies
in the real world. A person that can think computationally has problem solving skills that allow
them to formulate a solution strategy which is then conveyed to a computer, telling it how to
implement the given strategy (Wolfram, 2016).
Another advantage to using technology in a statistics classroom is that it offers alternate
techniques to solving problems than have been unavailable in the past. For example, using
simulation-based methods for developing distributions and solving statistical inference problems
has recently become a popular teaching technique (delMas, Garfield, & Chance, 1999; Garfield,
delMas, & Zieffler, 2012; Holcomb, Chance, Tietjen, & Cobb, 2010; Lane-Getaz, 2010; Tintle,
VanderStoep, Holmes, Quisenberry, & Swanson, 2011). A major advantage to this type of analysis
is that students don’t have to have an in depth understanding of the properties of distributions, such
as the normal distribution (Pfannkuch, et al., 2011). Instead, students conceptualize the idea of
what would my statistics look like if we could repeat this process several times?; a concept that is
foundational for several topics in statistics, including sampling distributions, confidence intervals
and hypothesis testing. Instead of spending time teaching students how to read a normal
distribution table, they are using software to generate p-values and explore the idea of “extreme”
statistics.
One example of this is the CATALST program (Garfield, delMas, & Zieffler, 2012). The
goal of the program was to make sure that students learning statistics didn’t see it as a “cookbook”
of procedures to be followed. By the end of the course, the researchers wanted their students to
18
who is simply following a statistical recipe that their instructor gave them. The authors found
positive results for their program and noted that students’ reasoning about statistics was on par
with students who had taken a traditional introductory statistics course.
The final benefit of utilizing statistical computing is learning multiple programming
languages or programming tools. Ideally, this would help students to perform the different tasks
of statistical computing that they are expected to do in order to conduct a complete statistical
analysis, such as data collection, data cleaning, analysis and presentation. In addition to the
practical applications of learning multiple languages and tools, students may also develop decision
making skills so that they know which of these tools is best for solving different aspects of their
statistical problem (Nolan & Temple Lang, 2010). Brown and Kass (2009) claim that success in
statistics requires that students have adaptable strategies for solving problems but that our students
have a tendency to “attack problems using blunt instruments and naïve attitudes” (p. 105). By
teaching statistical computing to our students, we hopefully give them sharp tools and the
knowledge of when to use them.
Learning multiple programming languages could also help students develop pattern
recognition skills. Nolan and Temple Lang (2010) argue that the main goal in teaching
programming is for students to be able to extract concepts from a specific problem and transfer
concepts to the specifics of other languages and environments. When programming languages are
taught together, students can see the patterns that emerge between them and get a better
understanding of programming as a general concept instead of the idiosyncrasies of individual
languages. Even when students only learn one language, developing code based on examples can
19
In summary, learning statistical computing provides students with the opportunities to
increase their knowledge of the tools and become more proficient statisticians in the real world.
Students can use their knowledge of statistical computing tools to efficiently create graphs and
summaries of their data. In doing this, they have more cognitive capacity to spend on discerning
patterns they observe or understanding concepts they are trying to grasp. Additionally, learning
statistical computing may impact one’s computational thinking which could in turn improve the
student’s problem solving skills, their logic and reasoning skills and their sophistication to think
critically and abstractly. Finally, the technology could be used to implement new or multiple
statistical analyses, allowing the student different perspectives on statistical concepts.
Table 2.2 synthesizes the information described in this section. Based on the research that
has been done, these are believed to be the primary elements of the affordances that statistical
computing has to offer students, in terms of intellectual benefits.
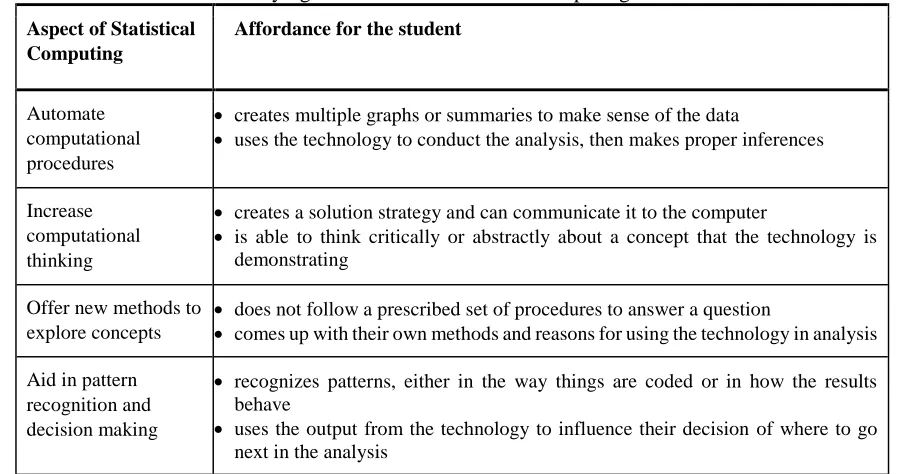
Table 2.2 Framework for identifying the benefits of statistical computing
Aspect of Statistical Computing
Affordance for the student
Automate computational procedures
creates multiple graphs or summaries to make sense of the data
uses the technology to conduct the analysis, then makes proper inferences
Increase computational thinking
creates a solution strategy and can communicate it to the computer
is able to think critically or abstractly about a concept that the technology is demonstrating
Offer new methods to explore concepts
does not follow a prescribed set of procedures to answer a question
comes up with their own methods and reasons for using the technology in analysis Aid in pattern
recognition and decision making
recognizes patterns, either in the way things are coded or in how the results behave
20
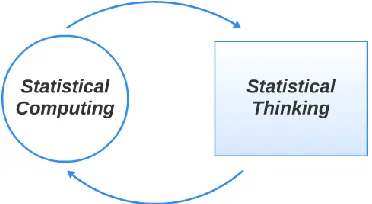
It is believed that there is a symbiotic relationship between a student’s ability to think and
reason statistically and their use of statistical computing benefits (Figure 2.1). This paper will
explore this relationship in more detail and describe some potential implications of relationships
that have been observed.
Figure 2.1 Proposed relationship between statistical thinking and statistical computing
Assessing Statistical Thinking and Statistical Computing
Now that a framework has been given to identify statistical thinking and statistical
computing, a medium for students to present these constructs is needed. Structured written
assessments may be useful in helping students demonstrate their statistical thinking and statistical
computing.
Keys (1994) found that scaffolding written reports for students helped them to focus their
thinking on pertinent information. A popular example of structuring a response comes from
Toulmin’s (1958) model for argumentation, originally used to aid in creating verbal arguments for
ill-structured problems (Karbach, 1987). Inglis, Mejia-Ramos and Simpson (2007) discuss several
studies in which college mathematics students were expected to use Toulmin’s model, or a
modification of it, in order to create well defined mathematical arguments.
Toulmin’s model for argumentation directs users to create persuasive arguments by:
21
Identifying the data that supports the claim; and Backing the claim with warrants
If needed, the argument can also be enhanced by:
Providing backing for the warrants;
Identifying qualifiers to support the strength of the relationships; and
Providing a rebuttal indicating circumstances where the argument may not be true
(Toulmin, 1958).
To assist introductory statistics students in writing complete arguments and help them to better
convey their reasoning, Woodard (2016) suggested teaching students a similar four element model,
dubbed the four sentence structure. The four sentence structure directs students to:
Answer the question;
State relevant facts from the problem;
State the implications that the facts imply; and Explain how the facts lead to the conclusion.
In relation to Toulmin’s model, answering the question is similar to stating the claim and
stating relevant facts is similar to identifying data to support the claim. Stating the implications
that the facts imply doesn’t translate directly to one of the items in Toulmin’s model. Instead this
element combines both supporting claims with warrants and providing backing for the warrants.
Finally, depending on how a students has answered the question, explaining how the facts lead to
the conclusion could be similar to providing more backing for the claim, restating the original
claim or it may not translate to any of the elements in Toulmin’s argumentation model (1958).
Problem Solving Methods
Another part of this research examines how students utilize statistical computing
22
solving will be necessary. Several authors have proposed methods for problem solving structures
in mathematics, and how these methods can be used to help conduct research on students’ ability
to solve problems.
As one example, Schoenfeld (1985) described the knowledge and behavior necessary to
adequately characterize students’ mathematical problem-solving performance. This included
knowledge of four items: resources, heuristics, control, and belief systems. Resources include
knowing the facts, procedures, skills and algorithms that students possesses and bring to the table
when they start solving the problem. Schoenfeld discusses that when we know, as researchers,
what our students know about a problem, it helps us to better understand the strategies they use to
solve the problem.
The second item defined by Schoenfeld (1985) are heuristics, or rules that help students to
solve problems. One example of a heuristic is Polya’s (1957) four step process for problem
solving. These steps include the student understanding the problem, devising a plan, carrying out
the plan and looking back at what they have done to check their solution. Knowing a strategy such
as this one can help students to make progress on a problem, even if they don’t possess all of the
necessary resources to solve the problem.
Third, Schoenfeld (1985) discusses the need to understand the student’s control of the
problem. Control is the way a student chooses to use the resources and heuristics that they have
to solve the problem. Each time a student makes a major decision about how to solve the problem
or the resources they should use, they are showing their control of the problem.
Finally, according to Schoenfeld, a student’s beliefs system plays a role in how students
23
context may influence how they perceive the problem should be solved. This can happen even
without the student being aware of it.
Lee and Hollebrands (2006) expanded on the work of Schoenfeld (1985) and defined a
framework that helps classify students’ problem solving behaviors in the context of a technological
task. The phases in this structure include analysis, planning, implementation, assessment,
verification and organization. Definitions of these items can be found in Figure 2.2.
Figure 2.2 Phases of problem solving
Lee and Hollebrands (2006) originally used this structure to analyze how students solve a
proportional reasoning problem using technology. The researchers had students working in pairs
to solve a problem about placing a set number of fish to three different ponds, with constraints on
the proportion of each type of fish that went into the different ponds. The researchers used the
framework to classify the ways in which students solved the problem.
Even though the focus of this work is not proportional reasoning, students will use
technology to help them solve a statistics problem. This framework has been tested and has been
24
seems reasonable to assume that this structure should aid in assessing the problem solving
25
Chapter 3: Methodology Study design
To determine how statistical thinking and statistical computing impact each other, a
small-scale, two-phase qualitative research study was conducted. According to Groth (2010), if done
appropriately, qualitative research can be scientific, rigorous, generalizable and objective, and can
“provide a means for conducting scientific studies that contribute to our understanding of statistics
teaching and learning”. The first phase of the study involved collecting artifacts from students
while they were taking a second course in statistics. The second phase of the study involved
conducting task-based interviews with students who had completed the second course in statistics.
Quantitative methods, specifically traditional regression analyses, were not appropriate for
this research. Because of the small sample of students used in the study, and potential correlation
within and between subjects, conducting an effective quantitative analysis would have been
difficult. More importantly though, this research is meant to be exploratory and descriptive in
nature. This is why the researcher has chosen to conduct a qualitative analysis.
Participants
Participants for this study came from a small private women’s college in the southeastern
United States. During the fall semester of 2016, fifteen students began a second course in statistics
with the primary investigator. Fourteen of these students finished the course and volunteered to
participate in this study.
Statistics 2 is a continuation of introductory statistics. It includes topics of one and 2 sample
inference, two way tables, simple and multiple linear regression and one and two factor ANOVA.
Students were also taught introductory statistical computing practices in R while taking this course.
While the only prerequisite course for statistics two was introductory statistics, the
26
introductory statistics course, while some had taken a course in probability theory or statistical
computing. Six students had experience with programming before taking the course, through a
statistical computing course offered the previous semester. In addition, two participants were
majoring in computer science.
Data Sources
According to Creswell, multiple forms of data should be collected and themes across the
different types of data should be used to perform a qualitative analysis properly (Creswell, 2013).
Because of this, data for this research was collected from four primary sources. These sources are
teacher field notes, a demographic survey, writing assignments and a task-based interview. More
information about these data sources is described below.
Data for this study was collected during two semesters, fall 2016 and early spring 2017. As
part of the requirements of the statistics 2 course, students were responsible for completing several
writing assignments. Additionally, students who completed the course and were not taking any
courses with the primary researcher in the spring of 2017 were asked to participate in a task-based
interview in January of 2017. Five students volunteered for these interviews, 2 of whom had taken
the statistical computing course previously and 3 that had not.
Field Notes. Field notes were kept so that there was a record of conversations, where students discussed with their classmates or with the instructor, ideas that demonstrate statistical
computing or statistical thinking. For example, in-class group work was one of the modes of
instruction in the course. To find appropriate solutions for many of the group-work problems,
students needed to use the computer and were encouraged to share their thinking with their group
mates. As the instructor walked around the classroom assisting groups, she took notes about the
student’s discussions. In addition, when students came to the instructor’s office for additional help,
27
Demographic Survey. Students in the second course in statistics completed a survey to determine their statistical and computational background. The survey can be found in Appendix
C. The primary purpose of the survey is to determine differences in student’s backgrounds in both
statistics and computer science.
Writing Assignments. One of the primary source of data for this research were writing assignments. Throughout the course, students completed a total of ten individual writing
assignments utilizing the four sentence structure created by Woodard (2016). In this structure,
which will be described in more detail in Chapter 4, students were directed to write about solutions
to statistical problems by:
Answering the question;
Stating relevant facts from the problem;
Stating the implications that the facts imply; and Explaining how the facts led to the conclusion.
Seven of the ten assignments were used for the purposes of this research. These
assignments gave students the opportunity to demonstrate their statistical computing, while
encouraging them to explain their statistical thinking and reasoning. The assignments not used for
research were necessary for assessment in the course but did not give the students a potential
medium for demonstrating statistical thinking and statistical computing. In total, 91 documents
were collected from students. All writing assignments utilized in the course can be found in
Appendix A.
The general strategy of the writing assignment was to have students make a decision about
a scenario using data that was provided for them. To assist students in giving reasonable responses,
Chance (1997) believes that students need to be given enough direction to complete the
28
gave them guidance as to how to write the second assignment. Students wrote their responses
individually starting with the third assignment.
Most of the assignments necessitated the use of the computer to give a reasonable solution.
This was done to assess if students recognized the need for data when providing responses to the
prompt, one of the five elements of statistical thinking (Wild & Pfannkuch, 1999). Jolliffe (2007)
believes that pairing written work with computational output provides a reasonable tool for
assessment. While not all students will obtain the same results students could obtain the same
output from the computer. When students are expected to interpret the output, we add another layer
of differentiation that can be used to assess differences in student understanding.
While the structure of the assignments stayed the same, the purpose of the assignments
varied over the semester which provided the opportunity to assess different types of statistical
thinking while maintaining a certain consistency for the students. For example, some assignments
called for students recognizing the need to use the data provided as opposed to their intuition to
create an appropriate model for prediction (American Statistical Association, 2016; American
Statistical Association, 2005; Wild & Pfannkuch, 1999). Other assignments asked student to
determine if a proposed method was valid when, unbeknownst to the students, the method utilized
a common misconception in statistics (Rossman & Chance, 2004). Other assignments included
creating a simulation to answer the question (Tintle, et al., 2015) or critiquing the work of another
individual to determine if that individual had correct thinking (Rossman & Chance, 2004).
Task-based Interviews. The fourth source of data that was used were task-based interviews. Task-based interviews are structured or semi-structured interviews where students are
expected to complete a task and explain their thinking while doing so (Koichu & Harel, 2007).
29
solve problems and they can help researchers form conjectures about students’ content knowledge
and the ways in which they think about and solve problems (Goldin, 1997; Koichu & Harel, 2007).
Before conducting interviews with students from the fall 2016 statistics 2 course, a pilot
interview was conducted with a student who had completed statistics 2 prior to taking statistical
computing in the spring of 2016. Information collected from this interview was used to modify the
interview protocol. Conducting a pilot interview is also helpful in training the researcher to conduct
the interviews appropriately for the primary analysis (Nguyen, McFadden, Tangen, & Beutel,
2013).
In the spring of 2017, students who had taken the statistics 2 course and who were not
taking any other courses with the primary investigator were asked to participate in the task-based
interviews. 5 students volunteered to take part in the interviews. These interviews lasted for
approximately 45 minutes to an hour. Students completed these interviews individually. The
interview was set up in three phases. Each of these phases allowed students to demonstrate their
statistical computing and statistical reasoning ability in different ways.
The interview protocol can be viewed in Appendix B. The intended purpose of phase 1 of
the interview was to have students use the computer to see if they understood the conditions and
reasoning for doing a one-way ANOVA test. Several of the questions that were asked in this
section were intended to allow students to elaborate more on the knowledge of why we do certain
procedures in a statistical test, which can be a good measure of a student’s statistical thinking and
reasoning (Wild & Pfannkuch, 1999). The students were also asked to use the computer to “do a
full statistical analysis” meaning that they were encouraged to use the computer for exploratory
data analysis, statistical analysis and interpretation instead of just using the computer to conduct
30
In phase 2 of the interview, students were given a question that was similar to the format
of the writing assignments they had been given in class. As they were formulating their argument,
students were given the chance to discuss their thoughts about the problem, as students may have
difficulty putting their reasoning into words on paper, but may be able to verbalize it (Park, Park,
Lee, & Lee, 2016). Students were not required to write down their final solution, but they were
asked to verbalize all four parts of the four sentence structure after they had the chance to talk
through the problem on their own.
During this phase of the interview students were given computer output, which they needed
to utilize in order to answer the question properly. This question focused more on assessing the
student’s statistical thinking, as opposed to their statistical computing sophistication. However use
of the computer in the first phase of the interview may have made this process easier for the
student, as the two problems were related.
The third phase of the interview included questions about student’s thoughts in the
sequencing of the second course in statistics and the statistical computing course. Specifically,
students who had taken computing prior to the second course in statistics were asked if they felt
like having the extra experienced helped them to do well in statistics 2, and students who had not
taken computing were asked if they thought it would have helped them to do better in the course.
While the goal of this research is to focus on ways that statistical computing techniques can help
or hinder a student's ability to reason statistically, research has shown that student beliefs can also
play a role in how well they perform in a course (Gal, Ginsburg, & Schau, 1997; Gal, 2004).
Analysis
As described above, the goal of this research was to make sense of the phenomena that is