Validation of PHITS Spallation Models from the Perspective of
the Shielding Design of Transmutation Experimental Facility
Hiroki Iwamoto1,aand Shin-ichiro Meigo1,b
1J-PARC Center, Japan Atomic Energy Agency, 2-4, Shirakata, Tokai-mura, Naka-gun, Ibaraki 319-1195,
Japan
Abstract.The impact of different spallation models implemented in the particle transport code PHITS on the shielding design of Transmutation Experimental Facility is investi-gated. For 400-MeV proton incident on a lead-bismuth eutectic target, an effective dose rate at the end of a thick radiation shield (3-m-thick iron and 3-m-thick concrete) cal-culated by the Liège intranuclear cascade (INC) model version 4.6 (INCL4.6) coupled with the GEM code (INCL4.6/GEM) yields about twice as high as the Bertini INC model (Bertini/GEM). A comparison with experimental data for 500-MeV proton incident on a thick lead target suggest that the prediction accuracy of INCL4.6/GEM would be bet-ter than that of Bertini/GEM. In contrast, it is found that the dose rates in beam ducts in front of targets calculated by the INCL4.6/GEM are lower than those by the Bertini/GEM. Since both models underestimate the experimental results for neutron-production double-differential cross sections at 180◦for 140-MeV proton incident on carbon, iron, and gold targets, it is concluded that it is necessary to allow a margin for uncertainty caused by the spallation models, which is a factor of two, in estimating the dose rate induced by neutron streaming through a beam duct.
1 Introduction
To promote research, development, and demonstration of elemental technologies for accelerator-driven systems (ADS) [1–5], the Japan Atomic Energy Agency (JAEA) is planning to construct the Transmutation Experimental Facility (TEF) at J-PARC [6, 7]. In the construction of TEF, the Parti-cle and Heavy Iron Transport code System, PHITS [8], plays an important role in the design of TEF shielding. Since the development of PHITS version 2.52, the Liège intranuclear cascade (INC) model version 4.6 (INCL4.6 [9]) has been employed as a default spallation model for the INC calculation in PHITS instead of the Bertini INC model [10]. Although, within the framework of the International Atomic Energy Agency (IAEA) benchmark program [11], a benchmark survey of spallation models demonstrated that the INCL model was the most accurate, further validation is still required to employ the INCL4.6 implemented in PHITS for specific applications such as ADS (see Ref. [5]).
This study investigates the impact of different spallation models, i.e., INCL4.6 and Bertini INC, on the TEF shielding characteristics. Here, the Generalized Evaporation Model (GEM) code [12] was
employed for the de-excitation calculation following the intranuclear cascade calculation. Among various parameters on the shielding design such as effective dose rate, absorption dose rate, and ra-dioactivity, we focus on the effective dose rate for representative apparatuses arranged in TEF; (1) a lead-bismuth eutectic (LBE) target and (2) a 10-W beam dump for beam commissioning. Another purpose of this study is to validate these models by comparing with experimental results, which were not included in the IAEA benchmark, from the perspective of the TEF shielding design.
2 Outline of TEF and calculation conditions
TEF utilizes a 250-kW proton beam accelerated with a 400-MeV LINAC accelerator at J-PARC. The proton beam is injected to the LBE target, in which intense spallation neutrons are produced. Basic concept of the TEF shielding design is the same as existing spallation neutron source facilities such as JSNS [13] at J-PARC, namely, the LBE target is surrounded by iron blocks, and an ordinary concrete shield is arranged outside the iron shield. To utilize the proton beam for various reactor-physics experiments with a subcritical assembly in TEF, a proton beam with powers up to 10 W is extracted from the 250-kW proton beam, and the 10-W beam dump for beam commissioning is installed in the TEF facility. Since a proton-beam duct is attached to the upstream side of each apparatus, estimation of the dose rate by neutron streaming through the beam duct is of importance.
Main characteristics of the LBE target and the 10-W beam dump are listed in Tables 1 and 2, respectively.
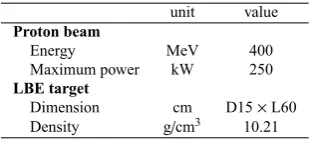
Table 1.Main characteristics of the LBE target.
unit value
Proton beam
Energy MeV 400
Maximum power kW 250
LBE target
Dimension cm D15×L60
Density g/cm3 10.21
Table 2.Main characteristics the 10-W beam dump.
unit value
Proton beam
Energy MeV 400
Maximum power W 10
Beam dump
Material — graphite, iron,
and ordinary concrete
Dimension cm 20×20×40 (graphite)
Beam duct
Material — titanium
Inner diameter cm 10
−800 −600 −400 −200 0 200 −600
−400 −200 0 200
z [cm] x [cm] LBE target
Proton beam window
Beam duct Air
Concrete Iron SUS316 void
Water-cooled shield A5083 LBE Iron(7.4) void Copper UC4 Lead
Figure 1.Calculation model of the LBE target.
−100 0 100
−100 0 100
z [cm]
x [cm]
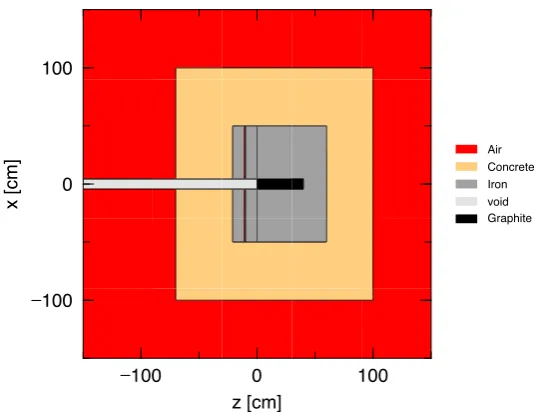
Air Concrete Iron void Graphite
Figure 2.Calculation model of the 10-W beam dump.
3 Results and discussion
3.1 LBE target
0 100 200 300 400 500 600 700
Distance from the center (cm)
10-2 1010-1 0 101 102 103 104 105 106 107 108 109 1010 1011 1012 1013
Dose
rate
(
μSv/hr)
25 μSv/hrIron
Concrete
INCL/GEM
n(thermal)n(0.4 eV-1 MeV)
n(> 1 MeV)
Sec.γ
Total
0 100 200 300 400 500 600 700
Distance from the center (cm)
10-2 1010-1 0 101 102 103 104 105 106 107 108 109 1010 1011 1012 1013 25 μSv/hr
Iron
Concrete
Bertini/GEM
n(thermal)n(0.4 eV-1 MeV)
n(> 1 MeV)
Sec.γ
Total
Figure 3.Effective dose rate in iron and concrete shields at 90◦from the beam direction.
10
-510
-410
-310
-210
-110
010
110
210
310
4Neutron energy (MeV)
10
-1010
-910
-810
-710
-610
-510
-410
-310
-210
-1Neutr
on
spectrum
(n/sr/pr
oton)
15◦60◦(×10−1)
90◦(×10−2)
120◦(×10−3)
180◦(×10−4)
INCL/GEM
Bertini/GEM
Figure 4.Neutron spectra produced from 400-MeV proton incident on the LBE target.
−700 −600 −500 −400 −300 −200 −100
Z (cm)
0
10
910
1010
1110
1210
1310
14Dose
rate
(
μ
Sv/hr)
En<10
MeV
En>10
MeV
Bertini/GEM,
En<10MeV
INCL/GEM,
En<10MeV
Bertini/GEM,
En>10MeV
INCL/GEM,
En>10MeV
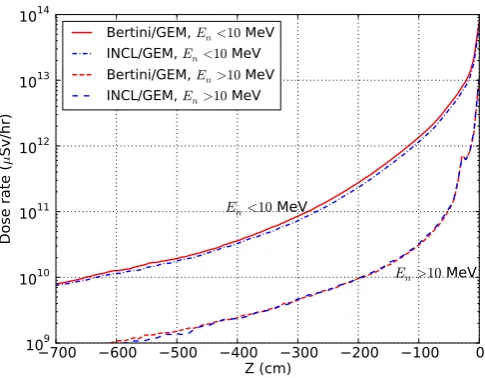
Figure 5.Effective dose rate at 180◦from the beam direction. The values of a coordinate on the horizontal axis are the same as those in Figure 1.
Figure 4 shows calculated neutron spectra produced from 400-MeV proton incident on the LBE target for angles of 15◦, 60◦, 90◦, 120◦, and 180◦. The INCL4.6/GEM gives higher neutron spectra than the Bertini/GEM for energies above 10 MeV. This is the reason for the higher dose estimation by INCL4.6/GEM in Fig. 3.
Figure 5 shows the effective dose rate at 180◦ from the beam direction. In contrast to the above results, the dose rate at 7 m away from the target calculated by the INCL4.6/GEM is slightly lower than that by the Bertini/GEM. This difference is attributable to the difference in low-energy neutrons produced from the LBE target (see Fig. 4).
3.2 Beam Dump
Figure 6 shows the effective dose rate around the beam dump for the beam direction. Figure 7 shows the double-differential cross sections at 180◦ for 400-MeV proton incident on a carbon target. As is the case with the LBE target, the INCL4.6/GEM gives lower values than the Bertini/GEM at the backward direction, which is due to the difference in neutron spectra for energies below 10 MeV as shown in Fig. 7.
3.3 Validation
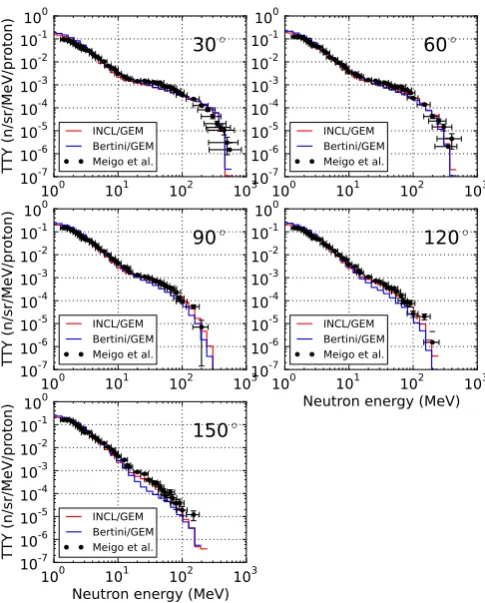
Figure 8 compares the thick target neutron yield for 500-MeV protons on a 20-cm-thick lead target. Here, the experimental data are taken from Ref. [16]. INCL4.6/GEM is better suited for the spectral shape, whose prediction is within 1σexperimental uncertainty over a wide energy range, whereas the Bertini/GEM underestimates the experiments for angles from 90◦to 150◦.
−150
−100
Z (cm)
−50
0
50
10
510
610
710
810
910
10Dose
rate
(
μ
Sv/hr)
En<10
MeV
En>10
MeV
Beam duct Graphite Fe
INCL/GEM,
En<10MeV
Bertini/GEM,
En<10MeV
INCL/GEM,
En>10MeV
Bertini/GEM,
En>10MeV
Figure 6.Effective dose rate around the beam dump for the beam directions. The values of a coordinate on the horizontal axis are the same as those in Figure 2.
10
010
110
2Neutron energy (MeV)
10
-410
-310
-210
-110
010
110
210
3DDX
(mb/sr/MeV)
180
◦Carbon
INCL/GEM Bertini/GEM
Figure 7.Double-differential cross sections at 180◦for 400-MeV proton incident on a carbon target.
100 101 102 103 10-7 10-6 10-5 10-4 10-3 10-2 10-1 100 TT Y (n/sr/MeV/pr
oton) 30◦
INCL/GEM Bertini/GEM Meigo et al.
100 101 102 103
10-7 10-6 10-5 10-4 10-3 10-2 10-1 100 60◦ INCL/GEM Bertini/GEM Meigo et al.
100 101 102 103
10-7 10-6 10-5 10-4 10-3 10-2 10-1 100 TT Y (n/sr/MeV/pr
oton) 90◦
INCL/GEM Bertini/GEM Meigo et al.
100 101 102 103
Neutron energy (MeV)
10-7 10-6 10-5 10-4 10-3 10-2 10-1 100 120◦ INCL/GEM Bertini/GEM Meigo et al.
100 101 102 103
Neutron energy (MeV)
10-7 10-6 10-5 10-4 10-3 10-2 10-1 100 TT Y (n/sr/MeV/pr
oton) 150◦
INCL/GEM Bertini/GEM Meigo et al.
Figure 8.Comparison of thick target neutron yield for 500-MeV protons on 20-cm-thick lead.
process, the results indicate that modification or improvement of the de-excitation model, GEM, will be necessary.
4 Conclusion
10
010
110
20.0
0.2
0.4
0.6
0.8
1.0
DDX
(mb/sr/MeV)
Carbon
INCL/GEM Bertini/GEM Iwamoto et al.10
0 010
110
25 10 15 20 25 30
Iron
INCL/GEM Bertini/GEM Iwamoto et al.10
0 010
110
250 100 150 200 250
Gold
INCL/GEM Bertini/GEM Iwamoto et al.10
010
110
2Neutron energy (MeV)
10
-410
-310
-210
10
-1 010
110
210
3DDX
(mb/sr/MeV)
INCL/GEM Bertini/GEM Iwamoto et al.10
010
110
2Neutron energy (MeV)
10-3 10-2 1010-1 0 101 102 103 104 INCL/GEM Bertini/GEM Iwamoto et al.
10
010
110
2Neutron energy (MeV)
10-2 1010-1 0 101 102 103 104 105 INCL/GEM Bertini/GEM Iwamoto et al.
Figure 9.Comparison of double-differential cross sections at 180◦for 140-MeV proton incident on carbon, iron, and gold targets. Upper and lower panels indicate linear and logarithmic scales on the vertical axis, respectively.
that uncertainty in the effective dose rate at the 180◦direction induced by spallation models would be within a factor of two. Therefore, in calculating the dose rate by backscattered neutrons, a mar-gin of this uncertainty should be considered. Thus, the PHITS spallation models still have room for improvement especially for neutron emissions at the backward angles. To achieve more reliable dose estimation, systematic experiments on the backward neutron data is needed.
References
[1] K. Tsujimotoet al., Nuclear Technology161, 315–328 (2008)
[2] K. Nishiharaet al., Journal of Nuclear Science and Technology45, 812–822 (2008) [3] T. Sugawaraet al., Journal of Nuclear Science and Technology47, 953–962 (2008) [4] H. Iwamotoet al., Journal of Nuclear Science and Technology50, 856–862 (2013) [5] H. Iwamotoet al., Journal of Nuclear Science and Technology53, 1585–1594 (2016) [6] K. Tsujimotoet al., Journal of Nuclear Science and Technology44, 483–490 (2007) [7] T. Sasa and H. Oigawa, Plasma and Fusion Research9, 4401113 (2014)
[8] T. Satoet al., Journal of Nuclear Science and Technology50, 913–923 (2013) [9] A. Boudardet al., Physical Review C87, 014606 (2013)
[10] H. W. Bertini, Physical Review131, 1801–1821 (1963)
[12] S. Furihata, Nuclear Instruments and Methods in Physics Research, Section B171, 251–258 (2000)
[13] F. Maekawaet al., Nuclear Instruments and Materials in Physics Research, Section A620, 259– 265 (2010)
[14] K. Shibataet al., Journal of Nuclear Science and Technology48, 1–30 (2011)
[15] Y. Sakamotoet al.,Dose conversion coefficients for high-energy photons, electrons and protons
(Japan Atomic Energy Research Institute, Tokai, 2003) JAERI-1345
[16] S. Meigoet al., Nuclear Instruments and Methods in Physics Research, Section A431, 521–530 (1999)