Electronic Thesis and Dissertation Repository
9-13-2013 12:00 AM
Does incremental training improve motor learning?
Does incremental training improve motor learning?
Alvin Chin
The University of Western Ontario
Supervisor Paul Gribble
The University of Western Ontario Graduate Program in Neuroscience
A thesis submitted in partial fulfillment of the requirements for the degree in Master of Science © Alvin Chin 2013
Follow this and additional works at: https://ir.lib.uwo.ca/etd
Recommended Citation Recommended Citation
Chin, Alvin, "Does incremental training improve motor learning?" (2013). Electronic Thesis and Dissertation Repository. 1676.
https://ir.lib.uwo.ca/etd/1676
This Dissertation/Thesis is brought to you for free and open access by Scholarship@Western. It has been accepted for inclusion in Electronic Thesis and Dissertation Repository by an authorized administrator of
by
Alvin Chin
Graduate Program in Neuroscience
A thesis submitted in partial fulfillment of the requirements for the degree of Master
of Science
School of Graduate and Postdoctoral Studies
Western University
London, Ontario, Canada
c
In previous years, there has been a multitude of research on motor learning. However,
little research has been done to examine the possibility of altering the rate of learning
and performance by modification of the task. In this study, we were interested in
in-vestigating the effects of learning a complex task with a gradual increase in difficulty.
Subjects performed a mirror drawing task with a robotic manipulandum. Subjects
were randomly placed into one of four groups. [Complete] group subjects received the
most difficult form of the task from the beginning and trained and tested on the same
shape (a 5-pointed star). [Gradual] group subjects gradually progressed through
‘lev-els’ that increased in difficulty before reaching the [Complete] group star.
[Gradual-Rotated] group subjects received a similar paradigm to [Gradual] group subjects,
only their training levels were rotated 30 degrees. [Complete-Rotated] group subjects
trained on a rotated version of the [Complete] group star. [Complete] group subjects
demonstrated significantly better initial performance on the star shape when
com-pared to the [Gradual] and [Gradual-Rotated] groups. [Gradual], [Gradual-Rotated],
and [Complete-Rotated] groups initially performed at lower errors on their
respec-tive tasks when compared to the [Complete] group. We demonstrate that the novel
paradigm that we introduce to subjects successfully lowered initial performance error.
However, in this specific task, immediate introduction of the final shape proved to
result in better early performance. All subjects performed at equal levels at the end
of training. We are interested in the application of this training paradigm to various
other tasks.
motor learning, gradient descent, arm movements, robotic manipulandum, human
H McGregor assisted in analyses.
JD Wong assisted in experimental design, thesis formatting, and analyses.
PL Gribble assisted in experimental design, analyses, and manuscript revision.
I would like to express my utmost thanks and gratitude to Paul Gribble for being
an amazing supervisor and mentor. Thank you for the opportunities and support
you have provided me in the past 3 years. Thanks to Jeremy Wong for continuing
guidance and wisdom throughout my time in the lab. Thanks to Heather McGregor
for her ability to maintain a level of excitement and entertainment in the lab, and for
her patient support through everything. And finally, special mentions go out to Dan
Huynh and Eric Rocca, the two most recent members of the lab.
Abstract . . . ii
Keywords . . . iii
Co-authorship statement . . . iv
Acknowledgements . . . v
Contents vi List of Figures ix List of Tables xi 1 Introduction 1 1.1 Motor control . . . 2
1.2 Proprioception . . . 3
1.3 Learning and Adaptation . . . 5
1.3.1 Force-field learning . . . 5
1.3.2 Visuomotor adaptation . . . 6
1.3.3 Modelling learning . . . 7
1.3.4 Error Augmentation . . . 8
1.4.2 Gradient descent . . . 10
1.4.3 Summary . . . 12
2 Materials and Methods 14 2.1 Subjects . . . 15
2.2 Motor task . . . 15
2.2.1 Experimental apparatus . . . 15
2.2.2 Learning task . . . 16
2.2.3 Training schedule . . . 17
2.2.4 Subject groups . . . 17
2.3 Measures of learning and performance . . . 20
2.3.1 Area of error . . . 20
2.3.2 Retention measure . . . 20
2.4 Statistical analyses . . . 21
3 Results 22 3.1 Learning progression . . . 23
3.2 Time . . . 23
3.3 Accuracy . . . 23
3.3.1 Test Trial Perforamnce . . . 23
3.3.2 Non-Test Trial Performance . . . 29
3.3.3 Retention . . . 33
4.1.1 Learning progression . . . 36
4.1.2 Time . . . 36
4.1.3 Test trial performance . . . 36
4.1.4 Non-test trial performance . . . 37
4.1.5 Retention . . . 37
4.2 Discussion of Key Findings . . . 38
4.2.1 General . . . 38
4.2.2 Performance . . . 38
4.2.3 Retention . . . 41
4.3 Gradient Descent . . . 41
4.4 Future Directions . . . 42
4.4.1 Speed of difficulty increase . . . 42
4.4.2 Long-term retention . . . 42
4.4.3 Alternate tasks and dynamics . . . 43
4.5 Conclusion . . . 44
5 Ethics approval 53
6 Vita 55
1.1 An example of the theory of gradient descent where the red star
repre-sents the starting performance and the yellow star reprerepre-sents the goal
performance. . . 11
2.1 An illustration of the setup of the experiment. . . 16
2.2 A visual representation of the schedule followed by participants over
the two days. . . 17
2.3 Shapes each group used for training/learning purposes. . . 19
2.4 An illustration of how area of error is measured based on a subject’s
trace in a trial. Two points of a subject’s trace are indicated in blue. 21
3.1 Proportion of subjects in each [Graudal] and [Gradual-Rotated] groups
at each level on test trials. . . 24
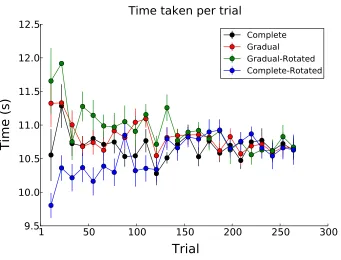
3.2 Average time taken on individual test trials in each group (s). Error
bars show standard error. . . 25
3.3 Average error on each test trials in Complete and Gradual groups. . . 26
3.4 Average error on each test trials in Complete and Gradual-Rotated
groups. . . 27
3.6 Average error on non-test trials in Complete and Gradual groups. . . 30
3.7 Average error on non-test trials in Complete and Gradual-Rotated
groups. . . 31
3.8 Average error on non-test trials in Complete and Complete-Rotated
groups. . . 32
3.9 Performance of groups on the last trial of the first day and the first
trial of the second day. . . 33
3.10 Difference in performance between the last trial of the first day and
the first trial of the second day. . . 34
3.1 Split-plot ANOVA analyzing differences between groups across trials. 26
3.2 Split-plot ANOVA analyzing differences between groups across trials. 29
3.3 One-way ANOVA analyzing differences between groups for retention. 34
Introduction
Throughout our lives, we are constantly moving. From an automated, simple, and
unconscious task such as blinking, to an active, complex, and learned task like a tennis
swing, the human motor system provides us with that ability to move. But with our
ability to perform everyday tasks with such ease, we frequently forget the complexity
involved with acquiring and initiating these movements. In fact, for almost every
movement, the motor system had to once learn the appropriate execution despite
complex interactions of our muscles and joints in an ever changing environment.
1.1
Motor control
The human body is a very complex system. To add upon this, our motor system is
designed to interact with multiple systems to produce a desired action.
The first study done to map and identify the cortex responsible for producing
movement was done by Penfield and Boldrey (1937). The two found the primary
motor cortex elicited movements when electrically stimulated. Later, Evarts (1966)
examined the role of the pyramidal tract in monkeys making arm movements. They
characterized pyramidal tract neuron activity by the axonal conduction velocities
and observed the different firing patterns when associated with movement. Tanji
and Evarts (1976) then found that in the pre- and postcentral sensorimotor cortex,
there were indications of differed neuronal activity based on the intended action to
be made. When monkeys received different instructions for their task, there were
associated changes in neuronal activity. Evarts and Wise (1984) further suggested
the role of the basal ganglia to be a link between the motor areas and the cortical
areas. Georgopoulos et al. (1986) added to the movement literature by suggesting
that individual neuronal cells in the motor cortex represented vectors that contributed
to the resulting movement direction. Down the signal pathway, Bizzi et al. (1995)
found a complex system in the spinal cord circuitry that when activated, produced
synergistic contractions in groups of muscles.
However when we perform an action, we require more than a simple command
from the central nervous system. We must first choose a set of actions out of an
infinite set of possibilities. Our ability to achieve a motor goal in multiple different
ways has been commonly termed redundancy (Bernstein, 1967). But in this infinite
plans are prepared in parallel and one is selected to be initiated (Cisek and Kalaska,
2002, 2005). The researchers found that in the dorsal premotor cortex, there was a
simultaneous encoding of possible actions before the choice was made.
It is also necessary to incorporate information from our various sensory systems.
For example, for goal-directed reaches, we must be able to estimate the position of our
arm and hand through our visual and proprioceptive senses (Sober and Sabes, 2003).
Furthermore, we modify the action that we generate based on the feedback that we
receive. For example, speech production can be altered based on somatosensory and
auditory feedback (Tremblay et al., 2003; Nasir and Ostry, 2006).
1.2
Proprioception
In addition to understanding the dynamics of our complex motor system, accurate
motor control requires information pertaining to the current state of the motor system
(Rothwell et al., 1982; Sober and Sabes, 2003; Gandevia and Burke, 1992).
Feedback from sensory receptors in the limb provide the central nervous system
with information about its current state (McCloskey, 1978). Through the use of
muscle spindles, golgi tendon organs, and cutaneous receptors, the brain can estimate
the current position of the limb. Muscle spindles are currently believed to be a primary
source of feedback. They have been associated with feedback on position, velocity,
and acceleration of a limb and respond to stretching and contraction (Dimitriou and
Edin, 2008; Gandevia, 1998). Golgi tendon organs have previously been believed
to play a lesser role, relaying feedback about muscle contraction force (Jami, 1992;
golgi tendon organs combine with spindle afferents to signal muscle-tendon complex
length (Kistemaker et al., 2012).
Proprioceptive information has shown to activate areas of the somatosensory
cor-tex when performing movements (Prud’homme and Kalaska, 1994; Kalaska, 1988).
More recently, there has been an emergence of literature surrounding the effects of
mo-tor learning on proprioception. Multiple studies have shown proprioceptive changes
of the hand following motor learning of reaching movements (Ostry et al., 2010; Wong
et al., 2011; Haith et al., 2008). Ostry et al. (2010) found a lasting perceptual change
of the limb following active motor learning. Wong et al. (2011) found improved
propri-oceptive acuity in the region of workspace where motor learning occurred. The ability
of motor learning to alter proprioception further demonstrates the connectivity and
mutual influence of the two systems.
In the central nervous system, cortical plasticity and changes in the
somatosen-sory cortex have also been demonstrated following motor learning and changes in the
limb (Buonomano and Merzenich, 1998; Merzenich et al., 1984; Bernier et al., 2009).
Merzenich et al. (1984) found changes in the somatosensory cortex following
ampu-tation of digits in adult monkeys. These results supported the possibility of dynamic
alteration of the cortex through experience and learning. Later, Bernier et al. (2009)
found active proprioceptive suppression in the primary somatosensory cortex during
visuomotor conflict adaptation.
Within the past year, there has also been an interest in how proprioceptive
infor-mation can assist in motor learning. Wong et al. (2012) investigated the effects of
giving subjects proprioceptive information along with visual information about the
training, when compared to visual demonstration alone, subjects benefited in both
movement speed and position error.
1.3
Learning and Adaptation
In the field of motor control, force-field learning and visuomotor adaptation have
taken a central role in the understanding of the processes and various consequences
associated with motor learning.
1.3.1
Force-field learning
Many studies have utilized force-field learning to implement error-based paradigms to
understand motor learning. In force-field studies, the subject generally manipulates
a robotic device that has the ability to apply forces to the hand or arm. Subjects
are required to compensate for these forces when making their movement by learning
to adapt to the new environment. Studies have shown that subjects initially make
large errors due to sensory prediction errors but are able to adapt over trial-to-trial
learning (Shadmehr and Mussa-Ivaldi, 1994; Ostry et al., 2010; Cothros et al., 2008).
Work with force-field studies have also suggested that subjects learn external
dynamics by modelling them within an “internal joint-muscle coordinate system”
(Shadmehr and Mussa-Ivaldi, 1994). The group found that subjects experienced
“after-effects” when the force-field was removed, generating movements that
antic-ipated external perturbation based on the force-field given previously. The group
wanted to examine whether the force-field was modelled by the subjects in an
found that performance of subjects was better when the force-field was transferred in
a joint-coordinate system (the frame of reference was their own joints and muscles)
when compared to an end-point coordinate system transfer (the frame of reference
was external). These internal models that subjects form from learning are lasting
and are able to be recalled even 24 hours after initial learning (Shadmehr et al.,
1995). However, subjects are not able to learn opposite force-fields within a short
time frame and the initial internal model seems to interfere with the learning of the
second (Shadmehr and Brashers-Krug, 1997). Subjects required a separation interval
of over 5 hours to properly learn and retain a second model.
1.3.2
Visuomotor adaptation
Similarly, visuomotor adaptation paradigms have provided researchers with a greater
understanding of motor learning. Generally, visuomotor adaptation learning involves
an investigator introducing a perturbation that distorts the visual feedback of a given
motor command (Shadmehr et al., 2010).
Although there is a vast literature stemming from visuomotor adaptation paradigm
research, the studies focused on will be the ones directly relating to the current study.
It was first shown that learning a visuomotor conflict required sensorimotor
pre-diction error by Held and Freedman (1963). In their study subjects viewed their
finger through prism glasses. Subjects either actively moved their arm while viewing
their finger, or their arm was passively moved. Held and Freedman (1963) found
that after effects were found only if active movements were generated. To support
the requirement of sensory prediction error, Izawa and Shadmehr (2011) found that
errors and showed no sensorimotor remapping.
Interestingly, when Mazzoni and Krakauer (2006) examined the role of explicit
strategy during visuomotor adaptation, they found that an implicit model continued
to be created. The researchers explicitly told participants about the nature of the
visuomotor conflict and the correct solution. At first, the subjects completely negated
the conflict and produced little error but the errors gradually increased. They found
that subjects began adapting to the new target and implicit adaptation took over
due to the sensorimotor error.
1.3.3
Modelling learning
Researchers have also attempted to develop computational models of learning. One
of the earlier models was made by Kawato and Gomi (1992). They proposed a
model of the cerebellum that incorporated motor errors signalled by the climbing
fibers in the motor-command coordinates. The Kalman filter was popularized as
researchers integrated sensory systems with their motor control models. Wolpert
and Ghahramani (1995) explained the Kalman filter model using a forward motor
command state estimate and sensory feedback to calculate the difference between
the predicted and actual states of the motor system. Mussa-Ivaldi and Bizzi (2000)
attempted to break down learning into simpler units called modular primitives that
are trained to be combined when learning to generate a specific action.
Later, Smith et al. (2006) suggested a two-state system multi-rate model that
relatively successfully captured force-field learning and Wei and K¨ording (2009) went
on to incorporate sensorimotor estimates into modelling learning and found that the
to incorporate them into successful motor adaptation. Huang et al. (2011) suggested
a component that combines with internal models during motor learning. They found
that subjects learned opposite visuomotor rotations faster when the successful action
was the same in hand space.
1.3.4
Error Augmentation
It is a surprise to find that relatively little research has been geared towards improving
the rate of learning. One of the most recent attempts at modifying the rate of
learning is by augmenting the error feedback received by a learner. Wei et al. (2005)
found that when compared to subjects receiving standard feedback in a visuomotor
transformation task, subjects who received feedback that amplified the trajectory
by a gain of 2 had a higher rate of learning. However, a gain of 3.1 showed no
difference in learning suggesting that the gain needed to be small enough to help
participants properly attribute the error. In contrast, Sung and Malley (2011) found
no improvement in the rate of learning when subjects received error augmentation of
gain 2. However, they reported that with progressive error augmentation, subjects
produced lower trajectory errors.
1.4
Current study
In our current study, we were interested in the possibility of altering the rate of
learning of a given task. More specifically, we were interested in the effects of training
1.4.1
Mirror drawing
We intended to use a well defined task of high difficulty, and the literature of mirror
drawing provided an excellent option.
Traditionally, mirror drawing learning tasks involved participants tracing a path
with a pencil and paper while receiving visual feedback through a mirror (Carmichael,
1927; Scheidemann, 1950). Motor commands issued involving movements towards or
away from the mirror surface resulted in conflicting visual feedback. Similarly, the
arm is felt proprioceptively to be moving towards or away from the mirror in opposite
directions as visually perceived. This task therefore introduces both a visuo-motor
and visuo-proprioceptive conflict forcing subjects to adapt to the new environment.
Previous studies have used this task to investigate the interaction between the
proprioceptive, vision, and motor system (Allen, 1948; Lajoie et al., 1992; Miall and
Cole, 2006). The difficult nature of this task has been debated to arise from either
mainly the visuo-proprioceptive conflict or the visuomotor conflict.
Lajoie et al. (1992) have well demonstrated the effects of conflicting visual input
and proprioceptive information from the limb. Their group found normal subjects
to experience extreme difficulty when changing directions and tracing oblique lines.
However, a deafferented patient attempting this task performed consistently more
accurately when compared to the healthy subjects. This difference in performance
was attributed to a lack of proprioceptive signals received to conflict with visual
input. Similarly, Balslev et al. (2004) found that repetitive transcranial magnetic
stimulation-induced proprioceptive deeafferentation also improved the accuracy of
mirror drawing in healthy subjects.
visuo-proprioceptive conflict during this task. Miall and Cole (2006) suggested that
in the study by Lajoie et al. (1992), the deafferented patient used on-line visual
processing to guide movement rather than using her forward motor planning. They
hypothesized that with forward planning of actions, deafferented subjects would
ex-perience similar difficulty performing the task, especially with increased complexity
of the template. Miall and Cole (2006) found that the deafferented patients similarly
experienced improvement with practice and had similar increases in movement
dura-tion when tracing templates of higher complexity. However, on continuously curved
templates, the deafferented subject performed significantly better than the controls
in speed and accuracy. The group concluded that visuomotor conflict must
signif-icantly contribute to the difficulty of the mirror drawing task since there were no
visuo-proprioceptive conflicts in the deafferented patient.
1.4.2
Gradient descent
Although the various consequences of motor learning are well studied (Ostry et al.,
2010; Castro et al., 2011; Davidson and Wolpert, 2003), only recently has there been
an increase in literature examining the process and mechanisms by which error is
reduced through motor learning (Shadmehr et al., 2010).
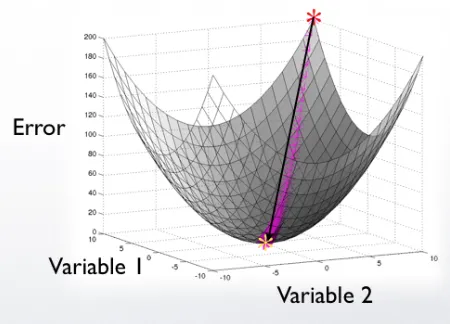
One of the more general theories of error reduction by motor learning is through
gradient descent. In this theory, the learner starts with a set of input variables
(motor commands), producing a certain output, and the optimal solution is a desired
output, requiring a different set of input to attain. In Figure 1.1, we represent the
starting position with the red star and the optimal solution or the goal with the
(optimal solution) for the first time and hits somewhere on the board. To improve and
perform optimally, the subject must travel from the point he/she starts by modifying
his motor commands to move towards that goal location. As the learner continuously
adjusts his/her motor commands, he/she receives feedback about their current error,
represented by the purple stars in Figure 1.1. In the example of throwing a dart,
the player continuously changes his motor commands to adjust for the height and
horizontal error that results. By constantly adjusting the input variables to reduce
error, it is possible for the learner to reach that final goal input that produces minimal
errors (or in other words, hit the bullseye).
Figure 1.1: An example of the theory of gradient descent where the red star represents the starting performance and the yellow star represents the goal performance.
Sternad et al. were one of the few groups to attempt to define error-reduction and
reduction in variance in terms of various costs. Cohen and Sternad (2008) quantified
the various costs used to minimize the effects of motor noise in terms of T-Cost,
N-Cost, and C-Cost. T-Cost is associated with the location of optimal performance,
repre-sented improvement gained if the data covaried optimally. They found that T-Cost
exhibited the highest amount of change at the beginning of practice while the other
two costs diminished more slowly. In a separate paper, Sternad et al. (2011) followed
by quantifying learning a task into improvement in three categories: noise, error
tolerance, and velocity-dependent costs. Their group found that subjects took into
account noise and error tolerance to improve their strategy but accounted little for
velocity-dependent costs.
1.4.3
Summary
Although some researchers have sought to define a set of more general control variables
that are universally modulated as learning progresses (Sternad et al., 2011; Cohen and
Sternad, 2008), little research has examined the role of the distance of the starting
position of the learner, and the position of the solution in some high dimensional
control space (the distance between the yellow and the red star in Figure 1.1). This
would otherwise be interpreted as the complexity of the task in relation to the initial
performance of the learner. It is possible that if this distance is too great (in the
high dimensional space), it may take the learner a greater amount of time to find
the correct path and/or direction towards the target. Furthermore, Sanger (2004)
proposed that if the initial difficulty of the task was high, creating large initial errors,
it could be difficult to improve or reach the optimal solution at all.
In this thesis, the goal was to test the effects on learning of guiding a learner
down the control error gradient (eg. Figure 1.1) from a starting set of control
vari-ables, towards the optimal control signals that minimize error. It was hypothesized
performance at a different rate than the group starting with the full difficult task.
Specifically, we predicted that the rate of improvement of performance would be
greater in the group led down the gradient.
In order to investigate this possibility, we presented subjects with a novel, difficult,
yet well-defined task. For this we chose to simulate a mirror-tracing task of a
five-pointed star. The task is well defined in previous literature (Scheidemann, 1950),
allowing us to specifically modify the difficult components. The mirror-drawing task
has also been shown to have greater visuo-motor conflict versus visuo-proprioceptive
conflict (Miall and Cole, 2006) making the task acceptable to modify for our robotic
manipulandum setup. We isolated the difficult components of the task and introduced
Materials and Methods
2.1
Subjects
A total of 74 students participated in this study with an approximate ratio of 4:5
males:females. All subjects were right-handed, age range 17-55 with the majority in
the range of 17-19, and were randomly assigned to one of four experimental groups.
Written informed consent was obtained and no misdirection was given. As
com-pensation, subjects were either awarded course credit or monetary funds. Subjects
were recruited from the University of Western Ontario campus and all experimental
protocols were approved by the University of Western Ontario Research Ethics Board.
2.2
Motor task
2.2.1
Experimental apparatus
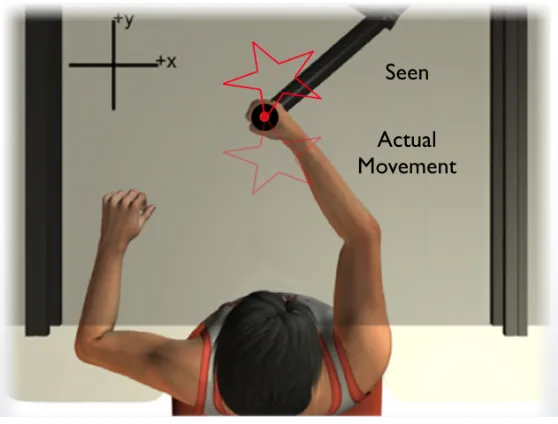
Subjects controlled a robotic manipulandum (Interactive-Motion Technologies,
Wa-tertown, MA, USA) with their right arm (Figure 2.1). Subjects were seated at a desk
and manipulated the robotic arm at shoulder level on a horizontal plane. Beneath
each subject’s right elbow, a custom air-sled was used to reduce the friction between
the arm and the desk. Body and shoulder rotation were prevented using shoulder
straps to maintain the subject in a fixed position.
For visual feedback, subjects observed a mirror reflecting an LCD monitor display
system situated beneath the chin. The mirror simultaneously occluded vision of the
subject’s arm and hand.
Participants’ hand position throughout the experiment was measured using
Figure 2.1: An illustration of the setup of the experiment. The shown shape is labeled “Seen” and the correct actual movement is labeled.
2.2.2
Learning task
Participants were instructed to trace a shape shown on the screen, with the red cursor,
in a counter-clockwise direction. The shape to be traced varied by performance and
by group as explained in the next section. All shapes were 0.54 m in path-length and
were displayed in red. Each trial was to be completed between 9-11 seconds. Feedback
about time remaining was shown in the form of a shrinking vertical bar located on
the right of the screen. The visual feedback of the cursor was inverted in the y-axis,
causing movements of the handle towards the body to be shown as a cursor movement
away, and vice-versa. All subjects were informed of this visuomotor transformation
prior to starting the experiment. Following completion of a trial, subjects were given
visual feedback representing their accuracy in the form of a vertical blue bar that was
2.2.3
Training schedule
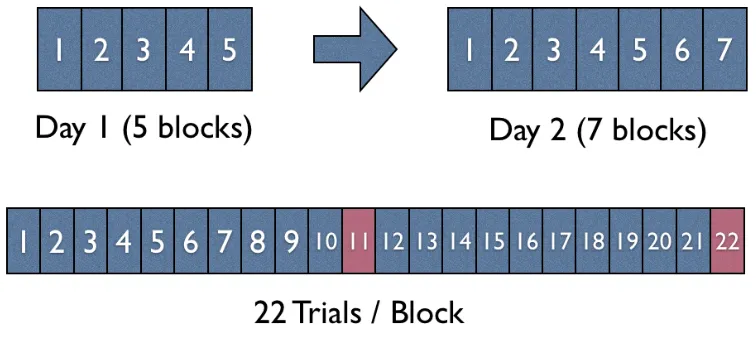
The entire experiment took place over two days. Subjects performed 110 traces on
the first day, and 154 traces on the second. Each block consisted of 22 trials (traces).
All groups were tested on their performance every 11th trial (Figure 2.2).
Figure 2.2: A visual representation of the schedule followed by participants over the two days.
2.2.4
Subject groups
For this experiment, we used four different subject groups. Participants were
ran-domly assigned to one of these four groups.
In order to establish the learning curve of a typical learning paradigm, the first
group [Complete] (n = 21) was given the most difficult shape from the beginning,
consisting of a 5-pointed star shown in Figure 2.3a. Participants in this group were
allowed to train and test on the same shape from start to finish. On test trials (every
To explore the effects of guiding a participant down the error gradient by
incre-mentally adjusting the difficulty of the task, we created 5 levels of increasing difficulty
(Figure 2.3b) with the final level being the star shape used in the [Complete] group
(Figure 2.3a). We identified the sharp directional changes as the difficult parts of this
task according to previous literature (Scheidemann, 1950) and isolated those
compo-nents to create shapes of lower difficulties. The final star shape was passed through a
low pass filter with 4 varying levels of cut-off frequencies to gradually modify the
dif-ficulty level of the shape. Each of these newly generated shapes were stretched in size
to equalize all shapes for their path length, in order to keep a consistent movement
velocity.
The second group [Gradual] (n = 21) progressed through the 5 levels of
increas-ing difficulty (Figure 2.3b). To reach the next level, [Gradual] group subjects were
required to perform two consecutive trials with an average deviation from path of less
than 4 mm. When [Gradual] group subjects reached the final level (the star), they
continued to train and test on the same shape, similar to the control group.
We were also interested in the generalization properties of the [Gradual] group’s
training. To determine whether the incremental training generally improved a
sub-ject’s ability to learn visuomotor reflection tasks, or specifically improved the subsub-ject’s
performance on the task they were guided towards, a third group [Gradual-Rotated]
(n = 15) was created. Similar to the experimental group, subjects in the
[Gradual-Rotated] group progressed through 5 levels of increasing difficulty (Figure 2.3c).
How-ever, the initial 4 shapes were rotated so that the vertices of the shape were opposite
from the final level. The requirements to progress to the next level were the same
final level.
In order to analyze the amount of learning achieved on a different shape
with-out gradual incremental learning, and to isolate the specific benefits of incremental
training, we introduced a fourth group [Complete-Rotated] (n = 17). Participants in
this group trained on a star that was rotated so that the vertices were at opposite
locations when compared to the star to be tested on (Figure 2.3d). The subjects
trained on this shape during the first 4 blocks. Starting from the 5th block, subjects
in this group received a similar protocol to the [Complete] group where they were
allowed to test and train on the same star used in all groups.
Regardless of shape and level, all subjects in each group were tested every 11th
trial on the shape shown in Figure 2.3a.
a) b) c) d)
2.3
Measures of learning and performance
To analyze the level of performance on each trial, we calculated the area error of
sub-jects in order to provide a temporally-independent measure of positional error (section
2.3.1). In order to better characterize the differences of the learning paradigms, we
additionally measured their retention of the task (section 2.3.2). Position of
partic-ipants’ cursor was sampled at a frequency of 600Hz and measurements of accuracy
affected by temporal variables were not used.
2.3.1
Area of error
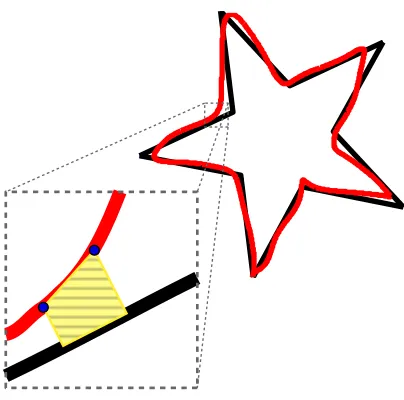
An area measurement was generated by analyzing the minimum perpendicular
devi-ation of the current point to the path, and the minimum perpendicular devidevi-ation of
the next point to the path (Figure 2.4). A sum of the area was generated by analyzing
all points along the subject’s trace.
2.3.2
Retention measure
Accuracy measures of the last trial on the first day and the first trial on the second
day were compared. Data were taken from all subjects in [Complete] and
[Complete-Rotated] groups. Only data from subjects who had reached the final level on the first
Figure 2.4: An illustration of how area of error is measured based on a subject’s trace in a trial. Two points of a subject’s trace are indicated in blue. An area measurement is created by analyzing the area between the trace points (taken at a frequency of 600Hz) and the closest points on the path.
2.4
Statistical analyses
Two-way ANOVAs were performed to compare subject performance across groups
and trials. A one-way ANOVA was performed to compare retention across groups.
Finally, multiple Tukey comparison tests were used to analyze difference in errors
Results
Data were analyzed to assess and characterize learning and performance across groups.
3.1
Learning progression
Subjects in [Gradual] group and [Gradual-Rotated] group progressed through given
levels at similar paces. All subjects reached the final shape (level 5) by trial 143 (test
trial 13) (Figure 3.1).
3.2
Time
Amount of time taken to complete each trial was analyzed for possible differences
between groups. Groups converged on a similar time to complete the task (Figure 3.2).
3.3
Accuracy
Subjects’ accuracy was measured as explained in Section 2.3.1. Performance of
[Com-plete] group subjects was compared against all other groups. Test trial performance
was measured to analyze performance on the final task at various points throughout
training. Non-test trial performance was examined to measure error on individual
tasks during the training period.
3.3.1
Test Trial Perforamnce
Subjects’ accuracy on test trials was measured to assess their performance on the final
task at individual time points. Performance was analyzed and compared in a
two-way ANOVA. Results showed no significant effect of group, a significant effect of trial
(Table 3.1), and significant group x trial interaction. Multiple comparison tests were
Fig-2 4 6 8 10 12 0 0.1 0.2 0.3 0.4 0.5 0.6 0.7 0.8 0.9 1 13-24
Level Progression − Gradual
Test Trial
Proportion of Participants
Level 1 Level 2 Level 3 Level 4 Level 5
0 2 4 6 8 10 12 13-24
0 0.1 0.2 0.3 0.4 0.5 0.6 0.7 0.8 0.9
1
Level Progression − Gradual−Rotated
Proportion of Participants
Level 1 Test Trial Level 2 Level 3 Level 4 Level 5
Figure 3.2: Average time taken on individual test trials in each group (s). Error bars show standard error.
ure 3.4, Figure 3.5.) In Figure 3.3 and Figure 3.4, [Complete] group performance was
significantly better than [Gradual] and [Gradual-Rotated] groups early on in training.
By the end of Day 1 and throughout Day 2, performance was not significantly
differ-ent. In Figure 3.5, when compared to [Complete-Rotated] group, [Complete] group
only performed significantly better during one test trial. Performance otherwise was
SS num DF Error SS den DF F Pr(>F) (Intercept) 0.0033224 1 0.00061606 68 366.7302 <2.2e-16 ***
Group 0.0000357 3 0.00061606 68 1.3126 0.2775
Trial 0.0004988 23 0.00203168 1564 16.6937 <2.2e-16 *** Group:Trial 0.0001836 69 0.00203168 1564 2.0484 1.548e-06 ***
Table 3.1: Split-plot ANOVA analyzing differences between groups across trials.
Average Error (10
-3m 2 )
55 110 165 220 275
0
*
*
*
*
*
Error on Test Trials
Average Error (10
-3 m 2 )
55 110 165 220 275
0
* *
*
* *
Error on Test Trials
Average Error (10
-3m 2 )
55 110 165 220 275
0
*
Error on Test Trials
3.3.2
Non-Test Trial Performance
Subjects’ accuracy on non-test trials was measured to assess their performance on
their respective tasks. Each block represents the average error on 10 non-test
tri-als. Performance was analyzed and compared in a two-way ANOVA and showed
no significant effect of group, a significant effect of trial (Table 3.2), and
signifi-cant group x trial interaction. Multiple comparison tests were performed to analyze
the level of performance at different time points during learning (Figure 3.6,
Fig-ure 3.7, FigFig-ure 3.8. [Complete] group subjects made significantly larger errors on
early non-test trials during training when compared to [Gradual], [Gradual-Rotated],
and [Complete-Rotated] groups. In Figure 3.6, [Gradual] group subjects performed
at lower errors on 4 out of 5 blocks of non-test trials. Following, performance was
not significantly different between groups. A trend existed where [Gradual] group
performance was consistently better past block 11, but no significant differences were
found. In Figure 3.7, [Gradual-Rotated] group subjects performed at lower errors on
2 out of 4 blocks of non-test trials. No significant differences were found past these
blocks. In Figure 3.8, [Complete-Rotated] group subjects performed at lower errors
on 5 out of 6 blocks of non-test trials. Performance following was not significantly
different and both groups performed with similar errors.
SS num DF Error SS den DF F Pr(>F) (Intercept) 0.0038162 1 0.00065854 68 394.0565 <2.2e-16 ***
Group 0.0000336 3 0.00065854 68 1.1575 0.3324
Trial 0.0006572 23 0.00161248 1564 27.7128 <2.2e-16 *** Group:Trial 0.0001423 69 0.00161248 1564 2.0002 3.497e-06 ***
Average Error (10
-3m 2 )
Block (10 trials)
5 10 15 20 25
Error on Non-test Trials
*
* *
*
Average Error (10
-3 m 2 )
Block (10 trials)
5 10 15 20 25
Error on Non-test Trials
* * *
8 10
Average Error (10
-3 m 2 )
Block (10 trials)
5 10 15 20 25
Error on Non-test Trials
*
* *
* *
3.3.3
Retention
One commonly used measure to define learning is retention of a skill. We were
inter-ested in the possibility of different retention displayed between groups. We analyzed
the performance of all subjects in [Complete] group and [Complete-Rotated] group
on their last trial on the first day and the first trial on the second day (Trials 110 &
111). Performance of subjects who had reached the final level in the [Gradual] group
and [Gradual-Rotated] was similar (Figure 3.9). To assess retention, we analyzed the
change in performance between trial 111 and trial 110 within each group (Figure 3.10).
Retention of skill was not significantly different across groups (Table 3.3).
Average Error (10
-3m 2 )
Average Error (10 3-m
2)
Complete Gradual Gradual
Rotated CompleteRotated
Figure 3.10: Difference in performance between the last trial of the first day and the first trial of the second day. Note: only the performance of individuals who had already reached level 5 of the task were included [15 in Gradual group and 17 in Gradual-Rotated group]. Error bars show standard error.
DF Sum Sq Mean Sq F value Pr(>F) RetentionGroup 3 1.037e-05 3.455e-06 1.634 0.191 Residuals 60 1.269e-04 2.115e-06
Discussion
4.1
Results Summary
4.1.1
Learning progression
It was important for us to first characterize the progression through the levels by the
[Gradual] group and the [Gradual-Rotated] group. Both groups progressed at similar
rates with all subjects reaching the final level and goal task by trial 143. These results
also suggest that the gradual incremental increase in difficulty was similar regardless
of orientation of the shape given.
4.1.2
Time
We were interested in analyzing whether the progression through the incremental
levels of difficulty would affect the time to complete the task. Although the paths
of each level were matched in length, it could be possible that due to the gradual
increase in difficulty, groups would take various amounts of time to complete the final
task within the two second window. An analysis of the overall time taken to complete
the task by each group converged at 10.5 seconds. No significant differences were
found between groups by the time all subjects reached the final task.
4.1.3
Test trial performance
Our main focus was the performance of the goal task that subjects were intended to
learn. As all subjects, regardless of group, received the same goal shape on test trials,
we were interested in analyzing the performance on those trials as time progressed.
On test trials, [Complete] group consistently performed significantly better than the
sig-nificant differences were found between groups. Surprisingly, [Complete] group only
performed significantly better on one out of the initial six test trials when compared
to the [Complete-Rotated] group.
4.1.4
Non-test trial performance
To make sure that we were indeed successfully reducing the difficulty of the task, we
analyzed the average performance on non-test trials. We expected to see lower errors
in the groups experiencing gradual increases in difficulty ([Gradual] and
[Gradual-Rotated] group). When comparing the [Gradual] group to the [Complete] group,
indeed we found that the [Complete] group exhibited larger errors on four out of five
blocks of the initial non-test trials. Following, no significant differences were found.
To less of an effect, [Gradual-Rotated] group only performed with lower errors in two
out of the initial 4 test trials. Similarly, no significant differences were found past
these trials.
To our surprise the [Complete-Rotated] group performed with significantly lower
errors in five out of the six initial test trials. No significant differences were found
following.
4.1.5
Retention
To assess the amount of learning in each group, we used a typical retention measure.
We analyzed the difference of the initial trial performance on the second day and the
final trial performance on the second day. No significant differences were found for
4.2
Discussion of Key Findings
4.2.1
General
Our initial goal was to design a training paradigm that would allow for a
grad-ual increase in difficulty. We accomplished this by isolating the difficult parts of
the mirror-drawing task and specifically adjusting it to reduce its difficulty. When
analyzing the [Gradual] and [Gradual-Rotated] level progression, subjects advanced
through our given levels at a relatively similar rate. This suggests that regardless
of orientation of the shape, subjects took approximately the same time to progress
through the levels. Therefore our design for gradually increasing the difficulty of the
task proved similar across different orientations.
It was also important for us to maintain consistent average velocity in subjects’
movements across groups. We equalized all shapes to have the same path length
forcing subjects to travel the same distance within the given amount of time. In
previous studies, it has been shown that around the corners of a shape in a mirror
drawing task, subjects spend more time and make more errors (Miall and Cole, 2006).
However, although subjects in the [Gradual] and [Gradual-Rotated] group practiced
on a different shape before they reached the final level, they spent similar amounts
of time to complete the final task.
4.2.2
Performance
The main question with this paradigm was how our novel training paradigm would
affect the performance of a goal task over time. In a similar experiment, Michel et al.
researchers found that the gradual group who was unaware of the gradually
intro-duced visuomotor rotation had more robust after effects, suggesting greater amount
of learning. However, we did not find similar results.
Although a split-plot ANOVA of both test-trial performance and non-test trial
performance between groups, across trials, showed no significant differences between
groups, we were interested in the possibility of significant differences at certain time
points of their learning phase.
Not surprisingly [Complete] group consistently and significantly performed better
than [Gradual] and [Gradual-Rotated] groups on the early trials. As many subjects
in the latter groups had not reached the final level and did not have an opportunity
to practice on the goal task, it is quite intuitive that the [Complete] group would
perform better. These results suggest that immediate exposure and practice of the
goal task may lead to better performance early on in time.
However, it is important to note that our novel training paradigm was successful
in performing its role. On non-test trials, [Gradual-Rotated] and [Gradual] groups
performed at a significantly lower amount of error while practicing their respective
shapes. This suggests that our “easier” shape proved to reduce the amount of error
subjects made initially.
Most surprisingly however, was the performance of the [Complete-Rotated] group
during test and non-test trials. On test-trials [Complete] group subjects only
per-formed significantly better on one trial than the [Complete-Rotated] group even
though the shape they were practicing on was rotated so that the vertices of the
star were at opposite locations. Furthermore, on non-test trials, [Complete-Rotated]
sub-jects even though their task was assumed to be of equal difficulty.
These results may be accounted by a few confounding factors. First of all, on
test-trials, the practice of a rotated but presumably equal difficulty shape could be well
generalized even early on in time. It may be possible that these [Complete-Rotated]
group subjects were learning something more general about the mirror drawing task
and how it applied to such a complex shapes. They could then generalize to a rotated
version with relative ease, causing their performance to be similar to those practicing
the goal shape.
Unfortunately, the ability to generalize would not explain the [Complete-Rotated]
group’s consistently lower errors during non-test trials. One possibility is that the
rotated version that they received during practice trials was more comfortable and
optimal for joint configurations. For example, Graham et al. (2003) found that even
in similar reaching movements, arm movements towards different spatial locations
resulted in large differences in joint torques, motion, and power. Further, Kurtzer
et al. (2006) found preferred hand directions and torque direction in hand and arm
muscles during unloaded reaching movements. This suggests that the two orientations
of the same shape may have required very different muscle and torque activations,
resulting in one being significantly more preferable than the other.
Finally, another possibility is that these subjects were just simply different. Due
to the nature of the scheduling of the study, these subjects were recruited at a later
time than the other groups. It may be possible then that this was a sample from a
4.2.3
Retention
Klassen et al. (2005) found that when subjects were introduced gradually to a
vi-suomotor rotation or a rotary viscous force-field, they retained the learning as well
or better than their counterparts who received the full perturbation instantaneously.
We did not find similar results when comparing performance on the end of day 1 and
at the beginning of day 2. This could be however due to a number of reasons. First
of all, only the subjects that reached the final level were included for the [Gradual]
and [Gradual-Rotated] groups. These subjects had much less exposure to the final
task shape and had less chance to practice and perform on that task. Furthermore,
subjects’ performances were analyzed before plateauing at a stable performance level.
4.3
Gradient Descent
Our initial idea for this training paradigm was based off of learning by gradient
descent. We attempted to bring the goal closer to the subjects’ starting point to guide
them towards the optimal goal solution. However it seemed that the mirror-drawing
task was not an optimal task choice to examine this possibility. The [Complete]
group who experienced significantly larger errors at the beginning, had relatively little
difficulty finding the solution to the given task. One main reason for this phenomenon
was the lack of penalties or failures. Large errors did not result in immediate failure
of the task and subjects were allowed to exploratively examine and attribute their
4.4
Future Directions
This study was extremely novel in the field of motor learning. We examined the
effects of a novel training paradigm on a well-documented task. However there are
a number of additional ideas we are hoping to explore and implement into future
studies.
4.4.1
Speed of difficulty increase
In our study we implemented a novel training paradigm where the task gradually
increased in difficulty in a series of steps. We chose five individual levels which
produced a relatively low increase in difficulty per increase of level. It is possible that
there may be an optimum descent rate at which individuals can approach tasks of a
higher level of difficulty with relatively equal ease. We are interested in the possibility
of changing the number of steps to advance (greater or less) from the simplest task
to the most complex and final goal, and how that may affect performance and rate
of learning.
4.4.2
Long-term retention
Although we attempted to look at retention as an indicator of learning across groups,
participants had not plateaued to a certain level of performance at the end of day one.
It would be extremely interesting to investigate the possibility of differences in
long-term retention between gradual training and immediate introduction of a complex
4.4.3
Alternate tasks and dynamics
We chose to use a mirror-drawing task as it was well characterized in terms of its
complex nature. However we are curious as to how this novel training paradigm
would apply to other tasks.
There are a number of characteristics of the mirror-drawing task that could have
masked possibly significant effects. Most importantly, the performance of subjects
improved relatively quickly and plateaued early on in the second day. The application
of this training paradigm on a task that would require a greater amount of time to
perfect, may produce a larger difference in performance between groups.
Furthermore, the mirror-drawing task had no penalty for large errors. One
rea-son why large initial errors may make learning more difficult is due to an inability
to correctly attribute the action performed to the resulting error due to immediate
penalties. We are interested in implementing this novel training paradigm to a task
where larger errors produce a penalty, and analyzing how gradual training versus
immediate exposure to a complex task can affect learning and performance.
Overall, it was difficult for our group to find a task complex enough that the
learning curve would show long gradual learning, but simple enough that the task
was not near impossible to learn. A more difficult task would magnify the difference
in performances, but only if the task was not so difficult that subjects would not be
able to learn. We recognized from this study that although the mirror drawing task
was a good task to demonstrate the feasibility of our novel paradigm, we must find a
4.5
Conclusion
Our novel training paradigm produced significantly different performance across groups
at various points throughout learning. Our results suggest that subjects’ performances
on the goal task was not significantly different across groups by the end of training.
What we did observe however was a significant difference of performance of the goal
task, and the amount of error made during practice trials early on when comparing
groups using our training paradigm, versus the group immediately exposed to the
difficult task.
We determined that our training paradigm successfully reduced the difficulty and
errors of a complex task while allowing gradual training towards the goal task. Having
significantly lower errors during the beginning of training, it is possible that our
paradigm could be implemented successfully with even greater effect towards tasks
with higher errors resulting in penalties. For example, in physiotherapy or training of
tasks like riding a bicycle where larger errors may result in injuries, it is possible to use
this paradigm to reduce initial errors without affecting long-term final performance
of the task.
On the contrary, if the goal is to reach the best performance possible as early
as possible, it may be beneficial to allow learning of the final complex task from
the beginning. Further studies are required to understand how this novel paradigm
Allen, R. M. (1948). Factors in mirror drawing. Journal of Educational Psychology,
39(4):216–226.
Balslev, D., Christensen, L. O., Lee, J.-H., Law, I., Paulson, O. B., and Miall, R. C.
(2004). Enhanced accuracy in novel mirror drawing after repetitive transcranial
magnetic stimulation-induced proprioceptive deafferentation. Journal of
Neuro-science, 24(43):9698–9702.
Bernier, P. M., Burle, B., Vidal, F., Hasbroucq, T., and Blouin, J. (2009). Direct
Evidence for Cortical Suppression of Somatosensory Afferents during Visuomotor
Adaptation. Cerebral Cortex, 19(9):2106–2113.
Bernstein, N. A. (1967). The co-ordination and regulation of movements. Oxford:
Pergamon Press.
Bizzi, E., Giszter, S. F., Loeb, E., Mussa-Ivaldi, F. A., and Saltiel, P. (1995). Modular
organization of motor behavior in the frog’s spinal cord. Trends in Neurosciences,
18(10):442–446.
Buonomano, D. V. and Merzenich, M. M. (1998). CORTICAL PLASTICITY: From
Synapses to Maps. Annual Review of Neuroscience, 21(1):149–186.
Carmichael, L. (1927). The History of Mirror Drawing as a Laboratory Method. The
Pedagogical Seminary and Journal of Genetic Psychology, 34(1):90–91.
Castro, L. N. G., Wu, H. G., and Smith, M. A. (2011). Adaptation to dynamic
envi-ronments displays local generalization for voluntary reaching movements.
Confer-ence proceedings : ... Annual International ConferConfer-ence of the IEEE Engineering in
Medicine and Biology Society. IEEE Engineering in Medicine and Biology Society.
Conference, 2011:4050–4052.
Cisek, P. and Kalaska, J. F. (2002). Simultaneous encoding of multiple potential reach
directions in dorsal premotor cortex. Journal of neurophysiology, 87(2):1149–1154.
Cisek, P. and Kalaska, J. F. (2005). Neural Correlates of Reaching Decisions in Dorsal
Premotor Cortex: Specification of Multiple Direction Choices and Final Selection
of Action. Neuron, 45(5):801–814.
Cohen, R. G. and Sternad, D. (2008). Variability in motor learning: relocating,
channeling and reducing noise. Experimental brain research. Experimentelle
Hirn-forschung. Exp´erimentation c´er´ebrale, 193(1):69–83.
Cothros, N., Wong, J., and Gribble, P. L. (2008). Distinct Haptic Cues Do Not
Reduce Interference when Learning to Reach in Multiple Force Fields. PloS one,
3(4):e1990.
Davidson, P. R. and Wolpert, D. M. (2003). Motor learning and prediction in a
variable environment. Current opinion in neurobiology, 13(2):232–237.
Dimitriou, M. and Edin, B. B. (2008). Discharges in human muscle spindle afferents
Evarts, E. V. (1966). Pyramidal tract activity associated with a conditioned hand
movement in the monkey. Journal of neurophysiology.
Evarts, E. V. and Wise, S. P. (1984). Basal ganglia outputs and motor control. Ciba
Foundation symposium, 107:83–102.
Gandevia, S. C. (1998). Neural control in human muscle fatigue: changes in muscle
afferents, moto neurones and moto cortical drive. Acta physiologica scandinavica,
162(3):275–283.
Gandevia, S. C. and Burke, D. (1992). Does the nervous system depend on kinesthetic
information to control natural limb movements? Behavioral and Brain Sciences,
15:614–614.
Georgopoulos, A., Schwartz, A., and Kettner, R. (1986). Neuronal population coding
of movement direction. Science, 233(4771):1416–1419.
Graham, K. M., Moore, K. D., Cabel, D. W., Gribble, P. L., Cisek, P., and Scott, S. H.
(2003). Kinematics and Kinetics of Multijoint Reaching in Nonhuman Primates.
Journal of . . ..
Haith, A., Jackson, C., Miall, C., and Vijayakumar, S. (2008). Unifying the sensory
and motor components of sensorimotor adaptation.
Held, R. and Freedman, S. J. (1963). Plasticity in Human Sensorimotor Control.
Science, 142(3591):455–462.
Learning and Savings in Adaptation Paradigms: Model-Free Memory for Successful
Actions Combines with Internal Models. Neuron, 70(4):787–801.
Izawa, J. and Shadmehr, R. (2011). Learning from sensory and reward prediction
errors during motor adaptation. PLoS computational biology, 7(3):e1002012.
Jami, L. (1992). Golgi tendon organs in mammalian skeletal muscle: functional
properties and central actions. Physiological Reviews, 72(3):623–666.
Kalaska, J. F. (1988). The representation of arm movements in postcentral and
parietal cortex. Canadian journal of physiology and pharmacology, 66(4):455–463.
Kawato, M. and Gomi, H. (1992). A computational model of four regions of the
cerebellum based on feedback-error learning. Biological cybernetics, 68(2):95–103.
Kistemaker, D. A., Van Soest, A. J. K., Wong, J. D., Kurtzer, I., and Gribble, P. L.
(2012). Control of position and movement is simplified by combined muscle spindle
and Golgi tendon organ feedback. Journal of neurophysiology, (109):1126–1139.
Klassen, J., Tong, C., and Flanagan, J. R. (2005). Learning and recall of incremental
kinematic and dynamic sensorimotor transformations.Experimental brain research.
Experimentelle Hirnforschung. Exp´erimentation c´er´ebrale, 164(2):250–259.
Kurtzer, I., Herter, T. M., and Scott, S. H. (2006). Nonuniform Distribution of
Reach-Related and Torque-Related Activity in Upper Arm Muscles and Neurons
of Primary Motor Cortex. Journal of neurophysiology.
Y. (1992). Mirror drawing in a deafferented patient and normal subjects
Visuopro-prioceptive conflict. Neurology, 42(5):1104–1104.
Mazzoni, P. and Krakauer, J. W. (2006). An implicit plan overrides an explicit
strategy during visuomotor adaptation.Journal of Neuroscience, 26(14):3642–3645.
McCloskey, D. I. (1978). Kinesthetic sensibility. Physiological Reviews, 58(4):763.
Merzenich, M. M., Nelson, R. J., Stryker, M. P., Cynader, M. S., Schoppmann, A., and
Zook, J. M. (1984). Somatosensory cortical map changes following digit amputation
in adult monkeys. The Journal of Comparative Neurology, 224(4):591–605.
Miall, R. C. and Cole, J. (2006). Evidence for stronger motor than
visuo-proprioceptive conflict during mirror drawing performed by a deafferented subject
and control subjects. Experimental brain research. Experimentelle Hirnforschung.
Exp´erimentation c´er´ebrale, 176(3):432–439.
Michel, C., Pisella, L., Prablanc, C., Rode, G., and Rossetti, Y. (2007).
Enhanc-ing visuomotor adaptation by reducEnhanc-ing error signals: sEnhanc-ingle-step (aware) versus
multiple-step (unaware) exposure to wedge prisms. Journal of Cognitive
Neuro-science, 19(2):341–350.
Mussa-Ivaldi, F. A. and Bizzi, E. (2000). Motor learning through the combination of
primitives. Philosophical Transactions of the Royal Society B: Biological Sciences,
355(1404):1755–1769.
Nasir, S. M. and Ostry, D. J. (2006). Somatosensory Precision in Speech Production.
Ostry, D. J., Darainy, M., Mattar, A. A. G., Wong, J., and Gribble, P. L. (2010).
Somatosensory Plasticity and Motor Learning. The Journal of neuroscience : the
official journal of the Society for Neuroscience, 30(15):5384–5393.
Penfield, W. and Boldrey, E. (1937). Somatic motor and sensory representation in
the cerebral cortex of man as studied by electrical stimulation. Brain.
Prud’homme, M. J. and Kalaska, J. F. (1994). Proprioceptive activity in primate
primary somatosensory cortex during active arm reaching movements. Journal of
neurophysiology, 72(5):2280–2301.
Rothwell, J. C., TRAUB, M. M., Day, B. L., OBESO, J. A., THOMAS, P. K., and
Marsden, C. D. (1982). Manual motor performance in a deafferented man. Brain,
105(3):515–542.
Sanger, T. D. (2004). Failure of motor learning for large initial errors. Neural
com-putation, 16(9):1873–1886.
Scheidemann, N. V. (1950). A Five-Pointed Star-Pattern for Mirror-Drawing. The
American Journal of Psychology, 63(3):441–444.
Shadmehr, R. and Brashers-Krug, T. (1997). Functional stages in the formation of
human long-term motor memory. Journal of Neuroscience, 17(1):409–419.
Shadmehr, R., Brashers-Krug, T., and Mussa-Ivaldi, F. (1995). Interference in
learn-ing internal models of inverse dynamics in humans.Advances in neural information
Shadmehr, R. and Mussa-Ivaldi, F. A. (1994). Adaptive representation of dynamics
during learning of a motor task. Journal of Neuroscience, 14(5):3208–3224.
Shadmehr, R., Smith, M. A., and Krakauer, J. W. (2010). Error correction, sensory
prediction, and adaptation in motor control.Annual Review of Neuroscience, 33:89–
108.
Smith, M. A., Ghazizadeh, A., and Shadmehr, R. (2006). Interacting adaptive
pro-cesses with different timescales underlie short-term motor learning. PLoS Biology,
4(6):e179.
Sober, S. J. and Sabes, P. N. (2003). Multisensory integration during motor planning.
Journal of Neuroscience, 23(18):6982–6992.
Stephens, J. A., Reinking, R. M., and Stuart, D. G. (1975). Tendon organs of cat
medial gastrocnemius: responses to active and passive forces as a function of muscle
length. Journal of neurophysiology, 38(5):1217–1231.
Sternad, D., Abe, M. O., Hu, X., and Muller, H. (2011). Neuromotor noise, error
tolerance and velocity-dependent costs in skilled performance. PLoS computational
biology, 7(9):e1002159.
Sung, M. and Malley (2011). Effect of progressive visual error amplification on human
motor adaptation. Rehabilitation Robotics (ICORR).
Tanji, J. and Evarts, E. V. (1976). Anticipatory activity of motor cortex neurons
in relation to direction of an intended movement. Journal of neurophysiology,
Tremblay, S., Shiller, D. M., and Ostry, D. J. (2003). Somatosensory basis of speech
production. Nature, 423(6942):866–869.
Wei, K. and K¨ording, K. (2009). Relevance of error: what drives motor adaptation?
Journal of neurophysiology, 101(2):655–664.
Wei, Y., Bajaj, P., Scheidt, R., and Patton, J. (2005). Visual error augmentation for
enhancing motor learning and rehabilitative relearning. pages 505–510.
Wolpert, D. M. and Ghahramani, Z. (1995). An internal model for sensorimotor
integration. SCIENCE-NEW YORK . . ..
Wong, J. D., Kistemaker, D. A., Chin, A., and Gribble, P. L. (2012). Can
propriocep-tive training improve motor learning? Journal of neurophysiology, 108:3313–3321.
Wong, J. D., Wilson, E. T., and Gribble, P. L. (2011). Spatially selective
enhance-ment of proprioceptive acuity following motor learning.Journal of neurophysiology,
Ethics approval
Vita
Name
Alvin Chin
Post-secondary education and degrees
Western University, London ON 2007-2011 B.M.Sc. (Hon.)
Honours and Awards
Western Graduate Research Scholarship, 2011-12, 2012-13
Western Honour Roll, 2007-8, 2008-9, 2009-10, 2010-11
Related Work Experience
Teaching Assistant, Introduction to Psychology, University of Western Ontario,
2011-2013
Research Assistant, Dr. Paul L Gribble, Motor Control Lab, University of
Western Ontario, 2011
Research Assistant, Dr. Ed Lui, Ginseng Lab, University of Western Ontario,
2010
Publications
Wong JD, Kistemaker DA, Chin A, Gribble PL (2012). Can proprioceptive
training improve motor learning?. Journal of Neurophysiology. 108(12):
3313-21
Presentations as a guest speaker
Chin A, Gribble PL (2012). Can incrementally modifying the goal increase the
rate of learning for a complex motor task? Poster presented at the Society for
![Figure 2.3: Shapes each group used for training/learning purposes. a) [Complete]group training shape, “level 5” of [Gradual] and [Gradual-Rotated] groups, and testshape on every 11th trial](https://thumb-us.123doks.com/thumbv2/123dok_us/7789258.1289930/31.612.119.527.354.462/training-learning-purposes-complete-training-gradual-rotated-testshape.webp)
![Figure 3.1: Proportion of subjects in each [Graudal] and [Gradual-Rotated] groupsat each level on test trials.](https://thumb-us.123doks.com/thumbv2/123dok_us/7789258.1289930/36.612.135.511.110.592/figure-proportion-subjects-graudal-gradual-rotated-groupsat-trials.webp)
![Figure 3.3: Average error on each test trial in [Complete] and [Gradual] groups. Trialsmarked with a ‘*’ indicate significant differences (p <0.05)](https://thumb-us.123doks.com/thumbv2/123dok_us/7789258.1289930/38.612.108.561.122.201/figure-average-complete-gradual-trialsmarked-indicate-signicant-dierences.webp)
![Figure 3.4: Average error on each test trial in [Complete] and [Gradual-Rotated]groups](https://thumb-us.123doks.com/thumbv2/123dok_us/7789258.1289930/39.612.190.445.225.433/figure-average-error-trial-complete-gradual-rotated-groups.webp)
![Figure 3.5: Average error on each test trial in [Complete] and [Complete-Rotated]groups](https://thumb-us.123doks.com/thumbv2/123dok_us/7789258.1289930/40.612.191.446.226.433/figure-average-error-trial-complete-complete-rotated-groups.webp)
