Hepatic Medicine: Evidence and Research
Dove
press
O R i g i n A L R E s E A R c H
open access to scientific and medical research
Open Access Full Text Article
inhibition of notch signaling affects hepatic oval
cell response in rat model of 2AAF-PH
Houda Darwiche seh-Hoon Oh
nicole c steiger-Luther Jennifer M Williams Dana g Pintilie Thomas D shupe Bryon E Petersen
Department of Pathology, immunology, and Laboratory Medicine, Program in stem cell Biology and Regenerative Medicine, college of Medicine, University of Florida, gainesville, FL, UsA
correspondence: Houda Darwiche Department of Pathology, University of Florida, PO Box 100275, gainesville, FL 32610, UsA
Tel +1 352 846 1486 Fax +1 352 392 6249 Email [email protected]
Background and aims: Activation of the oval cell compartment occurs in the liver when hepatocytes are functionally compromised and/or unable to divide. Our goal was to investigate the systemic signals responsible for determining the efficiency of oval cell-mediated liver regeneration, focusing on the Notch signaling cascade.
Methods: The established oval cell induction protocol of 2-acetylaminofluorine (2-AAF) implantation followed by 70% surgical resection of the liver (partial hepatectomy, PH) was employed in a rat model. This oval cell induction model was further combined with injections
of a γ-secretase inhibitor (GSI XX) to examine the effects of Notch inhibition on oval cell-aided
regeneration of the liver.
Results: Notch signaling was found to be upregulated at the peak of oval cell induction dur-ing 2AAF-PH alone. Treatment with GSI XX led to interruption of the Notch signal, as shown by a decrease in expression of Hes1. While there was a robust oval cell response seen at day 11 post-PH, there was a measurable delay in differentiation when Notch was inhibited. This was confirmed morphologically as well as by immunohistochemistry for the oval cell markers,
α-fetoprotein, OV-6, and CK19. The hepatocytes seen at day 22 demonstrated an enhanced
hepatocellular mitoinhibition index (p21Waf1/Ki67), suggestive of dysregulated proliferation and
cell cycle progression. Moreover, these hepatocytes exhibited decreased expression of hepatocyte
functional markers, such as cytochrome P450 and glucose-6-phosphatase-α.
Conclusion: Taken together, these results identify the Notch signaling pathway as a potent regulator of differentiation and proliferation in oval cells, which is necessary for functional repair of the liver by oval cells.
Keywords: Notch, oval cells, liver, regeneration, differentiation
Introduction
The signals mediating cellular specification are produced by adjacent or even distant cells, and often these various signals are received by the cell simultaneously. Therefore, they must be integrated in proper order for the correct specification of cell fate to occur.1 The Notch family of receptors encompasses a group of proteins that function
both as cell surface receptors and as direct regulators of cellular specification, leading to differentiation, cell cycle progression, proliferation, or apoptosis.2–5 Generally,
activation of the Notch pathway inhibits differentiation via transcriptional repression of genes specific to a certain cell lineage. This limits the number of cells that will assume a certain lineage, and thereby leaves a small number of uncommitted progenitors that are able to adopt alternative cell fates.3
Hepatic Medicine: Evidence and Research downloaded from https://www.dovepress.com/ by 118.70.13.36 on 22-Aug-2020
For personal use only.
Number of times this article has been viewed
This article was published in the following Dove Press journal: Hepatic Medicine: Evidence and Research
Dovepress
Darwiche et al
The Notch signaling pathway is said to be activated when the extracellular domain of the Notch receptor is bound by a ligand, eg, Jagged or Delta, on neighboring cells. Following activation, the receptor is cleaved by
γ-secretase, leading to release and translocation of the Notch intracellular cytoplasmic domain (NICD) from the cytoplasm to the nucleus.6,7 This results in the subsequent
activation of transcriptional regulators of genes involved in differentiation, proliferation, and apoptosis. Inhibition of
γ-secretase has been well documented in the literature as a method for inhibition of the Notch signal.8–10 Experimental
evidence has shown that Notch receptors and ligands are widely distributed, and that the Notch cascade is required for mammalian development and growth in many organ systems, including the liver.11
The liver is the only solid organ in the body with the capacity for rapid regeneration in response to injury. If hepatocytes are prevented from initiating the regeneration response, or if the injury is too severe, then the liver stem cell compartment is activated, giving rise to the oval cell population.12 In normal liver tissue, oval cell numbers
are very small. However, when activation occurs, there is profuse replication of these cells in the periportal regions of the lobule. Activation of the oval cell compartment is usually achieved via the 2AAF-PH protocol, which employs 2-acetylaminofluorine (2AAF) implantation to prevent proliferation of resident hepatocytes followed by a 70% surgical resection of the liver (partial hepatectomy, PH).17,18
Approximately 11 days post-PH, a large number of oval cells can be seen infiltrating the periportal regions of the liver. These cells further give rise to the hepatocytes and cholangiocytes that restore the liver mass by 22 days after the resection.
Morphologically, oval cells are small in size (approxi-mately 10 µm), with little cytoplasm and an ovoid nucleus, after which they are named. Oval cells possess characteristics similar to ductular cells in their distinct isoenzyme profiles, expressing markers such as OV-6, α-fetoprotein (AFP), and CK19.12–14 They are capable of generating both hepatocytes
and bile duct cells, thereby qualifying themselves as bipotential progenitor cells in adult livers.15,16
In the current study, we examine the potential role of Notch signaling in the regulation of oval cell-mediated liver regeneration. We have demonstrated induction of oval cells at day 11 post-2AAF-PH, as well as a simultaneous increase in Notch1 expression. Combining the 2AAF-PH model with treatments using the γ-secretase inhibitor (GSI) XX, during the peak of the oval cell response terminated the Notch signal,
as evidenced by a decrease in expression of downstream effector Hes1. Inactivation of Notch signaling led to a stunted differentiation response by the activated oval cells. This is demonstrated morphologically, as well as by aberrant expression levels of such markers as OV-6, AFP, and CK19, at day 22 post-PH. Inhibition of Notch further resulted in an abnormal hepatocellular mitoinhibition index (p21Waf1:Ki67)
at day 22 post-PH. The hepatocytes generated at this time point appear to be functionally impaired, with decreased levels of CYP3A2 and glucose-6-phosphatase-(G6Pase)-α. Taken together, these data demonstrate an important regula-tory role for Notch signaling in the proper differentiation and growth of oval cells during 2AAF-PH.
Methods
2-AAF implantation and partial
hepatectomy
All procedures were performed on male Fischer 344 rats (Jackson Laboratory, Bar Harbor, ME) approximately 10 weeks of age. Upon anesthetization, a 28-day time-release 2-AAF pellet (Innovative Research Inc., Plymouth, MN) was implanted in the peritoneal cavity of the animal. One week later, a 70% surgical resection of the liver was performed under general anesthesia, as previously described.19 Rats were
euthanized at the appropriate time points (n = 3) by injection with sodium pentobarbital (0.1 mL/100 g). For 2AAF-PH treated animals, normal untreated rats (n = 3) served as the control group. All procedures involving animals were approved by the University of Florida Institutional Animal Care and Use Committee.
Preparation and delivery
of
γ
-secretase inhibitor
GSI XX (Calbiochem, Darmstadt, Germany) was dissolved in a solution of 0.5% Methocel E4M and 0.1% Tween80 and then administered via tail vein injection once daily to animals on the 2AAF-PH protocol. Animals received injec-tions starting day 7 post-PH and continuing through day 14 post-PH, thereby covering the peak of the oval cell response. Rats were euthanized at the appropriate time points (n = 3) by injection with sodium pentobarbital. For animals receiv-ing 2AAF-PH in combination with GSI XX, animals on the 2AAF-PH protocol that received injections of vehicle only (n = 3) served as the control group.
Histologic analysis
Formalin-fixed paraffin-embedded sections (5 µm) were stained by hematoxylin and eosin according to established methods.
Hepatic Medicine: Evidence and Research downloaded from https://www.dovepress.com/ by 118.70.13.36 on 22-Aug-2020
Dovepress notch in oval cell-mediated liver regeneration
Slides were visualized using the 40× objective on an Olympus B51 microscope (Olympus, Tokyo, Japan) and pictures taken on an Olympus U-TVO.5×c camera with MagnaFire.
immunohistochemistry
Immunohistochemistry was performed on formalin-fixed paraffin-embedded or fixed-frozen sections (5 µm). Slides were incubated with the appropriate primary antibody O/N at 4°C. Staining was visualized using the appropriate biotinylated secondary antibody with the Vectastain Elite kit and DAB (Vector Labs, Burlingame, CA), and counterstain-ing was performed uscounterstain-ing hematoxylin. Slides were visualized using an Olympus B51 microscope and pictures taken on an Olympus U-TVO.5×c camera with MagnaFire. The follow-ing antibodies were utilized: AFP (A0008; Dako, Glostrup, Denmark), Ki67 (556003; BD Pharmingen, Franklin Lakes, NJ), and CYP3A2 (20R-CR055; Fitzgerald Industries Inter-national, North Acton, MA). The OV-6 antibody was donated by Dr Stewart Sell (Ordway Research Institute, Albany, NY). Antibody isotype controls are shown in the supplementary Figures.
Western blotting
Protein was isolated from snap-frozen liver tissue and run on 10% polyacrylamide gel. Following transfer to a polyvinylidene fluoride membrane, blots were blocked and incubated with primary antibody O/N at 4°C. After incubation with the appropriate horseradish peroxidase-conjugated secondary, blots were developed using the ECL Plus Western Blotting Detection System (Amersham, Piscat-away, NJ). The following antibodies were utilized: Notch1 (2421; Cell Signaling), CK19 (MAB1675; Millipore), CD133 (sc-23797), hepatocyte nuclear factor (HNF)-1β (sc-7411), G6Pase-α (sc-27198), and p21Waf1 (sc-6246) from Santa Cruz,
and β-actin (ab3280–500; Abcam). All semiquantitative densitometric analyses were performed on BioRad Quantity One 1-D analysis software (v.4.6.1; BioRad, Hercules, CA) as per the manufacturer’s instructions.
Real-time polymerase chain reaction
analysis of mRnA expression
Quantitative polymerase chain reaction was performed using the SA Biosciences Stem Cell SuperArray. Total RNA (SA Biosciences, Germantown, MD) was isolated from snap-frozen liver tissue using RNA-Bee Reagent (Tel-Test Inc., Maumee, OH) as per the manufacturer’s instructions. cDNA was generated using the SuperScript III First Strand Syn-thesis System (Invitrogen, Carlsbad, CA) according to the
manufacturer’s instructions. The standard conditions used for real-time polymerase chain reaction were as follows: 95°C for 10 minutes, followed by 40 cycles of 15 sec of denaturation at 95°C, and 30 sec annealing/elongation at 55°C. SYBR®
Green signal was measured in each step, and each sample normalized to β-actin as an internal control. Mean fold gene expression was calculated with SA Biosciences software using the Delta Delta CCT method as per the manufacturer’s instructions.
statistical analysis
Results are presented as mean (± standard deviation [SD]), and all data shown were compiled from three separate experiments. A two-way analysis of variance was used to analyze the independent role of categoric parameters. Values were regarded as significant at P , 0.05; all error bars represent SDs.
Results
Oval cell activation and inhibition
of notch signaling during 2AAF-PH
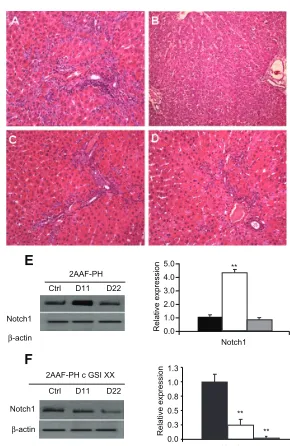
It has been well documented in the literature that regeneration of the liver upon 2AAF-PH treatment leads to the induction of small “stem” cells with an oval shape, which are easily distinguishable from hepatocytes. Histologic analysis of sections from livers of animals on the 2-AAF-PH protocol shows a robust activation of oval cells in the periportal regions on day 11 post-PH (Figure 1A). These oval cells generally differentiate into hepatocytes or cholangiocytes by day 22 post-PH (Figure 1B), giving the liver a typically “normal” phenotype. Control hematoxylin and eosin staining can be seen in supplementary Figure 1.
The enzyme responsible for the cleavage and subsequent activation of the Notch receptor is γ-secretase. Administration of GSI XX prevents this cleavage and thereby terminates the Notch signal before it is able to take effect in the nucleus. To examine the effects of Notch inhibition during 2AAF-PH, animals were injected with GSI XX, and the oval cell response was examined at day 11 following PH. Hematoxylin and eosin staining shows that there is still a robust activation of the oval cell compartment at day 11 post-PH upon treatment with GSI XX (Figure 1C). There does appear to be a higher infiltrate of immune cells (small, dark, punctuate cells) in the GSI XX-treated group at day 11 than for 2AAF-PH alone. This is likely due to the methylcellulose solution used to deliver the inhibitor, as previously described.8 In contrast
with 2AAF-PH alone, there are a significant number of oval cells remaining in the periportal regions of the liver at day 22
Hepatic Medicine: Evidence and Research downloaded from https://www.dovepress.com/ by 118.70.13.36 on 22-Aug-2020
Dovepress
Darwiche et al
post-PH (Figure 1D), indicative of incomplete differentia-tion of the oval cells into a mature phenotype. No immune infiltrate remains in the periportal regions of the liver by this time point.
To confirm termination of the Notch signal, Western analysis with an antibody specific to the NICD, or the cleaved form of Notch1 (Val1774), was performed. In the 2AAF-PH group, levels of cleaved Notch1 significantly increase at day 11 and drop down to basal levels by day 22 post-PH (as veri-fied by semiquantitative analysis, Figure 1E; P , 0.01). How-ever, levels of cleaved Notch1 were markedly decreased in the GSI XX-treated group as compared with 2AAF-PH alone, as
seen at day 11 (Figure 1F). These data demonstrate that the peak of oval cell induction is concurrent with activation of the Notch1 signaling cascade, and that treatment with GSI XX effectively terminates the Notch signal.
To demonstrate downregulation of Notch signaling via GSI XX further, we performed a real time polymerase chain reaction analysis of mRNA isolated from livers of animals on the 2AAF-PH protocol, both with and without inhibitor treatment. Figure 2 shows graphic representations of the fold change in expression of Notch pathway genes during 2AAF-PH alone (Figure 2A) as well as in combination with GSI XX treatment (Figure 2B; P , 0.01). Notch1 expression levels increase significantly at day 11 post-PH as compared with controls and day 22 post-PH in both groups. Because the inhibitor targets Notch at the protein level, we do not expect to see a decrease in Notch gene expression at day 11 in the GSI XX treatment group, but should see a change in expres-sion levels of downstream effectors. As expected, Hes1 was found to be dramatically upregulated at day 11 as compared with control during 2AAF-PH alone. However, in the GSI XX treatment group, no such increase in Hes1 expression was seen, demonstrating interruption of the Notch signal.
Because γ-secretase has recently been shown to target other signaling pathways, such as hepatic growth factor (HGF), we performed immunohistochemical analysis to
A B
C
E
F
D
2AAF-PH
2AAF-PH c GSI XX Ctrl
Notch1
Notch1
Notch1 β-actin
Notch1
β-actin
D11 D22
Ctrl D11 D22
0.0 1.0 2.0 3.0 4.0 5.0
Relative expression
Relative expression
**
**
** 0.0
0.3 0.5 0.8 1.0 1.3
Figure 1 Hepatic oval cell activation and detection of notch expression.
A) Representative hematoxylin and eosin staining of liver section taken from animals on the 2AAF-PH protocol alone on day 11 post-PH. B) Representative hematoxylin and eosin staining of liver section taken from animals on the 2AAF-PH protocol alone on day 22 post-PH. C) Representative hematoxylin and eosin staining of day 11 liver section taken from animals on the 2AAF-PH protocol and treated with gsi XX. D) Representative hematoxylin and eosin staining of day 22 liver section taken from animals on the 2AAF-PH protocol and treated with gsi XX. in A, C, and
D, “streaming” oval cells (black arrows) can be seen between portal triads (periportal regions); this phenomenon is absent in B, where the oval cells have differentiated into mature lineages by day 22 post-PH. in C, the white arrow indicates cells part
of the immune infiltrate (small, dark, punctate cells), which have mostly disappeared
by day 22 (D) because the vehicle/inhibitor have been processed out of the liver.
E) Left: Western blot analysis performed on protein isolated from liver taken at day
11 and day 22 post-PH alone with an antibody specific for the NICD, or cleaved
(activated) portion of the notch1 receptor. Right: semiquantitative analysis of notch1 protein in the 2AAF-PH alone group for control, day 11 post-PH, and day 22 post-PH samples. Expression was normalized to β-actin and significance calculated
compared with control animals. *P, 0.01. F) Left: Western blot analysis performed on protein isolated from liver taken at day 11 and day 22 post-2AAF-PH with an
antibody specific for NICD, or cleaved (activated) portion of the Notch1 receptor.
Right: semiquantitative analysis of notch1 protein in control, day 11 post-PH, and day 22 post-2AAF-PH livers from animals treated with gsi XX. Expression was normalized to β-actin and significance calculated compared with control animals.
*P, 0.01. A–D 200×.
Abbreviations: nicD,notch intracellular cytoplasmic domain; gsi XX, γ-secretase
inhibitor; PH, partial hepatectomy; 2AAF-PH, 2-acetylaminofluorine implantation
followed by 70% surgical resection of the liver.
* *
Ctrl D11 D22
Ctrl D11 D22
Notch1 Notch2 Hes1a
2AAF-PH
Notch1 Notch2 Hes1a
2AAF-PH with GSIXX
Fold change in mRN
A
expression
0.00 2.00 4.00 6.00 8.00 10.00 12.00
Fold change in mRN
A
expressio
n
0.00 2.00 4.00 6.00 8.00 10.00 12.00
Figure 2 Real-time PcR analysis of notch pathway genes. A) Quantitative real-time polymerase chain reaction analysis shows an increase in notch1 gene expression at day 11 post-PH in livers isolated from animals on the 2AAF-PH protocol as compared with controls. notch1 expression returns to near normal levels by day 22 post-PH. This expression pattern is also seen when 2AAF-PH is combined with gsi XX treatments, B) as the inhibitor targets the signal at the protein level. A similar expression pattern is seen for downstream effector Hes1, which dramatically increases at day 11 post-PH alone and returns to basal levels by day 22 post-PH
alone. Hes1 was found to be significantly downregulated at day 11 post-PH in the
gsi XX-treated group as compared with 2AAF-PH alone. gene expression was normalized to β-actin and significance calculated compared with control animals.
*P, 0.01; error bars, sD.
Abbreviations: gsiXX, γ-secretase inhibitor; PH, partial hepatectomy; 2AAF-PH,
2-acetylaminofluorine implantation followed by 70% surgical resection of the liver;
PcR, polymerase chain reaction; sD, standard deviation.
Hepatic Medicine: Evidence and Research downloaded from https://www.dovepress.com/ by 118.70.13.36 on 22-Aug-2020
Dovepress notch in oval cell-mediated liver regeneration
confirm that the effects were a result of Notch inhibition rather than HGF (Supplementary Figure 3). No significant difference in HGF expression was seen in the group treated with 2AAF-PH alone as opposed to 2AAF-PH combined with GSI XX, indicating that HGF signaling is likely not responsible for the effects seen in oval cell-mediated liver regeneration upon treatment with GSI XX.
characterization of oval cell response
during gsi XX treatment
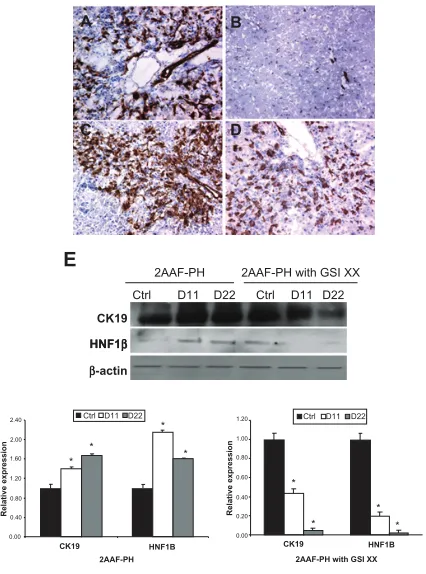
To characterize the oval cell response when Notch signaling is inhibited, we examined the expression levels of such markers as OV-6 and CK19, and during 2AAF-PH combined with GSI XX treatment. Immunohistochemical analysis of OV-6 expression demonstrates the activation of oval cells in the periportal regions in response to injury at day 11 post-PH alone (Figure 3A), as well as when 2AAF-PH is combined with GSI XX treatment (Figure 3C). However, when Notch signaling is terminated, OV-6 positive cells persist out to day 22 post-PH (Figure 3D), whereas no OV-6 positive cells remain by day 22 during 2AAF-PH alone (Figure 3B).
Because it appeared morphologically, as well as by OV-6 staining, that termination of the Notch signal had an inhibitory effect on the differentiation capacity of oval cells, we decided to investigate other markers of differentiation. Western blot analysis of protein isolated from livers of GSI XX-treated animals demonstrated a dramatic decrease in levels of the biliary marker, CK19, upon treatment with GSI XX at day 22 as compared with 2AAF-PH alone (Fig-ure 3E). We therefore also examined levels of HNF-1β, a transcription factor regulated by Notch signaling and involved specifically in biliary differentiation. Western blot analysis reveals a marked downregulation in the expression of this factor during oval cell-mediated liver regeneration when Notch signaling was downregulated (Figure 3E).
Further evidence of this abnormal oval cell differentiation is exhibited in the staining for AFP. Note the typical elevated level of expression at day 11 post-PH both with and without GSI XX treatment (Figure 4A and 4C), but also that there is minimal AFP expression at day 22 when Notch is inhibited (Figure 4D) as compared with 2AAF-PH alone (Figure 4B). This lack of AFP expression is echoed at the gene level, where mRNA expression of AFP at day 22 in the GSI XX-treated group is almost equivalent to control (Figure 4E). The fact that the cells produced here are OV-6 positive and AFP-negative by day 22 post-PH is indicative of a short-circuiting within the differentiation programming of these progenitors when Notch signaling is inactivated. Morphologic evidence, as
well as the aberrant immunohistochemical staining patterns exhibited at day 22 in the GSI XX-treated group, are evidence that dysregulation of the Notch pathway results in a delay in the differentiation of activated oval cells.
inhibition of notch signaling promotes
cell cycle progression and enhances
proliferation
There have been conflicting reports in the literature describing the effects of Notch downregulation on proliferation,
E A
C D
B
2AAF-PH Ctrl
Ctrl
0.00 0.40 0.80 1.20 1.60 2.00 2.40
* *
*
*
Relative expressio
n
CK19
HNF1β
HNF1β
Ctrl
D11 D22 D11 D22
D11 D22 Ctrl D11 D22
2AAF-PH with GSI XX
β-actin
Relative expression
CK19 HNF1B
2AAF-PH 2AAF-PH with GSI XX
CK19 HNF1B
*
* *
*
0.00 0.20 0.40 0.60 0.80 1.00 1.20
Figure 3 Analysis of oval cell surface marker expression upon notch inhibition.
A–D) immunohistochemical analysis of OV-6 expression during 2AAF-PH alone (A and B) and in combination with gsi XX treatment (C and D). in the 2AAF-PH group, there is a dramatic increase in OV-6 expression at day 11 post-PH (A), which drops back down by day 22 post-PH (B), because all the oval cells have differentiated into mature phenotypes by this point. in the gsi XX-treated group similar levels of OV-6 expression are seen at day 11 post-PH (C), but a significant amount of staining
remains at day 22 post-PH when notch signaling is inhibited (D). E) Western blot analysis performed on protein isolated from liver taken at day 11 and day 22
post-PH from both treatment groups and probed with an antibody specific for the biliary
markers cK19 and HnF-1β. During 2AAF-PH alone, expression of cK19 increases at day 11 post-PH and stays elevated by day 22 post-PH, indicative of biliary differentiation in the regenerated liver. However in the gsi XX-treated group,
there is not as significant an increase in CK19 levels at day 11, a difference that is
even more pronounced in the day 22 post-PH sample. similar analysis performed
with an antibody specific for HNF-1β shows a stark downregulation of the biliary
transcription factor at both days 11 and 22 post-PH in the gsi XX-treated group as compared with 2AAF-PH alone. Bottom: semiquantitative analysis of cK19 and HnF-1β protein in both treatment groups for control, day 11 post-PH, and day 22 post-PH samples. Expression was normalized to β-actin and significance calculated
compared with control animals.
Notes: *P, 0.01, error bars, sD.
Abbreviations: gsiXX, γ-secretase inhibitor; PH, partial hepatectomy; 2AAF-PH,
2-acetylaminofluorine implantation followed by 70% surgical resection of the liver;
sD, standard deviation; HnF, hepatocyte nuclear factor.
Hepatic Medicine: Evidence and Research downloaded from https://www.dovepress.com/ by 118.70.13.36 on 22-Aug-2020
Dovepress
Darwiche et al
particularly in the liver. We therefore examined cell cycle progression and growth during regeneration by analysis of the hepatocellular mitoinhibition index, a ratio between expression of p21Waf1 (cell cycle inhibitor) and
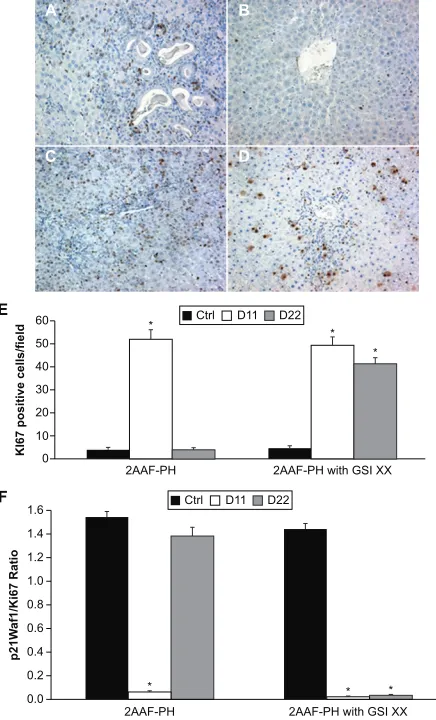
Ki67 (a marker of cellular proliferation). Figure 5A shows a mass of proliferating cells by Ki67 staining at day 11 post-PH during 2AAF-PH alone, with a similar response seen during 2AAF-PH combined with GSI XX treatment (Figure 5C). While the cells remaining at day 22 post-PH alone (Figure 5B) have ceased proliferating, the hepatocytes seen at this time point appear to remain mitotically active when Notch signaling is terminated (Figure 5D). Semiquantitative analysis of these data can be seen in Figure 6E, demonstrating the enhanced effects on proliferation seen during Notch inhibition.
To determine fully the extent of growth during 2AAF-PH with and without GSI XX, we examined the hepatocellular
mitoinhibition index. This ratio of replicative arrest/ proliferation was determined by dividing the number of p21-positive nuclei by the number of Ki67-positive nuclei. This ratio was found to be significantly different between the two groups at both day 11 and day 22 post-PH (Figure 6F),
P , 0.01. These results demonstrate that diminished Notch signaling leads to dysregulation of factors that works to promote cell cycle progression and proliferation during regeneration of the liver.
NRL 0.00
Fold change in AFP mRN
A
expression 2.004.00
6.00 8.00 10.00 12.00
2AAF-PH
E
A B
C D
2AAF-PH c GSIXX
* *
D11 D22
Figure 4 Aberrant AFP expression profiles in the absence of Notch.
A–D) immunohistochemical analysis of AFP expression at days 11 and 22 post-PH during 2AAF-PH alone (A and B) as well as in combination with gsi XX treatment (C and D). As seen with the OV-6 staining in the 2AAF-PH group, there is a dramatic increase in AFP expression at day 11 post-PH (A) which drops back down by day 22 post-PH (B). However, in the gsi XX-treated group, although there is a rise in AFP expression at day 11 (C), there is no apparent AFP staining in the oval cells present at day 22 post-PH (D). E) Quantitative real-time polymerase chain reaction analysis for AFP mRnA expression at days 11 and 22 in livers from animals treated with 2AAF-PH alone or 2AAF-PH combined with gsi XX. mRnA expression follows a similar pattern to the protein expression shown via immunohistochemistry above, where AFP increases at day 11 and is virtually nonexistent at day 22 in both treatment groups. A–D 200×.
Abbreviations: gsi XX, γ-secretase inhibitor; PH, partial hepatectomy; 2AAF-PH,
2-acetylaminofluorine implantation followed by 70% surgical resection of the liver;
AFP, alpha-fetoprotein.
0
0.0 0.2 0.4
p21W
af1/Ki67 Ratio 0.6 0.8 1.0 1.2 1.4 1.6
2AAF-PH 2AAF-PH with GSI XX
2AAF-PH 2AAF-PH with GSI XX 10
KI67 positive cells/field
20 30 40 50 60
E
F
Ctrl
A B
C D
*
* * *
* * D11 D22
Ctrl D11 D22
Figure 5 inhibition of notch signaling enhances proliferative capacity.
A–D) immunohistochemical analysis of Ki67 expression at days 11 and 22 post-PH in both treatment groups, 2AAF-PH alone (A and B) as well as in combination with gsi XX treatment (C and D). in the 2AAF-PH group, there is a dramatic increase in Ki67 expression at day 11 PH (A), which drops back down by day 22 post-PH (B), because the regeneration process has generally been completed by this point. in the gsi XX-treated group, similar levels of Ki67 staining are seen at day 11 post-PH (C), but this elevated expression level remains at day 22 post-PH when notch signaling is inhibited (D). E) semiquantitative analysis of Ki67 positivity in both treatment groups for control, day 11 post-PH, and day 22 post-PH samples,
showing the number of Ki67-positive cells per field. F) Hepatocellular mitoinhibition
index, determined by the ratio of p21Waf1:Ki67 (replicative arrest:proliferation).
Notes: This index is drastically reduced in the gsi XX-treated group as compared
with 2AAF-PH alone. Significance was calculated compared with control animals.
*P, 0.01. A–D 200×.
Abbreviations: gsiXX, γ-secretase inhibitor; PH, partial hepatectomy; 2AAF-PH,
2-acetylaminofluorine implantation followed by 70% surgical resection of the liver.
Hepatic Medicine: Evidence and Research downloaded from https://www.dovepress.com/ by 118.70.13.36 on 22-Aug-2020
Dovepress notch in oval cell-mediated liver regeneration
Downregulation of notch signaling
produces functionally impaired
hepatocytes
Mature hepatocytes are responsible for carrying out the functions of the liver that are required for homeostasis.
Typically during 2AAF-PH treatment alone, the hepatocytes produced in response to the injury were mature and functional by day 22 post-PH. However, when Notch signaling was inhibited, the activated oval cells did not properly differen-tiate into a mature phenotype. We therefore examined the functional characteristics of the hepatocytes produced in the two treatment groups.
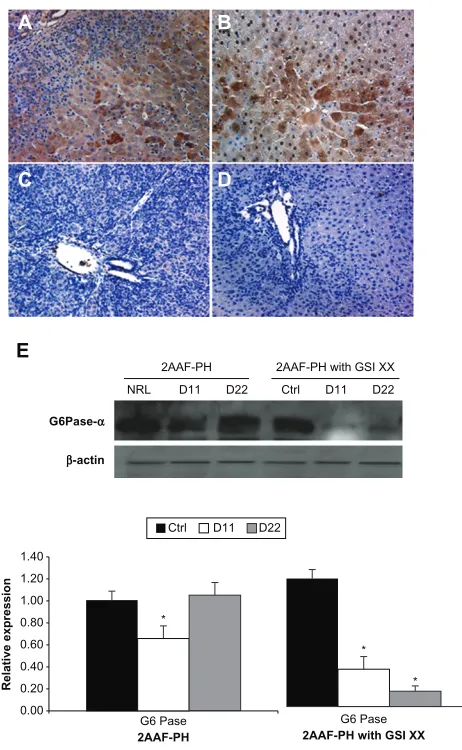
Immunohistochemical analysis of CYP3A2, an isoform of cytochrome P450 expressed by mature hepatocytes, shows a typical decrease in expression at day 11 post-PH, with an upsurge back to basal levels by day 22 post-PH (Figure 6A and 6B). However, in the GSI-treated group, there is a dras-tic decrease in CYP3A2 expression at day 11 that remains in effect through day 22 post-PH (Figure 6C and 6D). The downregulation of CYP has been previously documented in other tissue systems when Notch signaling was inactivated.20
Moreover, analysis of G6Pase-α expression via Western blotting reveals a dramatic decrease in the amount of enzyme being expressed (Figure 6E) after GSI XX treatment as compared with 2AAF-PH alone. These results are indica-tive of altered glucose metabolism and call into question the functionality of the hepatocytes present at day 22.
Discussion
Notch is an evolutionarily conserved local cell-signaling mechanism that participates in the regulation of cell fate specification, cellular growth, and proliferation.21 Here we
have demonstrated activation of the Notch pathway during liver regeneration mediated by oval cells via the 2AAF-PH protocol, as well as showing that Notch inhibition during 2AAF-PH has significant consequences for liver regenera-tion. The data presented here provide novel evidence that Notch signaling is necessary in order for proper regulation of oval cell differentiation to occur, and further implies Notch signaling in a functional capacity with regard to the progeny produced by the activated oval cells.
Here we demonstrate disruption of the Notch signal upon treatment by both a decrease in activated Notch receptor, as well as by a decrease in expression of the downstream effector Hes1. Because GSI XX targets all forms of Notch receptor, functional redundancy of the receptor/ligand is not called into question. It has been shown that when Notch signaling is upregulated during 2AAF-PH, the bipotential oval cells do take on both hepatocyte and cholangiocyte fates. However, in the absence of the signal, the number of oval cells committed to primary versus secondary fates is altered. Morphologic analysis of GSI XX-treated samples shows incomplete differentiation of oval cells into mature
0.00
G6 Pase Ctrl
G6Pase-α
2AAF-PH 2AAF-PH with GSI XX NRL D11 D22 Ctrl D11 D22
E
A B
C D
β-actin
D11 D22
G6 Pase
2AAF-PH 2AAF-PH with GSI XX
0.20
Relative expression
0.40 0.60 0.80 1.00 1.20 1.40
*
*
*
Figure 6 Lack of notch expression leads to generation of functionally impaired hepatocytes. A–D) immunohistochemical analysis of cYP3A2 expression at days 11 and 22 post-PH in both treatment groups, 2AAF-PH alone (A and B), as well as in combination with gsi XX treatment (C and D). in the 2AAF-PH group, there is a small amount of cYP3A2 expression at day 11 post-PH (A), which has
significantly increased by day 22 post-PH (B), because the regeneration process has
generally been completed by this point. in the gsi XX-treated group absolutely no cYP3A2 staining is seen at day 11 post-PH (C), and the levels increase only minimally by day 22 post-PH when notch signaling is inhibited (D). A–D 200×.
E) Top: Western analysis performed on protein isolated from liver taken at day 11 and day 22 post-PH from both treatment groups and probed with an antibody
specific for the enzyme G6Pase-α. During 2AAF-PH alone, expression of g6Pase-α
increases at day 11 post-PH and is even further elevated by day 22 post-PH, indicative of the formation of mature and functional hepatocytes. However, in
the GSI XX-treated group, there is not as significant an increase in G6Pase-α
levels at day 11, a difference that is even more pronounced in the day 22 post-PH sample. Bottom: semiquantitative analysis of g6Pase-α protein in both treatment groups for control, day 11 post-PH, and day 22 post-PH samples. Expression was normalized to β-actin and significance calculated compared with control animals.
Notes: *P, 0.01.
Abbreviations: GSI XX, γ-secretase inhibitor; PH, partial hepatectomy; 2AAF-PH,
2-acetylaminofluorine implantation followed by 70% surgical resection of the liver;
g6Pase-α, glucose-6-phosphatase-α.
Hepatic Medicine: Evidence and Research downloaded from https://www.dovepress.com/ by 118.70.13.36 on 22-Aug-2020
Dovepress
Darwiche et al
lineages upon regeneration after 2AAF-PH, an idea that is further supported by persistent expression of oval cell markers OV-6 and AFP at day 22 post-PH.
The abnormal expression levels of CK19 and HNF-1β
are also suggestive of an asynchronous differentiation response by these oval cells, potentially skewing the ratio of differentiating oval cells in favor of one fate versus another (ie, hepatocyte versus biliary). It is possible that the absence of the appropriate signal (eg, Notch) forces the oval cells to choose a primary fate, but upon making that choice, the cells find that they are incapable of differentiating fully into that functional phenotype. Because CK19 is expressed by mature bile duct cells as well as oval cells, it is possible that the upregulation of CK19 seen at day 22 post-PH in the GSI-treated group is due to increased proliferation of mature bile duct cells. However, this is unlikely because liver sections from the GSI XX-treated group did not show any remarkable change in bile duct quantity/morphology versus liver sections from 2AAF-PH alone.
The cells present at day 22 post-PH after Notch inhibition were negative for functional markers of maturity, such as CYP and G6Pase-α. This demonstrates a stunted attempt at differentiation and indicates that Notch is required for functional differentiation of oval cells during regeneration of the liver following 2AAF-PH. More specifically, it can be concluded that Notch signaling is necessary for the appropriate ratio of progenitors to assume primary versus secondary phenotypes (hepatocyte versus biliary, respectively).
In 2004 Tanimizu et al published work demonstrating that expression of NICD in progenitors inhibits the differentiation leading to hepatocytes and induces characteristics of cholangiocytes.22 Furthermore, studies performed by
Zong et al provide evidence that hepatocytes retain biliary competence in response to Notch signals, suggesting that hepatobiliary remodeling after injury is regulated by Notch.23 The data presented in our paper corroborate these
results, and we have outlined our interpretation of Notch involvement in oval cell differentiation during 2AAF-PH in Figure 7, which diagrams the general effects of an increase or decrease in Notch signaling on the process of oval cell fate determination.
In the last decade, conflicting reports have been seen in the literature describing the effects of Notch signaling on proliferation, particularly in the liver. For example, a study by Kohler et al suggests that Notch1 inactivation has a direct role in inhibiting hepatocyte proliferation.24 In contrast, another
study by Croquelois et al suggests that Notch signaling plays
a role in promoting rather than inhibiting regeneration and proliferation.25 Our experiments provide further evidence
of the necessity for Notch signaling in regulation of these processes. Inhibition of Notch during oval cell-mediated regeneration resulted in an aberrant hepatocellular mitoinhi-bition index (p21Waf1:Ki67) after regeneration. It is likely that
the absence of Notch1 during regeneration leads to altered cell cycle regulation, particularly because differentiation and transition through cell cycle checkpoints are closely linked. In fact, studies performed by Carlesso et al show that the relative proportion of cells in specific phases of the cell cycle were consistently altered in the presence of activated Notch1.26 Conversely, it is completely plausible that
inhibi-tion of Notch1 would also lead to a visible change in cell cycle kinetics during oval cell-mediated liver regeneration, allowing for increased cell cycle progression. This idea is supported by decreased expression of p21 and increased expression of p-AKT (data not shown). It has further been suggested that results such as these, along with the function of Notch1 to inhibit hepatocyte proliferation under nonpatho-logic conditions, could mean that Notch signaling is part of a tumor suppressor-like program in the liver.25 Although no data
have been provided to show that Notch1 inactivation leads to the development of carcinoma in the liver, determining if depletion of Notch signaling promotes tumorigenesis could prove to be an exciting avenue to pursue.
Because Notch is known to be involved in the mediation of binary cell fate decisions in other systems,27–30 it is
logi-cal to conclude that interruption of the signal would lead to impaired integration of cellular fate by the activated oval
Normal 2AAF/PH: Notchactivation 2AAF/PH: Notchinhibition
Bipotential cell
↑Notch ↑Notch
1° Cell fate 2° Cell fate 1° Cell fate/ Hepatocyte Cholangiocyte2° Cell fate/
Stunted differentiation
Oval cell Oval cell
Figure 7 Regulation of hepatic oval cell differentiation via notch signaling. Diagram depicting the involvement of notch signaling in the differentiation of stem/progenitor cells. Left: in the case of a general bipotential cell, the up- or downregulation of notch signaling decides the fate of that cell. in the absence of the notch signal, the cell will assume a primary fate; however, when notch signaling is activated, that cell will develop into the secondary phenotype. Middle: Applying this concept to the
oval cell system during liver regeneration, we find that Notch signaling is necessary
for the proper ratio of differentiation to occur. When notch signaling is active, we see the oval cells assuming both hepatocyte and cholangiocyte phenotypes, but in the absence of the signal. Right: Proper maturation fails to occur, an apparent arrest in the differentiation capacity of the oval cells.
Hepatic Medicine: Evidence and Research downloaded from https://www.dovepress.com/ by 118.70.13.36 on 22-Aug-2020
Dovepress notch in oval cell-mediated liver regeneration
cells. However, much remains to be understood about the mechanisms by which Notch signaling regulates oval cell development and growth. Our studies provide evidence that Notch signaling is activated and plays an important role in the differentiation and proliferation of oval cells after 2AAF-PH. Moreover, the data presented here demonstrate that when Notch signaling is inhibited, other downstream signals are also influenced, thereby leaving the newly formed hepatocytes functionally deficient. Further studies will be required to delineate fully the effects of Notch signaling on these processes.
Acknowledgments
The authors thank Alicia Brown and Marda Jorgenson for their intellectual and technical contributions to these studies. The work was supported by National Institute of Health grants DK60015 and DK58614 awarded to BEP.
Disclosure
The authors report no conflicts of interest in this work.
References
1. Artavanis-Tsakonas S, Matsuno K, Fortini ME. Notch signaling.
Science. 1995;268:225–232.
2. Artavanis-Tsakonas S, Rand MD, Lake RJ. Notch signaling: Cell fate control and signal integration in development. Science. 1999;284: 770–776.
3. Meile L, Osborne BA. Arbiter of differentiation: Notch signaling meets apoptosis. J Cell Physiol. 1999;181:393–409.
4. Milner LA, Bigas A. Notch as a mediator of cell fate determination in hematopoiesis: Evidence and speculation. Blood. 1999;93: 2431–2448.
5. Weinmaster G. Notch signal transduction: A real rip and more. Curr
Opin Genet Dev. 2000;10:363–369.
6. Blaumueller CM, Qu H, Zagouras P, Artavanis-Tsakonas S. Intracellular cleavage of notch leads to a heterodimeric receptor on the plasma membrane. Cell. 1997;90:281–291.
7. Schroeter EH, Kisslinger JA, Kopan R. Notch1 signaling requires lingand-induced proteolytic release of the intracellular domain. Nature. 1998;393:382–386.
8. Niranjan T, Bielesz G, Gruenwald A, et al. The Notch pathway in podocytes plays a role in the development of glomerular disease. Nat
Med. 2008;14:290–298.
9. Milano J, McKay J, Dagenais C, et al. Modulation of Notch process-ing by γ-secretase inhibitors causes intestinal goblet cell metaplasia and induction of genes known to specify gut secretory lineage differentiation. Toxicol Sci. 2004;82:341–358.
10. van Es JH, van Gijn ME, Riccio O, et al. Notch/γ-secretase inhibition turns proliferative cells in intestinal crypts and adenomas into goblet cells. Nature. 2005;435:959–963.
11. Baldi A, de Falco M, de Luca L, et al. Characterization of tissue-specific expression of Notch-1 in human tissues. Biol Cell. 2004;96:303–311. 12. Fausto N, Campbell JS. The role of hepatocytes and oval cells in liver
regeneration and repopulation. Mech Dev. 2003;120:117–130. 13. Petersen BE, Bowen WC, Patrene KD, et al. Bone marrow as a potential
source of hepatic oval cells. Science. 1999;284:1168–1170.
14. Sicklick JK, Li YX, Melhem A, et al. Hedgehog signaling maintains resident hepatic progenitors throughout life. Am J Physiol Gastrointest
Liver Physiol. 2006;290:G859–G870.
15. Faris RA, Monfils BA, Funsford HA, Hixson DC. Antigenic relationship between oval cells and subpopulation of hepatic foci, nodules, and carcinomas inducted by the “resistant hepatocyte” model system.
Cancer Res. 1991;51:1308–1317.
16. Crosby HA, Nijjar SS, de Goyet JV, Kelly DA, Strain AJ. Progenitor cells of the biliary epithelial cell lineage. Semin Cell Dev Biol. 2002;13: 397–403.
17. Newsome PN, Hussain MA, Thiese ND. Hepatic oval cells: Helping redefine a paradigm in stem cell biology. Curr Top Dev Biol. 2004; 61:1–28.
18. Oh SH, Hatch HM, Petersen BE. Hepatic oval “stem” cell in liver regeneration. Semin Cell Dev Biol. 2002;13:405–409.
19. Higgins GM, Anderson RM. Experimental pathology of the liver: Restoration of the liver of the white rat following partial surgical removal. Arch Pathol. 1931;12:186–202.
20. Rodriguez S, Sickles HM, Deleonardis C, et al. Notch2 is required for maintaining sustentacular cell function in the adult mouse main olfactory epithelium. Dev Biol. 2008;314:40–58.
21. Ehebauer M, Hayward P, Arias AM. Notch, a universal arbiter of cell fate decisions. Science. 2006;314:1414–1415.
22. Tanimizu N, Miyajima A. Notch signaling controls hepatoblast differentiation by altering the expression of liver-enriched transcription factors. J Cell Sci. 2004;117:3165–3174.
23. Zong Y, Panikkar A, Xu J, et al. Notch signaling controls liver development by regulating biliary differentiation. Development. 2009; 136:1727–1739.
24. Kohler C, Bell AW, Bowen WC, Monga SP, Fleig W, Michaelopoulos GK. Expression of Notch-2 and its ligands Jagged-1 in rat liver during liver regeneration. Hepatology. 2004;39:1056–1065.
25. Croquelois A, Blindenbacher A, Terracciano L, et al. Inducible inactivation of Notch1 causes nodular regenerative hyperplasia in mice. Hepatology. 2005;41:487–496.
26. Carlesso N, Aster JC, Sklar J, Scadden DT. Notch1-induced delay of hematopoietic progenitor cell differentiation is associated with altered cell cycle kinetics. Blood. 1999;93:838–848.
27. Fortini ME, Artavanis-Tsakonas S. Neurogenesis is only part of the picture. Cell. 1993;75:1245–1247.
28. Egan SE, St Pierre B, Leow CC. Notch receptors, partners, and regulators: From conserved domains to powerful functions. Curr Top
Microbiol Immunol. 1998;228:273–324.
29. Dainiak N. Surface membrane-associated regulation of cell assembly, differentiation, and growth. Blood. 1991;78:264–276.
30. Greenwald I, Ruben GM. Making a difference: The role of cell-cell interactions in establishing separate identities for equivalent cells. Cell. 1992;68:271–281.
Hepatic Medicine: Evidence and Research downloaded from https://www.dovepress.com/ by 118.70.13.36 on 22-Aug-2020
Hepatic Medicine: Evidence and Research
Publish your work in this journal
Submit your manuscript here: http://www.dovepress.com/hepatic-medicine-evidence-and-research-journal Hepatic Medicine: Evidence and Research is an international,
peer-reviewed, open access journal covering all aspects of adult and pedi-atric hepatology in the clinic and laboratory including the following topics: Pathology, pathophysiology of hepatic disease; Investigation and treatment of hepatic disease; Pharmacology of drugs used for
the treatment of hepatic disease. Issues of patient safety and quality of care will also be considered. The manuscript management system is completely online and includes a very quick and fair peer-review system, which is all easy to use. Visit http://www.dovepress.com/ testimonials.php to read real quotes from published authors.
Dovepress
Dove
press
Darwiche et al
−7 7 11
Days 2/3 PH
Injection of GSIXX
Date of sacrifice 2AAF
↓
↓
14 22
0
Figure S1 Diagram of experimental methods. graphical representation of methods,
including 2-acetylaminofluorine pellet implantation, two-thirds partial hepatectomy,
injections of γ-secretase inhibitor, and dates of animal sacrifice.
Figure S2 control immunohistochemistry for both treatment groups immuno-histochemical analysis of control samples for both treatment groups (2AAF-PH alone (left panels) as well as in combination with gsi XX treatment (right panels).
A) and B) hematoxylin and eosin; C) and D) OV-6; E) and F) AFP; G) and H) Ki67;
I) and J) cYP3A2. The hematoxylin and eosin staining compares sections from normal liver (A) with vehicle-only treated liver (B). in the case of both OV-6 and AFP, there is no (or minimal) expression seen for both control samples as expected. controls for both treatment groups showed just a small bit of positivity for Ki67, showing that only a very small percentage of cells are proliferating at this stage of regeneration. in the case of cYP3A2, a mature hepatocyte marker, there is robust expression by a majority of hepatocytes in both control groups, indicative of cellular maturity as well as functionality. A–J 200×.
Abbreviations: gsiXX, γ-secretase inhibitor; PH, partial hepatectomy; 2AAF-PH,
2-acetylaminofluorine implantation followed by 70% surgical resection of the liver;
AFP, alpha-fetoprotein.
Figure S3 immunohistochemistry for HgF in both treatment groups. immuno-histochemical analysis of control samples for both treatment groups (2AAF-PH alone (left panels) as well as in combination with gsi XX treatment (right panels).
A) and B) control; C) and D) Day 11 post-PH; E) and F) Day 22 post-PH. There
appears to be no significant differences between the two groups at each individual
time point. A–F 200×.
Abbreviations: gsiXX, γ-secretase inhibitor; PH, partial hepatectomy; 2AAF-PH,
2-acetylaminofluorine implantation followed by 70% surgical resection of the liver;
HgF, hepatic growth factor.
Figure S4 Antibody isotype controls. immunohistochemical analysis of liver samples
to determine nonspecific antibody binding. Liver sections utilized were from
2AAF-PH treated animals at day 11. A) Mouse (OV-6, Ki67) B) Rabbit (AFP, cYP3A2).
A–B 200×.
Supplementary figures
Hepatic Medicine: Evidence and Research downloaded from https://www.dovepress.com/ by 118.70.13.36 on 22-Aug-2020