Comparative
in vivo
bioequivalence and
in vitro
dissolution of two valproic acid sustained-release
formulations
Akira Fujii1
Norio Yasui-Furukori1 Taku Nakagami1,3 Takenori Niioka4 Manabu Saito1,2 Yasushi Sato1,2 Sunao Kaneko1
1Department of Neuropsychiatry,
Hirosaki University School of Medicine, Hirosaki, Japan;
2Department of Psychiatry,
Hirosaki-Aiseikai Hospital, Hirosaki, Japan; 3Department
of Neuropsychiatry, Ohdate City Hospital, Ohdate, Akita, Japan;
4Department of Pharmacy, Hirosaki
University Hospital, Hirosaki, Japan
Correspondence: Norio Yasui-Furukori Department of Neuropsychiatry, Hirosaki University School of Medicine, Hirosaki 036-8562, Japan
Tel +81 172 39 5352 Fax +81 172 39 5352
Email [email protected]
Objective: A study was conducted to establish the bioequivalence between different sustained-release formulations of valproic acid (Depakene R and Selenica R), which were developed in Japan.
Materials and methods: The clinical investigation was designed in a randomized, cross-over fashion with a single dose given to 12 healthy subjects. The subjects were administered a single 600 mg dose of valproic acid in one of two formulations. Serial venous blood samples were obtained over 72 hours after each administration to measure valproic acid in serum by enzyme immunoassay (EIA). In addition, a dissolution test was performed. Each sample was analyzed by an high-performance liquid chromatography to determine the dissolution rate of valproic acid.
Results: No difference in maximum concentration or area under the curve was found between the two formulations. The time to maximum concentration of the new formation was signifi cantly delayed compared with the conventional formulation (10.8 ± 1.7 versus 17.6 ± 1.8 hours, p 0.001). Apparent clearance or elimination half-life did not differ between the two formulations. An in vitro dissolution study showed that Depakene R was signifi cantly more dissoluble than Selenica R.
Conclusion: Based on the results, the present study demonstrated a signifi cant difference between the two sustained-release formulations in the absorption profi le, and also demonstrated that the bioavailability of valproic acid in the two formulations was similar but absorption speed (lag time) was very different.
Keywords: bioequivalence, sustained-release, valproic acid, Depakene R, Selenica R
Introduction
Successful long-term treatment of patients with epilepsy requires selection of an appropriate antiepileptic regimen, optimal dosing and patient compliance (Pugh and Garnett 1991; Buck et al 1997). Sustained-release formulations of antiepileptic drugs can be very helpful in achieving treatment objectives. Stable serum levels without marked peak-to-trough fl uctuations, reduced frequency of dosing, and the possibility of dosing fl exibility may all improve compliance, patient satisfaction and, ultimately, quality of life (Bialer 1992; Cramer et al 1995; Pellock et al 2004).
proteins and has a relatively small volume of distribution. Its concentration in cerebral spinal fl uid is approximately one-tenth that in plasma and is directly correlated with the concentration found in tears. At therapeutic doses, valproic acid’s half-life varies from 10 to 20 hours in adults, while it is signifi cantly shorter (6 to 9 hours) in children (Zaccara et al 1988; Perucca 2002). Valproic acid undergoes extensive liver metabolism. Numerous metabolites have been positively identifi ed and there is reasonable evidence that several of them contribute to its pharmacological actions or toxicity (Zaccra et al 1988; Eadie 1991).
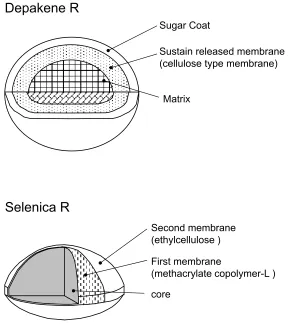
Valproic acid is available in different dosage forms for parenteral and oral use. All available oral formulations are almost completely bioavailable, but they differ in dissolution characteristics and absorption rates. The sustained-release formulation (Depakene R) can therefore be given once or twice daily (Doughty et al 2003; Genton 2005). The tablet core consists of a matrix structure that is covered with the sustained-released membrane. The elution of valproic acid is controlled as the substance passes through the core of the matrix structure and, further, through the sustained-released membrane.
Recently another sustained-release formulation containing 200 mg valproic acid (Selenica R) has been developed and is available in Japan (Fujisaki et al 2006). Selenica R has a double-coating system that provides a mechanism that is different from the conventional sustained-release formulation. Preclinical studies with healthy volunteers showed there are different pharmacokinetic properties between this new formulation and the conventional formulation (Pers comm.; Nikken Chemical Co., Tokyo, Japan). However, there is no information available on absorption profi les of these two formulations when directly compared. We therefore compared the pharmacokinetic parameters of the two valproic acid formulations in healthy subjects. A comparative study of the dissolution profi les between the two tablets was also carried out.
Methods
In vitro
dissolution test
A dissolution test was performed according to the procedure described in the JP Dissolution Test (paddle and beads method) (The Japanese Pharmacopeia 15th Edition, Japanese Ministry of Health, Labour and Welfare, http://www.mhlw. go.jp/topics/bukyoku/iyaku/yakkyoku/dl/060407-1.pdf). The paddle rotation speed was maintained at 50 rpm at 37 °C. Release test was carried out in 900 ml of pH 6.8 phosphate buffer (0.05 mol/L) using a dissolution tester. Samples of
10 ml were withdrawn at predetermined time intervals and replaced with the same volume of fresh buffer. Each sample solution was analyzed by high-performance liquid chromatography (HPLC) to determine the dissolution rate of valproic acid as described by Fujisaki and colleagues (2006). An AUV absorption spectrometer was used as the HPLC detector at a detection wavelength of 210 nm. The HPLC column was an Inertsil ODS stainless steel column with an inside diameter of 4.0 bmm and a length of 25 cm (GL Science, Ins., Tokyo, Japan). The analysis was performed at 40 °C. The mobile phase was 0.02 M phosphate buffer (pH 3.0) and acetonitrile (60; 40, v/v).
In vivo
bioequivalence study
Subjects
Twelve healthy Japanese volunteers (9 males, 3 females) were enrolled in this study. Their mean age ± SD and age range were 28.8 ± 4.8 and 23–36 years, respectively and mean body weight was 62.3 ± 13.1 with a range of 43–95 kg.
Study design
Bioanalytical method
Serum concentrations of valproic acid were quantified with enzyme immunoassay (EIA). The detection limit was 1.0 µg/ml. The inter- and intra-assay CVs for valproic acid were less than 5.5% for all quality control concentrations.
In vivo
pharmacokinetic parameters
Pharmacokinetic parameters were determined by noncompartment model with WinNonlin software (Pharsight Co.,Cary, NC, USA). Apparent volume of distribution (Vd/F), absorption constant (Ka), elimination constant (Ke), and lag time (Tlag) were calculated as fi rst parameters. Area under the drug concentration-time curve (AUC), apparent clearance (CL/F), time to peak concentration (Tmax), peak concentration (Cmax), peak concentration at steady state (Cssmax) and minimum concentration at steady state (Cssmin) were estimated as second parameters.
Statistical analysis
Paired t-test was used for the comparison of the pharmaco-kinetic parameters between the two phases, ie, Depakene R and Selenica R. Two-way analysis of variance was used for sequence effects. Two-way ANOVA was used for compari-son of the in vitro dissolution study. Post hoc analyses were done using Bonferroni’s correction with paired t-test.
A p value of 0.05 or less was regarded as signifi-cant. When the calculated 90% confi dence intervals with logarithmic transformation of pharmacokinetic data (Cmax and AUC) fell within 80%–125% for the ratio of the product average, we regarded the product as bioequivalent. SPSS 13.0J for Windows (SPSS Japan Inc., Tokyo, Japan) was used for these statistical analyses.
Results and discussion
In vitro
drug release study
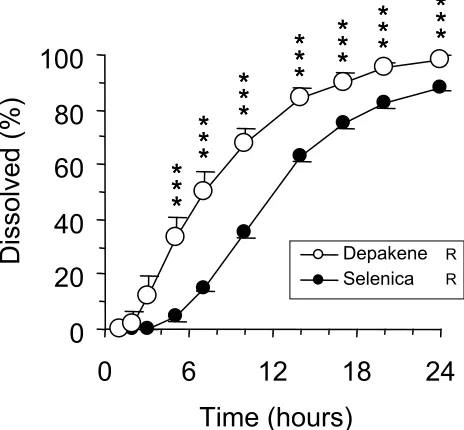
Dissolution curves are shown in Figure 1. All the Depakene R tablets were detectable after 3 hours, while it took 7 hours to detect all of the Selenica R tablets. Two-way ANOVA showed signifi cant difference in dissolution curves between the two formulations (p 0.001). Dissolved valproic acid concentrations for Depakene R were signifi cantly greater than those for Selenica R from 7 to 24 hours.
These fi ndings suggested the different mechanisms of sustained release between Depakene R and Selenica R, ie, the elution of valproic acid from Depakene R is controlled in such a way that the substance passes through the core matrix structure and further passes through the sustained-release membrane, while Selenica R elutes through a mixed
membrane composed of ethylcellulose and methacrylate copolymer-L (Fijisaki et al 2006) (Figure 2).
In vivo
bioequivalence study
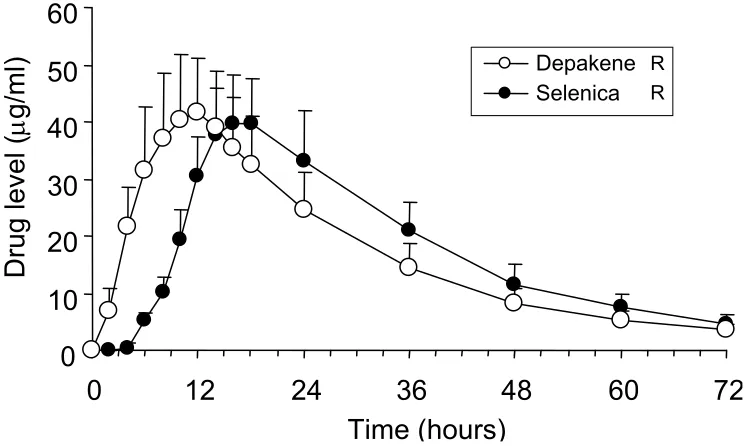
Serum concentration-time curves of valproic acid after a single oral dose of Depakene R tablets and Selenica R tablets are shown in Figure 3, and their pharmacokinetic parameters including direct (Table 1) and simulated (Table 2) single oral dose data are summarized. There were no severe adverse events during the study. Two subjects had mild sleepiness from 6 hours to 12 hours for both phases. No difference in blood pressure or heart rate was observed between the two formulations.
There were no differences in Cmax or total AUC between the new formulation (Selenica R) and conventional formu-lation (Depakene R). Bioequivalence analyses showed that 90% confi dence interval of log-transformed Cmax and total AUC between the two formulations were 92%–106% and 101%–111%, respectively.
Lag time and tmax of Selenica R were signifi cantly delayed in comparison with those of Depakene R (7.1 ± 0.8 versus 1.7 ± 0.6 hours, p 0.001 for lag time, 17.6 ± 1.8 versus 10.8 ± 1.7 hours, p 0.001 for tmax). However, no difference was found in Ka. Other parameters, such as Vd/F, Ke, and CL, did not differ between the two formulations. Cssmax and Cssmin simu-lated by single-oral pharmacokinetic parameters were 63.5 ± 17.7 and 35.1 ± 10.4 µg/ml for Depakene R and 64.3 ± 16.0 and 40.8 ± 13.1 µg/ml for Selenica R. Cssmin of Selenica R was signifi cantly higher than that of Depakene R ( p 0.05), but the
Figure 1 Dissolution profi les of Depakene R and Selenica R. Error bars indicate
standard errors. Open and solid circles are the data for Depakene R and Selenica R, respectively.
Notes: *p 0.05, **p 0.01, ***p 0.001.
0
20
40
60
80
100
0
6
12
18
24
difference in fl uctuating drug concentration (Cssmax–Cssmin) did not differ between Selenica R and Depakene R. There were no sequence effects on the pharmacokinetic parameters.
The results of this study showed no differences in Cmax or AUC of valproic acid between new and conventional formulations. The 90% confidence interval of log-transformed Cmax and total AUC between the two formulations fell within 80%–125%, suggesting that Selenica R is bioequivalent to Depakene R according to US Food and Drug Administration Guidance for Industry (see http://www.fda.
gov/CDER/guidance/3616fnl.htm). Therefore, it appears that blood concentrations that cause side effect are comparable between the two formulations.
However, absorption speed, such as lag time and hence tmax, were very different between the two formulations in the single oral dose study. This is supported by the in vitro
dissolution study which demonstrated that Depakene R dissolved earlier than Selenica R. These fi ndings suggest that valproic acid dissolved from Depakene R appears earlier in the blood and brain than that from Selenica R.
Table 1 Pharmacokinetic parameters of valproate in healthy subjects (n = 12) after single oral doses of valproate (600 mg) in two sustained-release formulations calculated from direct data
Parameters Depakene R Selenica R Signifi cance
Cmax (µg/ml) 42.4 ± 10.7 40.9 ± 8.4 NS
Tmax (hr) 11.1 ± 1.3 16.0 ± 1.6 p 0.001
AUC (0–48) (hr* µg/mL) 1361 ± 346 1458 ± 342 NS
AUC (0–∞) (hr* µg/mL) 1408 ± 403 1536 ± 392 NS
Elimination half-life (hr) 12.9 ± 2.6 12.7 ± 2.9 NS
Note: Data are shown as mean ± SD for pharmacokinetic parameters.
Abbreviations: Cmax, peak concentration; tmax, time to peak concentration in serum; AUC (0–48), are under plasma concentration-time curve (AUC) from 0 to 48 hours; AUC
(0–∞), AUC from 0 to infi nity; NS, not signifi cant; SD, standard deviation.
Figure 2 Tablet characteristics for the slow-release preparations of Depakene R and Selenica R.
Sugar Coat
Sustain released membrane (cellulose type membrane)
Matrix
core
First membrane
(methacrylate copolymer-L ) Second membrane
(ethylcellulose )
Depakene R
On the other hand, no changes in physiological and mental status in our subjects were observed between Selenica R treatment and Depakene R treatment in this study. This is explained by similar exposure (AUC) and/or Cmax in the two formulations. Because therapeutic antiepi-leptic effects or mood-stabilizing effects are associated with exposure to valproic acid, when a sustained-release prepa-ration is switched to another formulation, inconsistencies in pharmacokinetic parameters, such as lag time and tmax,
do not necessarily mean alteration in clinical response. This was confi rmed by our previous study (Yasui-Furukori et al 2007).
Conclusion
The present study demonstrated that the bioavailability of valproic acid in two formulations was similar but absorp-tion time was different because of the different dissoluabsorp-tion profi les.
Table 2 Estimated pharmacokinetic parameters in subjects receiving a single oral dose of valproate in two sustained-release formulations (n = 12)
Parameters Depakene R Selenica R Signifi cance
Vd/F (L) 9.5 ± 2.9 8.7 ± 1.9 NS
Ka (1/hr) 0.21 ± 0.08 0.17 ± 0.07 NS
Ke (1/hr) 0.056 ± 0.012 0.058 ± 0.014 NS
T lag (hr) 1.7 ± 0.6 7.2 ± 0.8 p 0.001
AUC (hr* mg/mL) 1241 ± 329 1300 ± 317 NS
CL/F (L/hr) 0.53 ± 0.17 0.49 ± 0.13 NS
Tmax (hr) 10.8 ± 1.6 17.6 ± 1.7 p 0.001
Cmax (mg/ml) 40.2 ± 10.5 39.3 ± 8.4 NS
Cssmax (mg/ml) 63.5 ± 16.9 64.3 ± 15.3 NS
Cssmin (mg/ml) 35.1 ± 10.0 40.8 ± 12.5 p 0.05
Note: Data are shown as mean ± SD for pharmacokinetic parameters.
Abbreviations: Vd/F, apparent volume of distribution; Ka, absorption constant; Ke, elimination constant; Tlag, lag time; AUC (0–∞), AUC from 0 to infi nity; Cl/F,
apparent total clearance; tmax, time to peak concentration in serum; Cmax, peak concentration; Cssmax, peak concentration at steady state; Cssmin, trough concentration
at steady state.
Figure 3 Serum concentration-time curves of valproic acid after single oral doses of Depakene R and Selenica R. Error bars indicate standard errors. Open and solid circles
are the data for Depakene R and Selenica R, respectively.
Notes: *p 0.05, **p 0.01, ***p 0.001.
0
10
20
30
40
50
60
0
12
24
36
48
60
72
Time (hours)
Selenica Depakene R
R
Drug
level
(
µ
Acknowledgments
None of the authors and their institutes have any confl icts of interest. This study was supported by a grant from the Hirosaki Research Institute for Neurosciences.
References
Bialer M. 1992. Pharmacokinetic evaluation of sustained release formulations of antiepileptic drugs. Clinical implications. Clin Pharmacokinet, 22:11–21.
Bowden CL, Singh V. 2005. Valproate in bipolar disorder: 2000 onwards.
Acta Psychiatr Scand Suppl, 426:13–20.
Buck D, Jacoby A, Baker GA, et al. 1997. Factors infl uencing compliance with antiepileptic drug regimes. Seizure, 6:87–93.
Cramer J, Vachon L, Desforges C, et al. 1995. Dose frequency and dose interval compliance with multiple antiepileptic medications during a controlled clinical trial. Epilepsia, 36:1111–7.
Doughty J, Baker GA, Jacoby A, et al. 2003. Compliance and satisfaction with switching from an immediate-release to sustained-release formula-tion of valproate in people with epilepsy. Epilepsy Behav, 4:710–6. Eadie MJ. 1991. Formation of active metabolites of anticonvulsant drugs.
A review of their pharmacokinetic and therapeutic signifi cance. Clin Pharmacokinet, 21:27–41.
Fujisaki Y, Tsukune T, Funyu M, et al. 2006. Development of sustained-release tablets containing sodium valproate: in vitro and
in vivo correlation. Drug Dev Ind Pharm, 32:207–17.
Genton P. 2005. Progress in pharmaceutical development presentation with improved pharmacokinetics: a new formulation for valproate. Acta Neurol Scand Suppl, 182:26–32.
Gugler G, von Unruh GE. 1980. Clinical pharmacokinetics of valproic acid.
Clin Pharmacokinet, 5:67–83.
Nasrallah HA, Ketter TA, Kalali AH. 2006. Carbamazepine and valproate for the treatment of bipolar disorder: a review of the literature. J Affect Disord, 95:69–78.
Pellock JM, Smmith MC, Cloyd JC, et al. 2004. Extended-release formulations: simplifying strategies in the management of antiepileptic drug therapy. Epilepsy Behav, 5:301–7.
Perucca E. 2002. Pharmacological and therapeutic properties of valproate: a summary after 35 years of clinical experience. CNS Drugs, 16:695–714.
Pugh CB, Garnett WR. 1991. Current issues in the treatment of epilepsy.
Clin Pharm, 10:335–58.
Yasui-Furukori N, Saito M, Nakagami T, et al. 2007. Different serum concentrations of steady-state valproic acid in two sustained-release formulations. Psychiatry Clin Neurosci, 61:308–12.