Article
1
BCI Gaze Sensing Method Using Low Jitter Code
2
Modulated VEP
3
Ibrahim Kaya1*, Jorge Bohorquez1 and Ozcan Ozdamar 1
4
1 Biomedical Engineering Department, University of Miami, Coral Gables, FL 33146, USA
5
* Correspondence: [email protected];
6
7
Abstract: Visual Evoked Potentials (VEPs) are used in clinical applications in ophthalmology,
8
neurology and extensively in brain computer interface (BCI) research. BCI literature covers steady
9
state VEP (SSVEP) and code modulated VEP (c-VEP) BCIs along with sophisticated methods to
10
improve information transfer rates (ITR). There is a gap of knowledge regarding the VEP adaptation
11
dynamics, physiological generation mechanisms and relation with BCI performance. A simple dual
12
display VEP switch was developed to test signatures elicited by non-isochronic, non-singular, low
13
jitter stimuli at the rates of 10, 32, 50 and 70 reversals per second (rps). Non-isochronic, low-jitter
14
stimulation elicits Quasi-Steady-State VEPs (QSS-VEPs) that are utilized for simultaneous
15
generation of transient VEP and QSS-VEP. QSS-VEP is a special case of c-VEPs and it is assumed
16
that it shares the similar generators of the SSVEPs. Eight subjects were recorded and the
17
performance of the overall system was analyzed by means of Receiver Operating Characteristic
18
(ROC) curves, accuracy plots and ITRs. In summary QSS-VEPs performed better than transient
19
VEPs. It was found that in general 32rps stimulation had the highest ROC area, accuracy and ITRs
20
in general. To investigate the reasons behind this, adaptation dynamics of transient VEPs and
QSS-21
VEPs at all four rates were analyzed and speculated. Moreover, QSS-VEPs were found to lead to
22
higher accuracy by the template matching compared to SSVEPs at 10rps and 32rps.
23
Keywords: Gaze Sensing; SSVEP; BCI; c-VEP; transient VEP; QSS-VEP; Deconvolution;
24
25
1. Introduction
26
Recently Brain Computer Interface (BCI) research has shown a remarkable progress as witnessed
27
by an increasing number of publications. BCI provides a direct communication and control channel
28
between the human brain and output devices in order to achieve a desired output function by using
29
the control signals derived from the human brain [1]. Most of the BCI research is focused on
30
increasing the Information Transfer Rate (ITR). Depending on the signal acquisition methods, EEG
31
based BCIs are getting more and more attention due to non-invasiveness and practical EEG headsets
32
available in the market. In EEG based BCI applications there are four main signal classes, namely
33
Slow Cortical Potentials (SCP), Sensorimotor Rhythms (SMR), P300 Evoked Potentials and Visual
34
Evoked Potentials (VEP) [2]. VEP based BCIs paradigms are common due to several advantages.
35
These are mainly high ITR, simple setup, and little user training [3].
36
VEPs are named after stimulation types such as flash VEP, pattern reversal VEP,
pattern-onset-37
offset VEP [4]. In clinical testing pattern-reversal VEP is the most preferred one due to having least
38
variability in the waveform , latencies and motion [5]. VEP stimulus can be modulated by space, time,
39
luminance, contrast, color, pattern, depth [5]. VEPs can be grouped into two depending on the
40
stimulation rate. At low stimulation rates (< 3-4 reversals per second (rps)) electrical activity on the
41
occipital scalp elicits abrupt changes by the contrast reversing stimulus and then settles until the
42
presentation of the next stimulus. This type of VEP is called ‘transient VEP’ (TR-VEPs) [6-7]. However
43
if the stimulus presented at a higher rate and the response contains frequency components constant
44
in amplitude and phase, then it is called ‘Steady State Evoked Potentials or SSEP [8-10].
45
Depending on VEP modulation, three main VEP BCI types exist: time modulated VEP (t-VEP)
46
BCI, frequency modulated VEP (f-VEP) BCI and pseudorandom code modulated VEP (c-VEP) BCI
47
[11]. Both f-VEP and c-VEP BCIs produce high ITRs. Steady state VEP (SSVEP) (f-VEP) based BCIs
48
have advantages of easy system configuration, excellent SNR, immunity to interferences, minimal
49
user training, easy quantification and high ITR [1,11-16]. However, possible target frequencies are
50
limited due to computer display refresh rates limitations and the SSVEP have low amplitudes at high
51
stimulation rates [1, 12, 16].
52
Pseudo random binary sequences (PRBS) based c-VEP BCI paradigm offers promising results in
53
terms of the ITR, accuracy, and use of many targets in applications [2,11,17]. Even though PRBS are
54
mostly used in system identification, they are also used in physiological applications such as
55
deconvolution and BCI. One particular PRBS, the maximum length sequences or m-sequences were
56
used by Sutter in a BCI application [18]. Although m-sequences have a-priori remarkable noise
57
attenuation due to its sharp autocorrelation properties, they do not provide the expected SNR
58
improvement in physiological recordings due to adaptation [19]. Working on BCI applications, Bin
59
Bin et al. [17], found that when a stimuli with sharp autocorrelation is used, the physiological system
60
generates responses with lower autocorrelation sharpness, significantly reducing the a-priori
61
effectivity of that BCI system. Therefore, the knowledge of the adaptation characteristics of the visual
62
system should be integrated in the design of the whole BCI system to achieve optimal performance.
63
Low-jitter PRBS have been successfully used to unveil the unitary responses of the visual system
64
through Pattern Electroretinograms and VEPs [20-21]. Low jitter stimuli elicit c-VEPs with narrow
65
spectrum, similar to the SSVEP and named as Quasi SSVEP (QSS-VEP); they have unique features
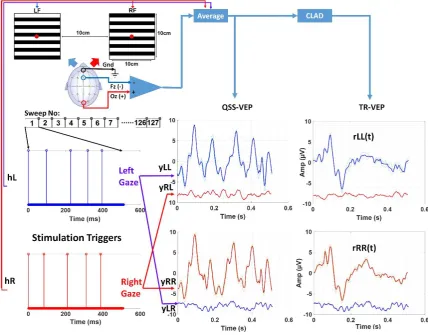
66
such as capability for deconvolution of transient VEPs (TR-VEPs), immunity to adaptation, and
67
shared brain generators of the SSVEP.
68
The use of a physiologically adapted low jitter PRBS stimuli in a BCI gaze sensor may capture
69
advantages of both f-VEPs and c-VEPs paradigms reducing their shortcomings. For this reason, in
70
this study, we developed a dual display BCI gaze sensor based on specially designed low-jitter PRBS
71
codes eliciting QSS-VEP and adopted the template matching as the detection method.
72
2. Materials and Methods
73
Right and left gaze sensing systems were developed using two independent regions (right and
74
left) on a fast Visual Display Unit (VDU). Four stimulation rates (10, 32, 50 and 70rps) were explored
75
on a normal subject population. For each rate, detection was evaluated using QSS-VEP and TR-VEPs.
76
For the rates of 10 and 32 rps the SSVEPs were also evaluated. 50 and 70rps SSVEPs were excluded
77
due to low amplitudes [22]. Using raw EEG recordings, the system performance, in all conditions,
78
was quantified off-line by using ROC curves, areas under the curves (AUC), accuracies and ITRs.
79
2.1. Subjects
80
Total 8 subjects (5M, 3F) with no history of neurological impairment participated in this study.
81
The subject ages ranged from 18 to 31. All the subjects had either normal or corrected-to normal
82
vision and were right eye dominant. They signed informed consent forms approved by University of
83
Miami Institutional Review Board (IRB) prior to the participation.
84
2.2. Stimuli Design and Stimulator Display
85
The display consisted of two fast switching on demand LED based regions for left (Left Field,
86
LF) and right targets (Right Field, RF) (Figure 1). Subjects were placed 1 meter away from the
87
stimulator display to ensure the target displays lie in foveal field of view. Stimulator provided two
88
target stimuli, each covering a visual field of 5.7° x 5.7°. The luminance of the display was 580 Cd/m².
89
The stimulus pattern of the targets consisted of 12 horizontal black and white bars with spatial
90
frequency of 1.03 cycles/degree. Right and left regions were driven by two stimuli of slightly different
length and jitter but similar rate (Table 1). Low jittered, low noise amplification sequences similar to
92
were used [20-21, 23]. These sequences have low jitter and thus resemble the steady state isochronic
93
stimulation sequences. Moreover they are non-singular in frequency domain and allow
94
deconvolution to extract transient VEPs (See [8] for deconvolution). A cue light blue for Left, red for
95
Right, green for Center was lit for indication of gaze direction to the subjects.
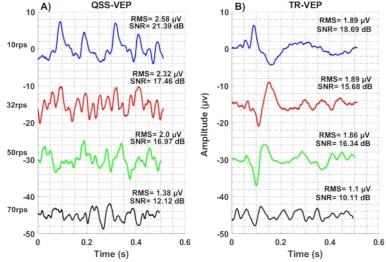
96
97
Figure 1. Overall system setup and experimental procedure is shown for 10rps stimulation. Stimulator is
98
shown at the top left, driving sequences for left field (LF) and right field (RF) are shown at the bottom
99
left, the QSS and transient responses from subject 5 are shown in the bottom right figures. Interference
100
signals after averaging 127/128 sweeps in one file for left/right, yRL and yLR, are also displayed to
101
highlight the orthogonality of the sequences.
102
2.3. Experimental Setup and EEG Recording
103
Single EEG channel was recorded using Oz as positive, Fz as negative and forehead as ground.
104
Three passive Ag/AgCl electrodes were used in the experiments. Electrode impedances were checked
105
and kept below 7kΩ. EEG was recorded with an Intelligent Hearing System (IHS, USA) data
106
acquisition module (16 bits) at sampling rate of 2 kHz. Analog signal was bandpass filtered with
1-107
300Hz (6db/octave) filters. Raw EEG data along with stimulation triggers and synchronization cues
108
were stored for off-line analysis.
109
110
111
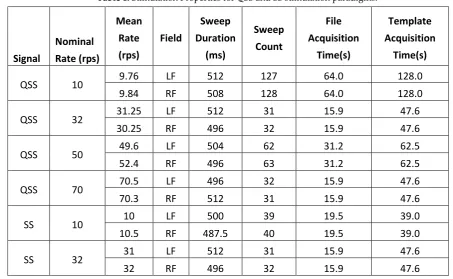
Table 1. Stimulation Properties for QSS and SS stimulation paradigms.
113
Signal
Nominal
Rate (rps)
Mean
Rate
(rps)
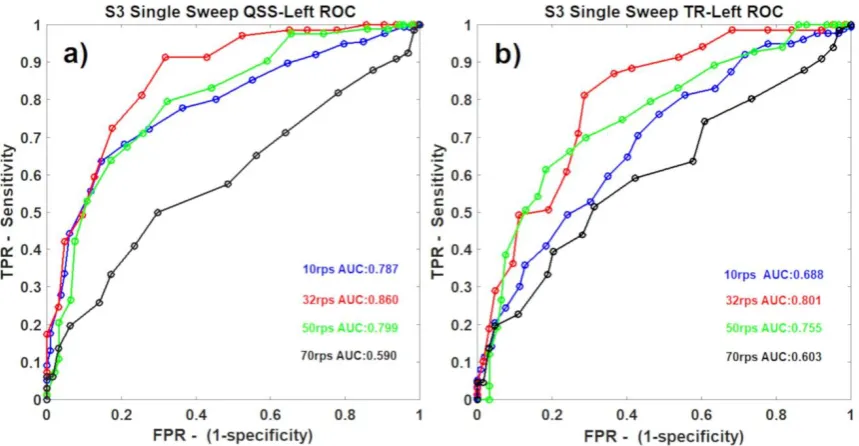
Field
Sweep
Duration
(ms)
Sweep
Count
File
Acquisition
Time(s)
Template
Acquisition
Time(s)
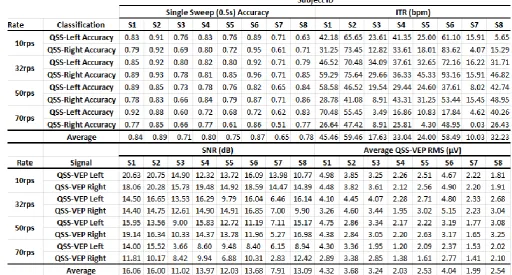
QSS
10
9.76
LF
512
127
64.0
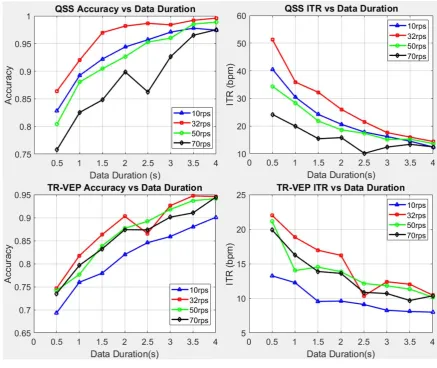
128.0
9.84
RF
508
128
64.0
128.0
QSS
32
31.25
LF
512
31
15.9
47.6
30.25
RF
496
32
15.9
47.6
QSS
50
49.6
LF
504
62
31.2
62.5
52.4
RF
496
63
31.2
62.5
QSS
70
70.5
LF
496
32
15.9
47.6
70.3
RF
512
31
15.9
47.6
SS
10
10
LF
500
39
19.5
39.0
10.5
RF
487.5
40
19.5
39.0
SS
32
31
LF
512
31
15.9
47.6
32
RF
496
32
15.9
47.6
The rate study consisted of two sessions, first one was training (template generation) and second
114
session was system performance evaluation. During the rate experiment, each rate single file
115
acquisition durations (Table 1) were different. Hence for 10, 32, 50 and 70rps, 2 files, 3 files, 2 files and
116
3 files were recorded respectively to generate templates in training session for left and right gazes.
117
Same number of files were recorded for the second session for testing purpose. The acquisition order
118
was 10rps, 32rps, 50rps and 70rps consecutively. Template acquisition was done by averaging EEG
119
sweeps, for number of sweeps refer Table 1. During the recordings the operator monitored the
120
experiment to ensure signal quality , no powerline interference, subject’s cooperation, subject’s
121
gaze. In the event of poor cooperation by subject, sleepiness or excessive eye blinks , the recording
122
was halted and either repeated or postponed for another time. Between recordings, subjects had 30s
123
rest intervals.
124
2.4. EEG Offline Processing
125
The EEG epochs/sweeps in the same condition files were averaged in MATLAB 2018b
126
(MathWorks, USA) environment except for the sweeps with peak to peak amplitudes > 80µ V. Those
127
large peak to peak sweeps were discarded. In this averaging, +/- averaging, noise and Signal to Noise
128
Ratio (SNR) computations were also carried out.
129
For one cycle/file of stimulation when the subject gazed at one stimulation region, the response
130
to the other stimulation region is almost zero due to orthogonality which can be seen from yRL(red)
131
and yLR(blue) plots in Figure 1 .
132
Left and right display regions were driven by hL and hR stimulation sequences respectively as
133
shown in Figure 1. The 10rps QSS-VEPs for left and right regions were obtained by averaging the
134
EEG data with window lengths of 1024 and 1016 points or 512ms and 508ms windows. For the other
135
reversal rates the window sizes or sweep durations are given in Table 1. The QSS-VEP responses are
136
hypothesized to result from convolution of the stimulation sequences hL or hR and ideal transient
137
response at that particular adaptation rate. This can be seen from equations 1 and 2.
138
𝑦𝐿𝐿(𝑡) = ℎ𝐿(𝑡) ∗ 𝑟(𝑡) ⇒ 𝑌𝐿𝐿(𝑓) = 𝐻𝐿(𝑓) ∗ 𝑅(𝑓)
139
𝑦𝑅𝑅(𝑡) = ℎ𝑅(𝑡) ∗ 𝑟(𝑡) ⇒ 𝑌𝑅𝑅(𝑓) = 𝐻𝑅(𝑓) ∗ 𝑅(𝑓)
140
(1)
The deconvolution can be applied since stimulation sequences hL and hR are nonsingular. Then
141
the transient responses for right field stimulation and right gaze is rRR(t) and left field stimulation
142
and left gaze is rLL(t) which were obtained by deconvolution and inverse fast fourier transform (ifft)
143
are almost identical due to very similar stimulation sequences and adaptation as seen from equations
144
3 and 4.
145
𝑅𝑅𝑅(𝑓) =
𝑌𝑅𝑅(𝑓)
𝐻𝑅(𝑓) ⇒ 𝑟𝑅𝑅(𝑡) = 𝑖𝑓𝑓𝑡 (
𝑌𝑅𝑅(𝑓) 𝐻𝑅(𝑓))
146
𝑅𝐿𝐿(𝑓) =
𝑌𝐿𝐿(𝑓)
𝐻𝐿(𝑓) ⇒ 𝑟𝐿𝐿(𝑡) = 𝑖𝑓𝑓𝑡 (
𝑌𝐿𝐿(𝑓)
𝐻𝐿(𝑓))
147
By averaging the multiple EEG data segments of left or right sequence lengths, it was
148
possible to extract QSS-VEP responses to right and left targets (see Figure 1) for different data sizes.
149
Since stimulation sequences were nonsingular, deconvolution method in frequency domain was
150
applied to obtain TR-VEP responses. QSS-VEP and TR-VEP templates were computed by averaging
151
the two EEG files for 10rps and 50rps, similarly three EEG files for 32rps and 70rps for each gaze
152
direction.
153
2.5. Gaze Detection and ROC Estimation
154
Gaze detection process involved cross-correlation between the reference templates and the
155
signal. We utilized Pearson’s product-moment correlation coefficient between subject’s template VEP
156
and subject’s actual test data in our method. The correlation coefficient was compared to a threshold
157
for decision. If the correlation coefficient was higher than threshold, the signal matched the template’s
158
gaze direction. For this purpose templates for each gaze and rate condition were extracted following
159
the training sessions. Proper calculation and selection of threshold values from cross correlation
160
coefficients were critical in the gaze detection. ROC is a curve representing the performance of the
161
classifier. By change of operation threshold value, ROC determines the probability of error and
162
accuracy (true positive ratio) in system. After the files recorded and templates ready to be used in
163
comparison, ROC curves were calculated in order to evaluate the performance of the classifier. To
164
compute ROC curves two classes of files (left and right gaze files) were fed into an algorithm where
165
left or right templates were used as references. Since file gaze conditions were known, true positives,
166
false positives, true negatives, false negatives were available while threshold was varied from -1 to 1
167
by steps of 0.05 for correlation coefficient. ROC curves were computed for 0.5s, 1s, 1.5s, 2s, 2.5s, 3s,
168
3.5s, 4s of data length.
169
3. Results
170
Overall system performance was evaluated by offline analysis. This covered ROC curves and
171
areas, accuracies, ITR computations, plots and comparisons. Generally t-test paired two sample for
172
means was used to examine the effects of various conditions on the performance, particularly on
173
accuracy and ITR. The effect of gazing left or right stimulus was tested by computing accuracies. It
174
has been found that statistically there is no significant difference in the mean accuracies by left or
175
right gaze using single sweep (0.5s) QSS-VEP signature at all rates. Therefore for the same conditions
176
left and right gazed performances were averaged in order to generate a single parameter to represent
177
the performance at that particular condition. This reduced the number of comparisons hence
178
complexity in the analysis.
179
There were many signatures to test the system performance with. For 10rps stimulation these
180
were mainly the combinations of right and left , QSS-VEP and TR-VEP responses. It followed the
181
same signatures for 32rps, 50rps and 70rps stimulation. By averaging left and right QSS-VEP
182
performances in terms of accuracy or ROC area, an average accuracy or ROC area was computed for
183
each rates of QSS (10, 32, 50, 70rps) and steady state (SS) conditions (10 and 32rps).
184
185
186
(3)
3.1. VEP Morphology by Rate Adaptation
187
The recording electrode sites might reveal different signals depending on the adaptation
188
characteristics of dominant neural populations over the particular sites [24]. Four rates of 10rps,
189
32rps, 50rps and 70rps QSS-VEPs are shown in Figure 2-A, it can be seen that 70rps QSS-VEP has
190
smaller peaks compared to others. In Figure 2-B, transient TR-VEP waveforms are shown. While
191
10rps TR-VEP has characteristic early peaks and negativities, 32rps, 50rps and 70rps have totally
192
different waveforms. There a positive peak replaces the negativity around 120-150ms. When we
193
compare the TR-VEP amplitudes, 32rps has the largest amplitude 12µ V, 50rps has 10.9µ V, 10rps has
194
10.5µ V, and 70rps has the minimum 5.2µ V amplitude.
195
196
Figure 2. Population average left field QSS-VEP and TR-VEP plots are shown. A) 10rps, 32rps ,50rps and
197
70rps QSS-VEPs are at the left. B) VEPs are at the right. Note the morphology change in the
TR-198
VEPs by rate from 10rps to 32rps.
199
3.2. Offline Analysis and Performance
200
Template matching was adopted as the method for target recognition. Threshold values for right
201
and left target detection were pulled from ROC curves as the threshold index value corresponding
202
to max ROC AUC. Once thresholds were set and template signals were uploaded, files with known
203
status were tested with system and the results were plotted.
204
There are many metrics to evaluate the performance of a BCI system. Thompson et al. 2013
205
compared these metrics of accuracy or error rate, Cohen’s Kappa coefficient, confusion matrix,
206
mutual information and ITR in terms of throughput, categorical output, unbiased/biased, practicality
207
[25]. They suggested ITR as optimum metric for level-1 BCI system. Our system was tested offline
208
with QSS-VEP and TR-VEP signatures and for all stimulation rates. ITR and accuracies were used in
209
this evaluation. ITR can be calculated by the following equation 5:
210
𝐼𝑇𝑅 = [𝑙𝑜𝑔2(𝑁) + 𝑃 𝑙𝑜𝑔2(𝑃) + (1 − 𝑃) 𝑙𝑜𝑔2(
1−𝑃 𝑁−1)]
60
𝑇
211
P is the probability of correct selection, N is the number of choices and T (seconds/selection) time
212
required to select a choice/target [25]. Its unit is given in bits per minute (bpm). ITR simply follows
213
the accuracy of the classification, the higher the accuracy the bigger is the ITR. There is a limit of ITR
214
by selection time and maximum accuracy of 1. For a two target system, at maximum accuracy ITR is
215
60 / (selection time).
216
In the experiments subject 6 achieved a remarkable accuracy of 0.96 and corresponding ITR of
217
93bpm at 32rps 0.5s data and QSS-VEP right gazing BCI switch condition. QSS-VEP and TR-VEP
218
ROC curves for 50rps and left gaze conditions were compared. For data durations 0.5s, 1.5s and 2.5s,
219
50rps ROC areas were found as 0.86, 0.92 and 0.95 respectively for left QSS signal. Similarly for left
220
TR-VEP, 0.5s, 1.5s and 2.5s data durations, accuracies were 0.73, 0.80 and 0.83 respectively. It should
221
be noted that the ROC area increases by increase of data size. Inclusion of extra sweeps in the average
222
increases the SNR and better ROC area and accuracy are achieved.
223
When ROC curves for QSS-VEP and TR-VEPs were compared, QSS-VEPs were found to perform
224
better than VEPs for 10rps stimulation (p<0.05) (See Figure 3) . Classifier performances for
TR-225
VEPs using 0.5s - 1 sweep data were compared in Figure 3-b. The low performance with 10rps can be
226
attributed to the alpha band activity interference which was reported in [22] and [26]. It can be seen
227
from the Figure 3 that among S3 ROC curves for different rates, 32rps has the largest ROC area for
228
both left QSS-VEP and left TR-VEP. 10rps and 50rps have similar ROC areas for QSS-VEP, 70rps
229
has the minimum ROC area for both QSS-VEP and TR-VEP which summarizes the system
230
performance at these rates. The QSS-VEP paradigm boosts the ROC area performances obtained by
231
TR-VEPs by 14% for 10rps for S3.
232
233
234
Figure 3. S3 single sweep 0.5second condition. a) Left QSS-VEP ROC curves and areas for all the rates are
235
shown at the left. b) Left TR-VEP ROC curves and areas for all the four rates are shown at the right.
236
When we compare the accuracy table with QSS-VEP rms table given in the supplementary table
237
S1, there is a relation that increasing QSS-VEP rms increases the accuracy. However the relation
238
between SNR and accuracy is more prominent. With QSS-VEP rms and accuracies averaged for
239
each subject, we found correlation coefficients of 0.72 for 1s and 0.70 between rms values and
240
accuracies for 0.5s data. On the other hand the correlation coefficient between the subject average
241
SNR and accuracies are 0.94 and 0.92 for 1s and 0.5s data respectively.
242
As mentioned before in this paper, the left and right QSS-VEP performances are combined to
243
create a single parameter for that condition which reveals the rate dependent characteristics easily in
244
one figure. See Figure 4 for the rate effect on QSS-VEP and TR-VEP signals. It was found that for
245
QSS-VEP 32rps had the biggest accuracy and ITR among all rates for 0.5s data. QSS-VEP ITRs are
246
bigger than TR-VEP ITRs. On the other hand TR-VEP ITR performances can be seen from the bottom
right panel in Figure 4 which shows that except for 10rps , the remaining rates had ITR values around
248
20-23bpm. 10rps had low TR-VEP performance and low ITR around 14bpm with single sweep data.
249
250
Figure 4. QSS-VEP performances for left and right gazes were averaged as single QSS-VEP performance
251
parameter at each rate. 32rps had the highest accuracy and ITR performance (p<0.05) with QSS-VEP
252
signature while 70rps had the lowest performance (p<0.05). For the 8 Subject population average ITR
253
values for QSS-VEP (top-right) and TR-VEPs (bottom-right) were plotted for each rate and data
254
durations.
255
256
Figure 5. QSS-VEP and SSVEP performances are compared. A) 10rps QSS vs SS VEP accuracies. B) 32rps
257
QSS vs SS VEP accuracy performances are compared.
When QSS and Steady State (SS) performances were compared, QSS-VEP 10rps accuracy was
259
lower than QSS-VEP 32rps accuracy but bigger than both SS 10rps and 32rps accuracies (p<0.05) for
260
0.5s data duration as seen in Figure 5. 32rps SS performed much lower than 10rps SS (p<0.05) for 0.5s
261
and 1s data. However after 3s data, they all reached a similar value except for 32rps SS, which was
262
below the rest. On the other hand QSS-VEP 32rps paradigm on the average had 23.5% higher
263
accuracy than the SSVEP paradigm for 0.5s data. Similarly 10rps QSS-VEP paradigm also had 5%
264
higher accuracy performance than the SSVEP paradigm accuracy performance for single sweep data.
265
4. Discussion
266
Although SSVEP based BCIs demonstrated their excellence in ITRs, performances of
pattern-267
reversal c-VEP and transient-VEP based BCIs can be improved by researches. Since there is limited
268
number of studies with pattern-reversal VEP, we proposed a research into different reversal rates
269
and the template matching performance of the pattern reversal c-VEP or particularly low jittered
270
QSS-VEPs. For TR-VEP ROC comparisons 10rps performed low compared to other rates. This might
271
be attributed to the interference with alpha band at 10rps. There existed a huge subject variability in
272
the accuracies and ITRs. It was found that user variation could be reduced by selecting the channel
273
location, the stimulus frequency, and the speed of selection parameters carefully [3]. Another source
274
of variation could be attendance and cooperation during the particular tasks, if the user lacked
275
attention during target gazing, the resultant target VEP characteristics would be affected hence
276
accuracy and ITRs would be influenced adversely for these tasks. However on the overall
277
performance 32rps QSS-VEP paradigm led to highest accuracy values and ITRs in offline analysis
278
compared to 10rps, 50rps and 70rps reversal rates. One of the reasons behind this is that the number
279
of visible peaks with 32rps stimulation in the resultant QSS-VEP is higher than the number of visible
280
peaks with other QSS stimulation rates. However at 50rps and 70rps due to convolution and
281
superposition of transient VEPs , the resulting QSS-VEPs did not elicit that many peaks contributing
282
to template matching. Another aspect of the research was comparison of SSVEP to QSS-VEP in
283
template matching accuracy. As mentioned before SSVEPs had smaller peaks at high rates [22].
QSS-284
VEPs on the other hand had multiple peaks and higher amplitudes compared to SSVEPs.
285
QSS stimulation improves the SNR performance due to jitter in the paradigm and this jitter
286
cancels out adverse effects of adaptation on signal peaks. QSS-VEP generates larger peaks at higher
287
rates where steady state responses are diminished by adaptation. The low jitter design of QSS
288
stimulation allows the extraction of base TR-VEPs responses. If TR-VEPs have bigger amplitude at
289
particular rates, it is due to the boosting effect of special QSS stimulation. As compared QSS-VEPs at
290
32rps performed significantly (p<0.05) better than 32rps SS counterparts for 1,2 or 3 sweeps averages.
291
Similarly 10rps QSS stimulation performed better than 10rps SS for 1,2 or 3 sweeps.
292
5. Conclusions
293
This research revealed that QSS-VEP paradigm offers a feasible alternative to the methods
294
applied to c-VEP or SSVEP based BCIs. The advantages of the QSS-VEP method are that it increases
295
accuracy of the SSVEP template matching at the same reversal rates, it enables extraction of clinically
296
significant TR-VEP from low jittered QSS-VEPs. By special design of low jitter QSS sequences, it was
297
possible to enhance SNR and accuracy at higher rates compared to rates interfering with alpha band.
298
32rps achieved the maximum boosting effect by the QSS-VEP, which led to higher accuracy
299
performances in template matching based dual target BCI switch.
300
Supplementary Materials: The following is available online at www.mdpi.com/xxx/s1, Table S1: Single Sweep
301
QSS-VEP Accuracy and SNR values for all subjects.
302
Author Contributions: Conceptualization, I.K, J.B., O.O; methodology, I.K., J.B., O.O; software, I.K.; validation,
303
I.K.; formal analysis, I.K.; investigation, I.K.; resources, J.B; data curation, I.K.; writing—original draft
304
preparation, I.K.; writing—review and editing, I.K., J.B, O.O.; visualization, I.K.; supervision, J.B., O.O.; project
305
administration, O.O.
Conflicts of Interest: The authors declare no conflict of interest.
307
References
308
1. Wang, Y., Gao, X., Hong, B., Jia, C., & Gao, S. Brain-computer interfaces based on visual evoked
309
potentials. IEEE Eng. Med. Biol. Mag. 2008, 27(5), 64-71. https://doi.org/10.1109/MEMB.2008.923958
310
2. Nicolas-Alonso, L. F., & Gomez-Gil, J. Brain computer interfaces, a review. Sensors 2012, 12(2),
1211-311
1279. https://doi.org/10.3390/s120201211
312
3. Wang, Y., Wang, R., Gao, X., Hong, B., & Gao, S. A practical VEP-based brain-computer interface. IEEE
313
Trans. Neural Syst. Rehabil. Eng. 2006, 14(2), 234-240. https://doi.org/10.1109/TNSRE.2006.875576
314
4. Odom, J.V., Bach, M., Brigell, M., Holder, G. E., McCulloch, D.L., Mizota, A., Tormene, A. P. “ISCEV
315
standard for clinical visual evoked potentials-(2016 update)”. Doc. Ophthalmol. 2016 133(1): 1-9.
316
https://doi.org/10.1007/s10633-016-9553-y
317
5. Fahle M Bach M . Origin of the visual evoked potentials. In: Heckenlively JR Arden GB eds. Principles
318
and Practice of Clinical Electrophysiology of Vision. Cambridge, MA: The MIT Press; 2006;207–234.
319
6. Sokol, S. “Visually evoked potentials: theory, techniques and clinical applications.” Surv. Ophthalmol.
320
1976, 21(1), 18-44. https://doi.org/10.1016/0039-6257(76)90046-1
321
7. Zemon, V. M., & Gordon, J. Quantification and statistical analysis of the transient visual evoked
322
potential to a contrast‐reversing pattern: A frequency‐domain approach. Eur. J. Neurosci. 2018, 48(2),
323
1765-1788. https://doi.org/10.1111/ejn.14049
324
8. Ö zdamar, Ö ., & Bohórquez, J. Signal-to-noise ratio and frequency analysis of continuous loop
325
averaging deconvolution (CLAD) of overlapping evoked potentials. JASA 2006, 119(1), 429-438.
326
https://doi.org/10.1121/1.2133682
327
9. Capilla, A., Pazo-Alvarez, P., Darriba, A., Campo, P., & Gross, J. Steady-state visual evoked potentials
328
can be explained by temporal superposition of transient event-related responses. PloS one 2011, 6(1),
329
e14543. https://doi.org/10.1371/journal.pone.0014543
330
10. Regan, D. Steady-state evoked potentials. J. Opt. Soc. Am. 1977, 67(11), 1475-1489.
331
https://doi.org/10.1364/JOSA.67.001475
332
11. Bin, G., Gao, X., Wang, Y., Hong, B., Gao, S. “VEP-based brain-computer interfaces: time, frequency,
333
and code modulations [Research Frontier].” IEEE Comput. Intel. Mag. 2009, 4(4) : 22-26
334
https://doi.org/10.1109/MCI.2009.934562
335
12. Chen, X., Chen, Z., Gao, S., & Gao, X. Brain–computer interface based on intermodulation frequency. J.
336
Neural Eng. 2013, 10(6), 066009. https://doi.org/10.1088/1741-2560/10/6/066009
337
13. Cheng, M., Gao, X., and Gao, S. Design and implementation of a brain–computer interface with high
338
transfer rates. IEEE Trans. Biomed. Eng. 2002, 49 1181–6. https://doi.org/10.1109/TBME.2002.803536
339
14. Gao, X., Xu, D., Cheng, M. and Gao, S. A BCI-based environmental controller for the
motion-340
disabled. IEEE Trans. Neural Syst. Rehabil. Eng. 2003, 11 137–40.
341
https://doi.org/10.1109/TNSRE.2003.814449
342
15. Li, Y., Bin, G., Gao, X., Hong, B. and Gao, S. Analysis of phase coding SSVEP based on canonical
343
correlation analysis (CCA). Proc. 5th Int. IEEE/EMBS Conf. Neural Eng. 2011, pp 368–71
344
https://doi.org/10.1109/NER.2011.5910563
345
16. Jia, C., Gao, X., Hong, B. and Gao, S. Frequency and phase mixed coding in SSVEP-based brain–
346
computer interface. IEEE Trans. Biomed. Eng. 2011, 58 200–6.
347
https://doi.org/10.1109/TBME.2010.2068571
348
17. Bin, G., Gao, X., Wang, Y., Li, Y., Hong, B., Gao, S. “A high-speed BCI based on code modulation
349
VEP.” J. Neural Eng. 2011, 8(2): 025015. https://doi.org/10.1088/1741-2560/8/2/025015
350
18. E. E. Sutter, “The brain response interface: communication through visually-induced electrical brain
351
responses,” J. Microcomput. Appl. 1992, 15 pp.31-45. https://doi.org/10.1016/0745-7138(92)90045-7
352
19. Bohórquez, J., & Ö zdamar, Ö . Signal to noise ratio analysis of maximum length sequence
353
deconvolution of overlapping evoked potentials. JASA 2006, 119(5), 2881-2888.
354
https://doi.org/10.1121/1.2191609
355
20. Toft-Nielsen, J., Bohórquez, J., & Ö zdamar, Ö . Unwrapping of transient responses from high rate
356
overlapping pattern electroretinograms by deconvolution. Clinical Neurophysiology 2014 125(10),
2079-357
2089. https://doi.org/10.1016/j.clinph.2014.02.002
21. Bohórquez, J., Lozano, S., Kao, A., Toft-Nielsen, J., & Ö zdamar, Ö . Deconvolution and modeling of
359
overlapping visual evoked potentials. In 29th IEEE Southern Biomed. Eng. Conf. 2013, May. (pp. 31-32).
360
https://doi.org/10.1109/SBEC.2013.24
361
22. Diez, P. F., Müller, S. M. T., Mut, V. A., Laciar, E., Avila, E., Bastos-Filho, T. F., & Sarcinelli-Filho, M.
362
Commanding a robotic wheelchair with a high-frequency steady-state visual evoked potential based
363
brain–computer interface. MED. ENG. PHYS., 2013, 35(8), 1155-1164.
364
https://doi.org/10.1016/j.medengphy.2012.12.005
365
23. Kaya, I., Bohorquez, J. E., & Ozdamar, O. Brain Computer Interface Switch Based on
Quasi-Steady-366
State Visual Evoked Potentials. In 9th Int. IEEE/EMBS Conf. on Neural Eng. (NER) (2019, March) (pp.
367
1175-1178). IEEE. https://doi.org/10.1109/NER.2019.8716894
368
24. Heinrich, S. P., & Bach, M. Adaptation dynamics in pattern-reversal visual evoked
369
potentials. Documenta Ophthalmologica, 2001, 102(2), 141-156. https://doi.org/10.1023/A:1017509717071
370
25. Thompson, D. E., Stefanie, B. M., Jane, E. H. "Performance assessment in brain-computer
interface-371
based augmentative and alternative communication." Biomed. Eng. Online 2013 12(1) : 43
372
https://doi.org/10.1186/1475-925X-12-43
373
26. Vialatte, F. B., Maurice, M., Dauwels, J., & Cichocki, A. Steady-state visually evoked potentials: focus
374
on essential paradigms and future perspectives. Prog. Neurobiol. 2010, 90(4), 418-438.
375
https://doi.org/10.1016/j.pneurobio.2009.11.005
376
377
378
379
380
381
382
383
384
385
386
387
388
389
390
391
392
393
394
395
396
Supplementary
398
Table S1. Single sweep (0.5s) QSS-VEP accuracy, ITR, SNR and RMS values for all rates and subjects.