Force Reduction Factors for the Seismic Evaluation of Nuclear Structures
Greg Mertz1) and Tom Houston2)
1) Westinghouse Savannah River Company, Aiken, SC 2) Structural Dynamics Engineering, Augusta, GA ABSTRACT
There is a strong need to quantify the expected performance of structural systems to obtain realistic estimates of seismic performance. This need is driven by the desire to demonstrate adequate margins against seismic failure; and to minimize personnel exposure and cost associated with unnecessary structural modifications. These seismic evaluations have traditionally been performed using elastic analysis techniques and when compared directly to the allowable stress in design codes may be quite conservative. The use of force reduction factors would allow a better picture of the seismic demands on systems, structures, and components.
This paper proposes a methodology to develop force reduction factors that are appropriate for the evaluation of nuclear facilities. These force reduction factors are functions of (1) the acceptable limit state; (2) the structural system, material, and detailing for each individual element; (3) the structure’s natural frequency; and (4) the influence of higher modes and soft stories. The acceptable limit state, structural system, material and detailing are used to develop allowable element ductilities. Individual element ductilities are modified to account for either MDOF or soft story effects. These modified element ductilities are combined with the structure’s natural frequency and an appropriate SDOF dynamic model to develop the force reduction factor. SDOF dynamic models for both bilinear and pinched hysteresis loops are considered, which address the behavior of structures ranging from moment frames and braced frames to shear controlled shear wall structures.
This methodology also provides for the inclusion of the structural overstrength which is a function of the degree of redundancy in the structural system and the conservatism in code member capacities. Overstrength may be determined by pushover analysis, similarity with a previous analyses, or be conservatively neglected. Seismic member demands are reduced by both the inelastic force reduction factor and overstrength; combined with the non-seismic demands; and compared to the member capacity on a member by member basis. The value of the force reduction factor varies depending on the individual ductility of each element.
The inelastic force reduction factor methodology is applicable to a broad range of limit states ranging from barely perceptible inelastic deformation to large amounts of inelastic deformation just short of collapse. Sufficient literature data is available to apply this methodology to steel, reinforced concrete and masonry structures with both code and non-code compliant seismic detailing. The inclusion of non-code compliant detailing is essential for the evaluation of existing facilities. The methodology can also be adapted to develop force reduction factors for equipment supports.
INTRODUCTION
There is a strong need to quantify the expected performance of structural systems to obtain realistic estimates of seismic performance. This need is driven by the desire to (1) demonstrate adequate margins against seismic failure; and (2) to minimize personnel exposure and cost associated with unnecessary structural modifications. These seismic evaluations have traditionally been performed using elastic analysis techniques and when compared directly to the allowable stress in design codes may be quite conservative. The use of force reduction factors would allow a better picture of the seismic demands on systems, structures, and components.
The engineering community has recognized for many years that structures capable of inelastic response absorb energy and can withstand the effects of seismic loads much better than strong, brittle structures. This phenomena is accounted for in commercial building codes which divide the elastically determined base shear by Factors. However, R-Factors are not universally appropriate because (1) they correspond to a damage state that may not be acceptable for nuclear facilities; (2) R-Factors implicitly include overstrength of the structural system, which is modeled after commercial buildings and may not be appropriate for nuclear facilities; and (3) the detailing in older nuclear structures may not support the ductilities required to develop these R-factors.
Force reduction factors, m, were also developed for the evaluation of existing conventional structures for the Federal Emergency Management Agency, FEMA [2]. These force reduction factors are based on a range of limit states and detailing practices but did not explicitly consider frequency dependency, MDOF effects, or overstrength. Additionally, the FEMA methodology reduces both the seismic and non-seismic demand by the m factor, which is difficult to justify on the basis of energy dissipation alone.
This paper proposes a methodology to develop force reduction factors that builds on the DOE force reduction factor, Fµ, by including the ductility and limit state information for individual members from FEMA and adding provisions that consider frequency dependency, MDOF effects, and overstrength.
METHODOLOGY
Force reduction factors that account for the inelastic energy dissipation in nuclear structures during seismic events are developed below. These factors are dependant upon the magnitude of deformation, or Limit State, that a structure may withstand while maintaining it’s functionality.
The force reduction factor, Fµ, for a structure is a function of the ductility for a given limit state, µLS, its natural frequency, the shape of its hysteresis loops and the amplification of ductility, λ, due to MDOF response or weak story amplification. The element ductility for a given limit state, µLS, is also a function of the element type, detailing and stress levels and varies from member to member. Since Fµ is a function of ductility, it also varies from member to member. Fµ is based on a frequency dependant force reduction factor for a SDOF system, Fµs, and is modified to account for MDOF effects by
λ µ µ =
µ LS
s F
F (1)
To simplify application of the methodology, frequency dependant charts of Fµ are developed for a range of ductilities that are applicable to most structural systems.
This methodology also provides for the inclusion of overstrength, Ω, of the structure which is a function of redundancy in the structural system and the conservatism in code member capacities. The overstrength may be determined by pushover analysis, similarity with a previous analysis, or be conservatively neglected.
Both Fµ and Ω are used on a member by member basis to modify the seismic demand and compare it to the member’s code capacity.
Capacity Code
Demand Nonseismic
F Demand Seismic
< +
µ
Ω (2)
The methodology presented is consistent with a mean seismic hazard evaluation. Limit States and Allowable Ductility
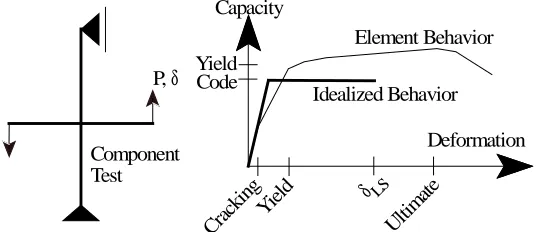
Figure 1 contains a typical structural joint subject to a monotonically increasing load representative of the seismic loads in a rigid frame with lateral sway. As the load and deformation increase the member cracks, the reinforcing bars yield, and near the ultimate load capacity, the concrete in this under-reinforced beam crushes, which leads to a loss of strength.
Crac kingYield
Ultima te Yield
Code Capacity
Deformation Element Behavior
Idealized Behavior
δLS
P, δ
Component Test
Thus, structural damage is a function of displacement. Structural damage in a nuclear facility can be limited by controlling displacement.
The load deformation curve in Figure 1 is typical for plastic hinges in reinforced concrete beams with fully developed reinforcing. Under-developed reinforcing will reduce the load carrying capacity of the joint and cause more damage at a lower displacement than fully developed reinforcing.
The deformations corresponding to different damage levels or limit states have been compiled in FEMA-273 for elements with various levels of seismic detailing. The FEMA-273 limit states, in order of decreasing allowable displacement or damage, are:
• Collapse Prevention – the displacement that generally corresponds to the ultimate capacity. This displacement is reduced for brittle structures.
• Life Safety – about 75% of the collapse prevention displacement.
• Immediate Occupancy – the displacement corresponding to small amounts of inelastic deformation. An additional limit state which does not allow yielding is referred to as the Operational limit state.
The allowable damage in a confinement structure may be limited to hairline cracking without any visible permanent deformation, corresponding to the Immediate Occupancy Limit State. Alternatively, for a non-safety-class structure over safety-class equipment, the structure's damage may not be important as long as it does not collapse on the equipment (II/I) and a Collapse Prevention Limit State may be appropriate for the structure. Life safety is the performance goal for most conventional building codes. As seen by the containment and II/I examples above the life safety limit state used by conventional building codes may not be appropriate for nuclear structures.
The ACI 349 or ACI 318 code for reinforced concrete and the AISC LRFD code for steel structures provide reliable lower-bound structural capacities. Building on these lower bound capacities, the idealized response of the element is also shown in Figure 1 as an elasto-plastic curve with a yield value equal to the code capacity and an allowable displacement, δLS, corresponding to the desired limit state. The limit state ductility, µLS, is the ratio of the limit state displacement to the code capacity displacement, or
Capacity Code
LS LS
δ δ =
µ (3)
The FEMA-273 m values are 75% of the ductility corresponding to the mean yield strength. These m values can be modified to provide the ductility for each desired limit state, µLS.
Project specific testing may be required to determine the ductility for elements that fall outside of the data set currently available. Sufficient testing should be used to determine a mean estimate of the limit state.
System Behavior and Overstrength
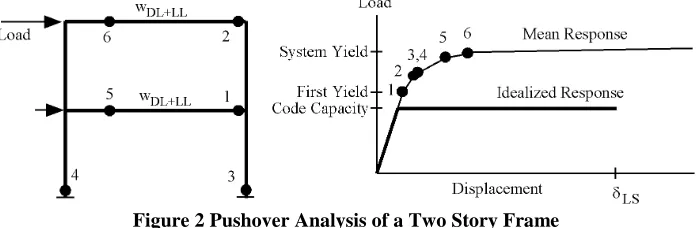
Figure 2 shows a mean pushover analysis of a typical two-story portal frame. Numbers in the figure correspond to the order of hinge formation. The system yield point corresponds to the formation of a global collapse mechanism. First yield corresponds to the formation of Hinge 1 in the second floor beam. In this example, the ratio of the system yield to the first yield is about 1.5. Removing gravity loads from the floor and roof beams reduces the ratio of the system yield to the first yield is about 1.16. This ratio varies widely depending on the presence of gravity loads, and the degree of redundancy in the structural system.
Figure 2 Pushover Analysis of a Two Story Frame
the code capacity is roughly between 0.9/1.1=0.8 and 0.9/1.5=0.6 of the first yield capacity, for reinforced concrete and structural steel members.
Overstrength, Ω, is the ratio of the mean system yield strength to code capacity. For the example in Figure 2 the range of overstrength is
= × = × = × = = Ω 5 . 2 6 . 0 1 5 . 1 9 . 1 8 . 0 1 5 . 1 Code Yield First Yield First Yield System Code Yield System (4)
Removing the gravity loads from the example in Figure 2 can yield an overstrength as low as 1.4. The overstrength of frames used in commercial construction ranges from 1.8 to >5 [3]. An overstrength of 2 to 3 is typically included in the R force reduction factor used by the UBC and IBC codes, which is appropriate for commercial facilities. However, nuclear facilities seldom have the regular framing plan of commercial buildings and the overstrength associated with these facilities can vary considerably.
For example, the overstrength of a specific moment frame in a nuclear materials processing building is about 3.3 [4], while the overstrength in a non-redundant reinforced concrete box system may be as low as 1.25. Since there is such a wide variability in overstrength for nuclear facilities, the overstrength for a given facility should be determined on a case-by-case basis. Alternatively, the overstrength may be conservatively set equal to one and evaluation based on the code capacity alone.
If overstrength is considered, then an equivalent system ductility is developed by limiting the system displacement to the smallest allowable element displacement, and the corresponding base shear is the system yield base shear. Note that the first element to yield may not necessarily limit the system ductility. For example, the beams in Figure 2 may yield first but the rotation of the hinge at the base of the column may limit the allowable displacement of the frame, since the axial load effect in columns typically reduces the allowable ductilities below that permitted for beams.
Frequency Dependent SDOF Force Reduction Factor, Fµs
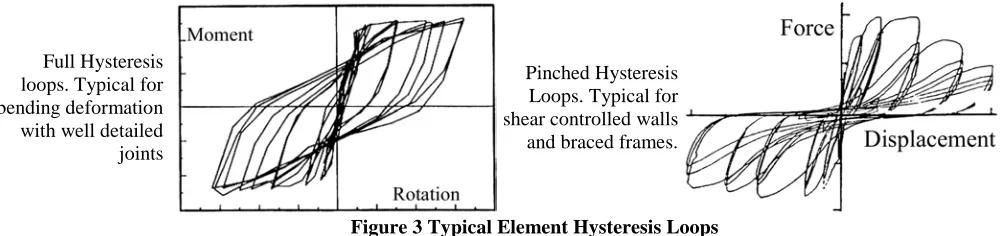
Hysteresis loops are shown in Figure 3 for two different elements. The first element has full, stable hysteresis loops which are capable of dissipating significant amounts of energy. The second has pinched hysteresis loops which dissipate less energy. It is important to match the type of hysteresis model used in analysis with the element behavior. For example, using an elasto-plastic hysteresis model with full hysteresis loops would overestimate the energy dissipation for a structure with pinched hysteresis loops and could lead to unconservative results.
Full Hysteresis loops. Typical for bending deformation with well detailed joints
Pinched Hysteresis Loops. Typical for shear controlled walls and braced frames.
Figure 3 Typical Element Hysteresis Loops
Structures dominated by bending deformation with good detailing typically have full hysteresis loops. Numerous researchers have investigated the frequency dependence of the force reduction factor for SDOF structures, Fµs, with full hysteresis loops using elasto-plastic, bilinear and stiffness degrading hysteresis models using a variety of soil conditions and ground motions. Miranda and Bertero [5] provides an excellent review of these studies. The results of these studies can be characterized by the simple expression
) f ( Ln ) f ( Ln ) f ( Ln ) f ( Ln r f f 0 . 1 f f f f f s F AV RB AV RB RB AV r 1 AV − − = < ≤ < µ ≤ µ =
Where fAV is the frequency of the lower end of the constant acceleration region, and FRB is the rigid body frequency. For western ground motions and most design spectra, the constant acceleration region begins around 1-2 hertz (fAV=1) and the response is rigid above 30 hertz (fRB=30).
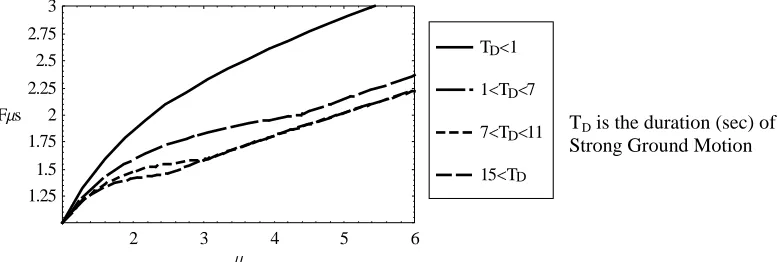
Concrete structures dominated by shear deformation and steel braced frames typically have pinched hysteresis loops. Kennedy, et. al. [6] developed force reduction factors for structures with pinched hysteresis loops, which, in the constant acceleration region can be simplified to Figure 4. The force reduction factor for frequencies below the constant acceleration region is larger than that shown in Figure 4.
2 3 4 5 6
m 1.25
1.5 1.75 2 2.25 2.5 2.75 3
Fms
15<TD 7<TD<11 1<TD<7 TD<1
TD is the duration (sec) of Strong Ground Motion
Figure 4 Force Reduction Factor for Pinched Hysteresis Loops in the Constant Acceleration Range
Note that both Equation 5 and Figure 4 provide force reduction factors for SDOF structures that are dependent on an allowable systems ductility. These force reduction factors are modified in the following section to account for either MDOF or weak story effects.
MDOF vs SDOF response
Given similar SDOF and MDOF structures with the same base shear. The maximum ductility demand in the MDOF structure may be larger than the SDOF structure because of the effect of higher modes in the MDOF structure. The ratio of the maximum ductility in the MDOF structure to the ductility of the SDOF structure is represented by λ, or
SDOF MDOF
µ µ =
λ (6)
Krawinkler, et. al. [7] studied a series of moment frames and determined the ratio of MDOF ductility to SDOF ductility at different periods. A fit to the Krawinkler data for moment frames with hinges forming in the beam elements is given by λBH
85 . 0 e 0.54lnf 0.18
BH = ≥
λ − + (7)
Similar expressions have been developed for moment frames with column hinges.
In some structures most of the ductility is concentrated into a single weak story. Weak stories can be caused by structural discontinuities. The potential for a weak story can also occur exist in braced frames because the same bracing element is used over a number of stories and the bottom story, having the largest demand, yields first thereby isolating the higher stories from additional load. Reed has proposed a MDOF to SDOF ductility modification factor for the bounding case where all of the ductility in the structure is concentrated into a singe story. Reed’s modification factor when the weakest story is the bottom story is:
Story Story ed
Re
2 1 n
) 1 n (
µ + −
µ + =
λ (8)
Inelastic Force Reduction Factor, Fµ
The expressions in Equation 5 and Figure 4 have been used to develop figures relating frequency, element ductility, and Fµ, for beam hinge moment frames, column hinge moment frames, structures with weak stories, braced frames and shear wall structures. An example force reduction curve is shown in Figure 6 for a moment frame with hinges in the beams.
Figure 5 Frequency Dependant Force Reduction Factor for Beam Hinge Moment Frames
Examining Equation 5, Fµ for a SDOF structure, Fµs, would have a constant value of Fµs=µ below 1 hertz and decrease gradually to Fµs=1 at 30 hertz. The MDOF ductility is about 85% of the SDOF ductility for frequencies above 2 hertz. Below two hertz, the MDOF effect reduces the system’s ductility and below 1 hertz the MDOF effect is responsible for a reduction in Fµ, as seen in Figure 5.
Figure 5 can be used for design by selecting the allowable element ductility and structural frequency and reading off the appropriate value of Fµ. Alternatively, a representative frequency range and ductility for a particular type of structure can be used to select a frequency independent Fµ. For example, consider a reinforced concrete special moment resisting frame at the FEMA-273 Life Safety (LS) limit state. Conservatively neglecting the difference between mean and code yield capacity yields the FEMA-273 LS ductility of 6, µElement=6, for hinges in beams with low shear (slender beams). Further assuming that the frequency of a SMRF in a nuclear facility will be less than 3 hertz and greater than 0.5 hertz then, the force reduction factor from Figure 5 is Fµ=4.
APPLICATIONS
The following examples illustrate how inelastic force reduction factors are used in building and equipment support evaluations.
Reinforced Concrete Building
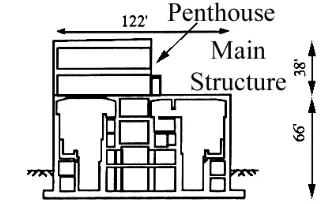
An appropriate force reduction factor for an element in the nuclear material processing facility, shown in Figure 6 [4], is developed in this example. The main structure is a 1 to 1.5 hertz rigid frame constructed of reinforced concrete walls and slabs. The roof top penthouse is a rigid shear wall structure. Although the rigid frame in Figure 6 appears quite complex, it’s primary lateral load resisting path is the external walls and roof of the main structure which form a rigid frame. The interior core structure transmits gravity loads and provides a secondary lateral load path. In this example a collapse prevention limit state is assumed.
The bending moment in the exterior walls are examined in this example. The walls have low axial stress (<0.1 f’c) and low shear stress (<3 f’c). Using the FEMA-273 values for reinforced concrete beams with non-conforming stirrups, low shear and low axial stress, yields an m value of 4. The FEMA-273 m values are 75% of the ductility corresponding to the mean yield strength. Since the code capacity is less than 80% of the yield capacity, the displacement at code capacity is also 80% of the yield displacement. Thus, the ductility corresponding to the mean yield strength is 1/0.8=1.25. Converting the FEMA-273 m value to a mean ductility µ=m/.75=4/.75=5.3, and converting the mean ductility to a code based ductility yields µ=µ/0.8=5.3/0.8=6.6. Entering Figure 5 with a ductility of 6.6 and a frequency of 1 to 1.5 hertz yields Fµ =5.3.
Extensive studies have demonstrated that the dynamic response of this building is dominated by the first mode. Thus, MDOF effects may be neglected by using Equation 5 to calculate Fµ , with f=1.5 hertz, fAV=1 and fRB=30 hertz, yielding Fµ=5.25. Acceptance of the exterior walls is then demonstrated by showing that the elastically calculated demand, MDemand divided by Fµ to account for inelastic behavior is less than the code capacity, φMn.
Pushover analyses were also performed and demonstrated that the yield plateau for the structure was 3.3 times the code capacity of the first yielding element, or Ω=3.3. Using a ductility of 5.3, to avoid double counting the difference between mean and code capacity, and Equation 5 yields Fµ=4.3. Then, acceptance of the exterior walls is demonstrated by Equation 2.
Note that the product of Ω Fµ of 14, which is larger than the R value commonly associated with special moment resisting frames. The magnitude of this force reduction is reasonable because (1) the Collapse Prevention limit state used in this example is larger than the Life Safety limit state used to develop R values; and (2) a ductility consistent with low shear and axial load was used whereas special moment resisting frames may have high shears and axial loads, which necessitate lower allowable ductilities.
An additional evaluation must be performed to demonstrate that the member ductility of 5.3 used for the wall element is not limited by another member in the structure. Since the response of this structure is dominated by the first mode, this can be achieved by tracking the hinge rotations during the pushover analysis. The first hinge to reach it's limit state displacement, δLS, defines the structures limit state displacement and limits the ductility of other members in the structure. Equipment Support
The force reduction factor for an equipment support is developed in this example. Assume that (1) the capacity of the equipment support is governed by bending of the base plate; (2) the support has a 6 hertz natural frequency; and (3) that the supported equipment can only tolerate a displacement that is four times the yield displacement, or µ=4. Further assume that this is a cantilever support which will behave with a single degree of freedom. Calculating the force reduction factor from Equation 5 yields Fµ=1.9.
Recall that free field earthquake records were used to develop the frequency dependent force reduction factors, Fµ. Equipment mounted in a structure is subject to the input free field motion modified by the stucture, described by the in-structure response spectra. This modified motion will have a different spectral shape than the ground motion as shown in Figure 7.
0.1 0.5 1 5 10 FrequencyHHzL 0.2
0.4 0.6 0.8 1
la
rt
ce
p
Sn
oit
ar
el
ec
c
A
H
g
L
A B
C In-Structure ResponseSpectra Spectrafor Point A
Spectrafor Points B & C
Figure 7 In-Structure Response Spectra
For equipment with a natural frequency in region A of Figure 7, which has a natural frequency below the structures natural frequency, both the ground and in-structure response spectra are similar. Thus, seismic demands in this region are based on the in-structure response spectra, and reduced by Fµ as described for structures.
support. One potential improvement would be to use Equation 5 with a modified fAV such that a modified pseudo-ground spectra envelopes the in-structure response spectra.
For equipment with a natural frequency above the structure’s natural frequency, such as Point C in Figure 7, the use of Fµ with the in-structure response spectra can be non-conservative. Recall that nonlinear deformation reduces the effective natural frequency and could shift the equipment into a region of higher acceleration. For this case the equipment may conservatively be designed to the smaller of (1) the peak in-structure spectral acceleration with Fµ > 1; or (2) the in-structure spectral acceleration at the equipment’s natural frequency with Fµ=1.
CONCLUSION
This paper proposes a methodology to develop force reduction factors that are appropriate for the evaluation of nuclear facilities. These force reduction factors are functions of (1) the acceptable limit state; (2) the structural system, material, and detailing for each individual element; (3) the structure’s natural frequency; and (4) the influence of higher modes and soft stories. The acceptable limit state, structural system, material and detailing are used to develop allowable element ductilities. Individual element ductilities are modified to account for either MDOF or soft story effects. These modified element ductilities are combined with the structure’s natural frequency and an appropriate SDOF dynamic model to develop the force reduction factor. SDOF dynamic models for both bilinear and pinched hysteresis loops are considered, which address the behavior of structures ranging from moment frames and braced frames to shear controlled shear wall structures.
This methodology also provides for the inclusion of the structural overstrength which is a function of the degree of redundancy in the structural system and the conservatism in code member capacities. Overstrength may be determined by pushover analysis, similarity with a previous analyses, or be conservatively neglected. Seismic member demands are reduced by both the inelastic force reduction factor and overstrength; combined with the non-seismic demands; and compared to the member capacity on a member by member basis. The value of the force reduction factor varies depending on the individual ductility of each element.
The inelastic force reduction factor methodology is applicable to a broad range of limit states ranging from barely perceptible inelastic deformation to large amounts of inelastic deformation just short of collapse. Sufficient literature data is available to apply this methodology to steel, reinforced concrete and masonry structures with both code and non-code compliant seismic detailing. The inclusion of non-code compliant detailing is essential for the evaluation of existing facilities. The methodology can also be adapted to develop force reduction factors for equipment supports.
ACKNOWLEDGEMENTS
John Reed developed the ductility amplification factor for structures with a weak story given in Equation 8. Some of the information contained in this paper was developed during the course of work done under funding from the U.S. Department of Energy. Additional support was provided by Structural Dynamics Engineering.
REFERENCES
1. DOE-STD-1020-94, 1996, “Natural Phenomena Hazards Design and Evaluation Criteria for Department of Energy Facilities,” including Change Notice #1, January.
2. FEMA 273, 1997, “NEHRP Guidelines for the Seismic Rehabilitation of Buildings: Part 1- Provisions,” October. 3. ATC-19, 1995, “Structural Response Modification Factors,” Applied Technology Council.
4. Mertz, G.E., Loceff, F., Houston, T.W., Rawls, G.B., Mulliken, J., "Performance Based Seismic Qualification of Reinforced Concrete Nuclear Materials Processing Facilities," 6th U.S. National Conference on Earthquake Engineering, 1998.
5. Miranda, E. Bertero, V.V., 1994, “Evaluation of Strength Reduction Factors for Earthquake-Resistant Design,” Earthquake Spectra, Vol 10, No. 2, May.
6. Kennedy, R.P., Short, S.A., Merz, K.L., Tokarz, F.J., Idriss, I.M., Power, M.S., Sadigh, K., 1984, NUREG/CR-3805, “Engineering Characterization of Ground Motion: Task 1: Effects of Characteristics of Free-Field Motion on Structural Response,” May.