Performance Analysis of a Prioritized Multilevel Access
Allocation Scheme for Data Calls in GSM Networks
Kuboye B.M.
Comp. Sci. Dept F.U.T.A, Ondo State
Nigeria
Alese B. K.
Comp. Sci. Dept F.U.T.A, Ondo State
Nigeria
Falaki S.O
Comp. Sc. Dept F.U.T.A, Ondo State
Nigeria
Adewale O.S.
Comp. Sc. Dept F.U.T.A, Ondo State Nigeria
ABSTRACT
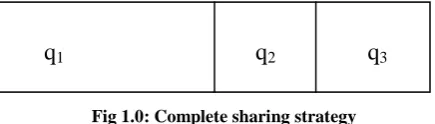
The demand of voice and data services on the Global System for Mobile Communications (GSM) is unprecedented in the annals of the history of telecommunication systems. As a result, grade of service (GoS) is no longer stable in the face of this high demand. This paper explores the use of prioritized multilevel Access Allocation (PMAA) scheme to stem the instability of data services when there is high demand. This paper classifies calls into Handover (HD), Real-Time (RT) and Non-Real-Time (NRT) based on the nature of their service and thereafter, priority was set among them. The HD has the highest priority followed by RT and NRT respectively. The channels in the cell were partitioned into three pools named as q1, q2, and q3. Data and voice calls have different characteristics, therefore, voice always have priority over data since it cannot tolerate delay in call processing. The q1 is reserved for voice only, q3 reserved for data only while q3 is reserved for handoff calls for both voice and data.
General Terms
GSM Networks
Keywords
GSM, GPRS, EDGE, Realtime, Non-Realtime, Handoff
1. INTRODUCTION
Global System for Mobile Communications (GSM) was released due to the growing demand of mobile communication which the analog systems were able to cope with. GSM is more advanced than analog systems and handles more subscribers than the analog telephones. It offers high quality voice communication and low bandwidth (96 kb/sec) data connections for fax and short message service (SMS). As a result of the success of voice communication on GSM, data connection services like browsing, videos, multimedia, and e-mail demands on mobile telephone increased tremendously, thereby necessitating the need for a reliable and always available infrastructure to support these services [7]. In the quest to meet this demand, 2.5G GSM was introduced through General Packet Radio Service (GPRS) and High Speed Circuit-Switched Data (HSCSD) to give support for these demands. Thereafter, as the demand for data connection increases and 2.5G network could not support the demand, 3rd generation GSM was introduced. Enhanced Data Rates for GSM Evolution (EDGE) was created to support Internet connectivity and packet-switched services. The data rates of the 3G ranges from 144Kbps for fast moving mobiles to 2Mps for slow moving mobile users [9]. There is always growing quest for data access on the mobile cellular radio which prompted the improvement on the 3G to 3.5G. The 4G will be the integration of the existing cellular networks and wireless LANs with added personalized mobile networks and broadband radio access networks to provide end-to-end IP connectivity.
The performance parameter in cellular radio or circuit switched depends on the Grade of Service (GOS) or Quality of Service (QoS) requirements. The main QoS parameter in circuit switched technology which GSM belongs is blocking [8]. Blocking occurs when a user wanted to use a channel for making a call and there is none available. The introduction of new data technology that doubles the speed of the previous one does not stop the congestion on the GSM network. The means of allocating the scarce channels is another issue on the overall performance of the GSM networks. Several papers have been presented on this issue and three principal categories have been identified and they are; fixed channels allocation (FCA), dynamic channel allocation (DCA) and hybrid Channel Allocation (HCA) [6]. In FCA, a set of channels is permanently allocated to each cell based on pre-estimated traffic intensity. When a user requests for a channel for communication, it searches the free channel in its own cell, if there is free channel, the communication is granted, otherwise, is blocked. DCA allows dynamic allocation of channels as new calls arrive in the system. The entire sets of free channels are kept in a central pool that will be accessible to all the cells. As soon as a call finishes using a channel, the channel is automatically returned to a central pool where it can be accessible to all the cells in the base station.
In HCA, few channels are allocated permanently to each cell and the remaining ones are in service on call basis. In other words, HCA is an integration of FCA and DCA schemes. In each of the channel allocation schemes, varying method have been proposed and investigated and more are still going to be proposed as a result of the escalating number of users always being experienced on the GSM and related networks. Due to the high demand of data on GSM networks, the channel allocation strategies are affected. New channel allocation strategies that will accommodate the data traffic on GSM network have to be implemented. Since the Radio Resource Manager (RRM) is the part of GSM Network that is charge of optimizing the usage of radio resources, new channel allocation strategies were evolved based on resource sharing algorithm implemented at RRM.
Reserving a set of time-slots for each type of traffic guarantee a minimum level of QoS for each type of traffic.
provides a better efficiency than CP which is not suitable for maximizing radio utilization, especially in highly varying demand.
Despite all these schemes highlighted, congestion continues to be a major problem in GSM networks. This paper approaches the problem of congestion by classifying calls into different classes in order to reduced congestion and also to quarantee a good level of quality of service (QoS). Each traffic type has a degree of priority attached. A call with higher level of priority can preempt a lower priority level call when there is no free channel to make a call.
2. DATA TRAFIC MODEL
In this paper, voice handoff traffic, handoff data traffic, real-time (RT) and non-real-real-time (NRT) data traffic are considered as different traffic types. The data traffic occupies pool 2 (q2)and pool 3 (q3) (see fig 1.0). Pool 2 will be shared between the handoff voice traffic and handoff data traffic. The complete sharing strategy has been proved to have a better system utilization among the other channel allocation strategies [4][2]. Therefore, the complete sharing strategy is adopted in each partition.
[image:2.595.59.277.353.415.2]
Fig 1.0: Complete sharing strategy
To guarantee the handoff voice performance, it is assumed that handoff voice traffic has preemptive priority over handoff data traffic in pool 2. Handoff voice calls is given a preemptive priority over handoff data calls because data can usually tolerate some degree of service degradation while voice is more delay sensitive [10]. When there are no channels available upon a handoff voice (hv) arrival, one of the handoff data packets in service is preempted. Likewise, to guarantee the performance of handoff data traffic (hd), when there are no channels available upon a handoff data (hd) arrival in pool 2 and pool 3, one of the NRT data packets in service in pool 3 will be preempted since hd has preemptive power over NRT and RT in pool 3. Also, RT has power to preempt non-real-time (NRT) data traffic in pool 3 if on arrival it finds no channel available for communication. When NRT calls arrives in pool 3 and no free channels available, then it will be blocked. Note that hd will be dropped if on arrival there is no RT and NRT in service and the maximum threshold to communicate with the former base station has elapsed, in the same way RT will be blocked if there is no NRT in service. Here, it is assumed that the preempted data packets are buffered in queue.
In this model, Three buffers are used to accommodate HD, RT and NRT data packets, respectively. One is for the preempted HD data packets caused by voice preemption. The other is used to accommodate preempted or blocked RT and the last is for blocked or prempted NRT data packets. Being buffered in queue, the preempted HD data packets have priority over RT data packets to obtain services. Also, the preempted packets or blocked RT have priority over NRT data packets to obtain services. All of these data calls are served in the order of priority and in case of equal priority,
first-come-first-served (FCFS) scheme is employed. The buffer size itself is regulated since there is a finite number of calls that can be accomodated and there is memorylessness in the system, therefore the size of the buffer is of the size of the capacity of the pool.
2.1 Derivation of Performance Measures
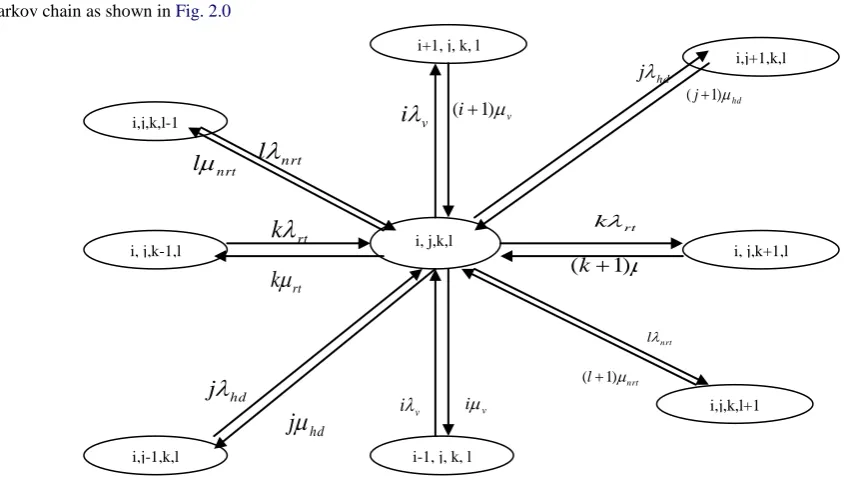
The performance analysis of radio resource allocation for multimedia traffic in this work is based on a 4-D Markov chain analysis model. The state (i, j, k, l) denote that there are i handoff voice calls, j handoff data packets, k RT data packets and l NRT data packets in the system.
l k j i
p
, , , denotes the probability of the system in state (i, j, k, l). The total number of channels in the system is C and the number of reserved channels for handoff traffic is q2 while number of channels reserved for pool 3 traffic is q3. The arrival of voice call request forms Poisson process with a rateof
v. The service time of voice calls is assumed to beexponentially distributed with a mean of
1
v. The arrivals of HD, RT and NRT data packets are assumed to be Poissonprocesses with rates
hd
rt and
nrt , respectively, andnrt rt hd
d
is the aggregate data arrival rate. Assuming that
osis the mean arrival rate of new call forservice type s of one user, it follows that
ohd,
ortand
onrt are the mean arrival rates of new call for service type HD, RT and NRT of one user of those classes respectively. The handoff data arrival rate depends on the number of active users (xs) in the system since if there is no user there cannotbe any handoff. So it is given as
hd=x
s
oh.2.2 Service Holding Time
The service holding time of HD, RT and NRT data packets is exponentially distributed with a mean of
1
hd,1
rt andnrt
1
respectively . The aggregate mean service rate isnrt rt hd
d
1 1 1
1 . It has been shown that it is reasonable
to assume that the service of most data are exponentially distributed, for some that are not exponentially distributed, they can be mounted on an exponentially distributed service rate that depends on state x through a bit rate bs(x), of this service [1]. According to the model, the service rate of type s that are exponentially distributed was given as
o s s
s
x
x
(
)
while the one that will be mounted on an exponentially distributed service due to low holding time was given asso s s s
m x b x
x) ( )
(
, mso is the mean message size of type
s calls. For simplicity, in this model, the second assumption is adopted since all data that are not exponentially distributed can be mounted on exponentially distributed service. Therefore, service rate of HD, RT and NRT
are
hd hd hd hd
m
b
j
,rt rt rt rt
m
b
k
andnrt nrt nrt nrt
m
b
l
2.3 The Underlying Markov Chain
The proposed scheme here can be modeled with a 4-D Markov chain as shown in Fig. 2.0
`
[image:3.595.68.491.96.341.2]
Fig 2.0: Four State Markov Chain for Data Analysis
The state space of the Markov chain is
)
)
(
,
)
(
,
)
)(
(
),
)
(
((
lim
)
:
:
:
(
i
j
k
l
P
q
2t
i
q
2q
3t
j
q
3t
k
q
3t
l
P
t
Let S be the set of feasible states,
}
0
,
0
,
0
,
0
|
)
,
,
,
{(
i
j
k
l
i
q
2j
q
2q
3k
q
3l
q
3S
For all
i
,
j
,
k
,
l
s
, the transition states of the Markov process are as follows:(a) Sv (i, j, k, l) is the transition rate from state (i, j, k, l) to (i+1, j, k, l, m). A voice user is admitted into the system as long as the number of voice users in the q2 is less than the number of available channels in q2 or at least a data user is present in q2, Therefore, Sv(i, j, k, l, m) can be written as
2, , ,
0 ,
, 0
q i if
otherwise v
sv l k j i
S
(b) Hd (i, j, k, l) is the transition rate from state (i, j, k, l) to (i, j+1, k, l). A handoff data user is admitted into the system when the total number of Sv and Hd less than the number of available channels in q2 or the total number of Hd q3
Therefore, Hd (i, j, k, l) can be written as
2 3, , , ,
,
, 0
q j or q j i if
otherwise d
hd m l k j i
H
(c) RT (i, j, k, l) is the transition rate from state (i, j, k, l) to (i, j, k+1, l). A RT data user is admitted into the system when the total number of HD and RT are less than the number of available channels in q3. Therefore, RT (i, j, k, l) can be written as
3, , ,
,
,
0
q
k
j
if
otherwise
T
rt
l k j i
R
(d)
NRT (i, j, k, l) is the transition rate from state (i, j, k, l) to (i, j, k, l+1). A NRT data user is admitted into the system when the total number of HD, RT and NRT are less than the number of available channels in q3. Therefore, NRT(i, j, k, l) can be written as
3, , ,
,
, 0
q l k j if
otherwise RT
n rt l
k j i
N
The balance equation for the Markov process is expressed as
l
k
j
i
1
,
,
,
. {i
v( i,j,k,l) +i
v( i,j,k,l) +j
hd ( i,j,k,l) +j
hd ( i,j,k,l) +k
rt( i,j,k,l) +rt k
( i,j,k,l)+
l
nrt (i,j,k,l) + lnrt( i,j,k,l)}=
i1,j,k,l.i
v(I-1, j, k, l) + i1,j,k,l.(i1)
v(i+1,j,k,l) +
i,j1,k,lj
hd(i,j-1,k,l)+
i,j1,k,l.(
j
1
)
hd(i,j+1,k, l) +
i,j,k1,lk
rt(i,j,k-1,l) +
i,j,k,lrt k 1)
( (
i,j,k+1,l) +
i,j,k1,llnrt (i,j,k,l-1) +
i,j,k,l1(
l
1
)
nrt ( i,j,k,l+1)By applying the constraint 1
, ,
,
s ijklto the set of balance
equations, the steady-state Probability
i,j,k,l can benrt
l
nrt
l
rt
k
rt
k
rt
k
nrt l 1) (
hd
j
hd
j
iv ivnrt
l
rt
k
1
)
(
v
i
(i1)vhd
j
hd
j 1) (
i, j,k,l i+1, j, k, l
i,j+1,k,l
i, j,k-1,l i, j,k+1,l
i,j-1,k,l i-1, j, k, l i,j,k,l-1
obtained to evaluate the performance metrics of the system. The steady state probability is obtained as follows:
!
.
!
.
!
.
!
.
)
0
,
0
,
0
,
0
(
1
, , ,l
k
j
i
P
l k j hd i v l k j i nrt rt
………3.32where P(0, 0,0,0,0) is the steady-state probability of the system being idle. From the normalization
equation,
i,j,k,l
1
s
,
1 0 ! ) ( ) 0 , 0 , 0 , 0 ( q C a a nrt aP v hd rt ………3.33
where a = i + j + k + l and
. Hence the stateprobability is obtained as
1 0 , , , ( ) ! ! . ! . ! . ! q C a a d nv rv hv sv l k j hd i v l k j i a l k j i nrt rt Using the state probability, the following performance metrics are derived:
i Handoff Data Packet blocking: A handoff data call is blocked when upon arrival, q2 is filled up with Sv and Hd and q3 is filled up with Hd. The packet blocking probability of HD data traffic, Prtb, is expressed as
2 2 3 3 30 0 0 0
, , , q i q i q j q k q l l k j i hdb
P
...3.35ii A Real-time data call is blocked when upon arrival; q3 is filled up with Hd and RT. The packet loss probability of RT data traffic, Prtb, is expressed as
2 2 3 3 30 0 0 0
, , , q i q q j j q k q l l k j i rtb
P
... 3.36iii The packet blocking probability of NRT traffic, Pnrt, was expressed as
2 2 3 3 30 , , , 0 0 ) ( 0 q i l k j i q q j q k k j q l nrtb
P
...3.373. ANALYTICAL SIMULATION AND
PERFORMANCE RESULTS FOR DATA
COMMUNICATION MODEL
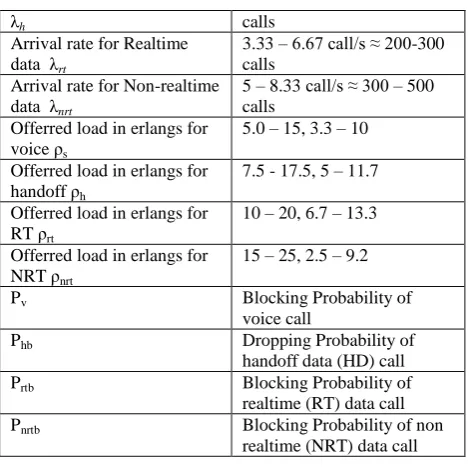
[image:4.595.314.549.67.301.2]In this paper, the parameters used in the analytical simulation are listed in the table 1.0.
Table 1.0: Data Analytical Simulation Parameters
Total channel in the cell 22 Total channel for q2 6 Total channel for q3 5
Service rate
1
d 600s, 300sArrival rate for voice λv 1.67 – 5.0 call/s ≈ 100 – 250 calls
Arrival rate for handoff data 2.5 – 5.83 call/s ≈ 150-250
λh calls
Arrival rate for Realtime data λrt
3.33 – 6.67 call/s ≈ 200-300 calls
Arrival rate for Non-realtime data λnrt
5 – 8.33 call/s ≈ 300 – 500 calls
Offerred load in erlangs for voice ρs
5.0 – 15, 3.3 – 10
Offerred load in erlangs for handoff ρh
7.5 - 17.5, 5 – 11.7
Offerred load in erlangs for RT ρrt
10 – 20, 6.7 – 13.3
Offerred load in erlangs for NRT ρnrt
15 – 25, 2.5 – 9.2
Pv Blocking Probability of voice call
Phb Dropping Probability of handoff data (HD) call Prtb Blocking Probability of
realtime (RT) data call Pnrtb Blocking Probability of non
[image:4.595.55.289.94.290.2]realtime (NRT) data call
Fig. 3.0 show the blocking probabilities of Data traffic for all data types in the presence of voice call when simulation was done with service time of 600s and 300s. The blocking probability under 600s was higher than the one done with 300s. 0 0.1 0.2 0.3 0.4 0.5 0.6 0.7 0.8
Pb1 Pb2 Pb3 Pb4 Pb5
Pb of service time of 600s
Pb 0f service time of 300s
[image:4.595.324.540.361.505.2]Fig 3.0: Graph representation of Data traffic probabilities in the presence of Voice call
Fig. 4.0 show the blocking probabilities of data traffic when there is no voice traffic in q2 that shows there are more channels available for the HD users in q2, this account for the further reduction of blocking probabilities of data traffic in the cell.
0 0.1 0.2 0.3 0.4 0.5 0.6 0.7
Pb1 Pb2 Pb3 Pb4 Pb5
Pb with service time of 600s
Pb with service time of 300s
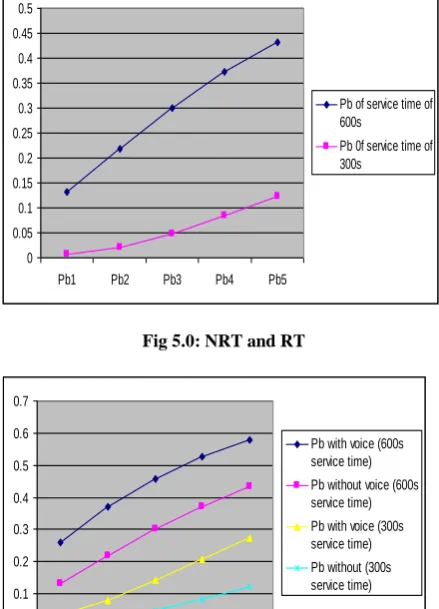
[image:4.595.322.526.604.755.2]Fig. 5.0 show a situation where we have NRT and RT in q3 only. Since there is no HD traffic to compete with the RT and NRT in q3, there is further reduction in probabilities when compared with when HD was present in Fig 6.0
0 0.05 0.1 0.15 0.2 0.25 0.3 0.35 0.4 0.45 0.5
Pb1 Pb2 Pb3 Pb4 Pb5
Pb of service time of 600s
[image:5.595.319.527.72.248.2]Pb 0f service time of 300s
Fig 5.0: NRT and RT
0 0.1 0.2 0.3 0.4 0.5 0.6 0.7
1 2 3 4 5
Pb with voice (600s service time)
Pb without voice (600s service time)
Pb with voice (300s service time)
Pb without (300s service time)
Fig 6.0: NRT and RT for Two Service Rates
Fig 7.0 show a situation when HD occupying q2 and RT occupy q3. The least blocking probabilities are achieved when te was applied to the HD.
0 0.05 0.1 0.15 0.2 0.25 0.3 0.35 0.4
Pb1 Pb2 Pb3 Pb4 Pb5
Pb of service time of 600s
[image:5.595.61.280.135.303.2]Pb 0f service time of 300s
Fig 7.0: HD and RT
Fig 8.0 show a situation when HD occupying q2 and NRT occupy q3. The least blocking probabilities are achieved when te was applied to the HD.
0 0.05 0.1 0.15 0.2 0.25 0.3 0.35 0.4 0.45
Pb1 Pb2 Pb3 Pb4 Pb5
Pb of service time of 600s Pb 0f service time of 300s
Fig 8.0: HD and NRT
4. CONCLUSION
In this paper, an analytical model of a prioritized multilevel access allocation (PMAA) scheme for data calls in cellular networks is developed. The PMAA scheme is modeled using a four-dimensional markov chain and numerical analysis is presented to estimate blocking probabilities of non-real-ime and real-time data calls, dropping probabilities of handoff data calls. The scheme is tested under different time ranges in other to find a better scenerio where congestion will be minimized that still return a profit gain to the operator. PMAA aims is to increase the users satisfaction by reducing the blocking and dropping probabilies of calls as well as increase the operators’ satisfaction by increasing the utilization of the bandwidth available. Hence, both users’ and service providers’ satisfactions are balanced in the PMAA scheme.
5. REFERENCES
[1] Begain K., Ermel M., Muller T., Schueller J. and Schweigel M. (2000): "Analytical Call Level Model of GSM/GPRS Network", in Proceedings of Spects'00, SCS Symposium on Performance Evaluation of Computer and Telecommunication Systems, Vancouver, Canada.
[2] Budura G. , Baling C. , Budura A. , and Marza E. , (2009), “Traffic Models and Associated Parameters in GSM/(E)GPRS Networks, WSEAS Transactions on Communications”, Issue 8, Volume 8
[3] Dahmouni H., MORIN B. and VATON S., (2005) “Performance Modeling of GSM/GPRS Cells with Different Radio Resource Allocation Strategies”, Methods and Tools for Traffic Engineering, France Telecom R & D, Belfort, France.
[4] Ermel M., Begain K., Muller T., Schuler J. , and Schweigel M., (2002). “Performance of GSM Networks wit General Packet Radio Services, Performance Evaluation, Vol. 48, Pg. 285-310, May 2002.
[5] Fang and Ghosal (2003). “Performance Modeling and QoS Evaluation of MAC/RLC Layer in GSM/GPRS Networks”. Proceeding of IEEE ICC, Alaska, USA.
[image:5.595.59.279.145.450.2] [image:5.595.61.292.546.725.2][7] Hartel, Levine R. Livingtone G. (1999). “GSM Superphones”, McGraw-Hill.
[8] Janeviski T., (2003). Traffic Analysis and Design of Wireless IP Networks 2003 Artech House, INC ISBN 1-58053-331-0.
[9] Prasad and Muñoz, (2003). “WLAN and WPAN towards 4g Wireless”, Norwood, Ma: Artech House