Child Mortality In China And Vietnam
In A Comparative Perspective
Alberto, Gabriele and Schettino, Francesco
Polytechnic University of Marche, University of Rome "la Sapienza"
and UNCTAD-UN
July 2006
Online at
https://mpra.ub.uni-muenchen.de/3987/
CHILD MORTALITY IN CHINA AND
VIETNAM IN A COMPARATIVE
PERSPECTIVE
Abstract
This paper analyzes China’s and Vietnam’s performance in reducing under-five child mortality in a comparative perspective. Under the market socialist model, both countries achieved very high rates of GDP growth, but income distribution and the provision of key public services deteriorated. As a result, child mortality reduction in China and Vietnam was only partially satisfactory. However, although the former grew faster and is more economically developed, Vietnam’s record in this area was markedly better than China’s. We show that this apparent paradox is due mainly to two reasons. One is related to the relative status of women, which is better in Vietnam than in China. The other stems from the fact that the perverse side-effects of market-oriented reforms (such as worsening income distribution and degradation of essential public services) have reached a more advanced and alarming stage in China than in Vietnam.
Keywords: Child Mortality, China, Vietnam, Socialist Market, Cross Country analysis
1. Introduction
The experience of the XXth century has shown that, due to the high and
ever-increasing degree of complexity and reciprocal integration of contemporary
economies, simplistic or over-centralized planning solutions to key coordination
problems are neither effective nor ultimately sustainable. A high degree of entrusting
to the market of the function of coordinating ordinary economic activities on the part
of the state is therefore inevitable. Yet, the existence of substantially different
economic and social market-based systems constitutes both a logical possibility and a
historical reality. These systems can in turn be seen as belonging to a conceptual
continuum ranging from quasi-pure free-market capitalism to new types of mixed
economies, which are commonly referred to as “market socialist”, and can be
compared according to various criteria, describing key structural economic and social
characteristics.
Some of the most relevant criteria are positive, as they identify structural
features of production relations - such as the relative weight of the State, the
ownership structure, and the social groups controlling and determining the joint
process of accumulation and technical progress. Other important criteria are
normative, and represent the degree of achievement of intermediate (e.g., GDP
growth) and final social and humanitarian goals, such as and the universal satisfaction
of basic needs and human development. Protection from hunger – i.e., avoidance of
malnutrition – is arguably the most essential one among basic needs, Its relevance
cannot be overstated: ”malnutrition remains the world’s most serious health problem
and the single biggest contributor to child mortality”(World Bank 2005, p.1). The
modern approach to nutrition has also showed that income-based poverty is but one
factor – albeit surely the most critical one – determining malnutrition, along with
others (related to the three dimensions of food security, namely availability of, access
to, and utilization of food on the part of each member of the household). Child
mortality, in turn, apart from malnutrition, is essentially determined by the sanitary
quality of the environment where children live, by the care they receive from their
parents, and by the health services to which they have access. Thus, besides the
depth and spread of poverty and hunger, it also reflects indirectly the health, social,
be seen as a proxy indicator of the level of satisfaction of basic needs and, more
broadly, of human development1 in developing countries.2
This paper focuses on child malnutrition in China and Vietnam.. China is the
largest and most advanced ”market socialist” country. Notwithstanding the
numerous and evident differences between the two countries, Vietnam has also been
following a broadly similar market socialist path, although it is presently in a less
advanced stage, and its growth record has not been as stellar as its northern neighbour.
Yet, Vietnam’s performance in reducing child mortality has been unambiguously
superior to China’s. Our thrust is to investigate in a comparative framework the
evolution of the economic and social factors affecting child mortality in China and
Vietnam, trying to shed light on this apparent paradox.
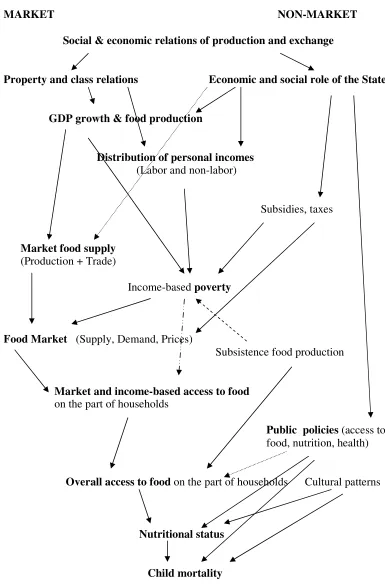
2 Economic and social determinants of child malnutrition and mortality
Each individual’s nutritional and health status is the outcome of a complex
process depending on a number of social, economic, and institutional factors. Social
and economic relations of production and exchange, of which the role of the state is a
key component, ultimately determine the speed and pattern of economic growth and,
through the mediation of trade, national food availability. They also shape income
distribution, and hence, along with cultural habits, each household’s income- based
access to marketed food supplies and basic services (marketed services comprise
privately supplied services and publicly-supplied services that can only be acceded
paying a fee3). Overall access to food, however, is also influenced, positively, or
negatively, by non-market factors (such as the weight of non-marketed,
self-consumed food production, the availability of transport infrastructure, or the existence
of food aid programs). Food utilization – the process through which access to food is
translated into nutritional status – is influenced by two sets of factors. The first one is
1 We refer to the concept of human development, as a complex and holistic one “based on the priority
of human well-being, and aimed at ensuring and enlarging human choices which lead to equality of opportunities for all people in society and empowerment of people so that they participate in - and benefit from - the development process” (source: UNDP 1996). UNDP’s Human Development Index is constructed as an unweighted average of other three indicators, measuring life expectancy, education, and income respectively. All of them are negatively correlated with child mortality.
2 At higher levels of human development, such those prevailing in high-income countries, it is
arguable that the relative weight of the prevalence of child mortality vis a vis other indicators is not as crucial.
3 Partial subsidization of basic services provision partially relaxes this budget constraint for
exogenous from the point of view of the household, and it depends mainly on the
availability of free or quasi-free health and sanitation infrastructure and services. The
second set is endogenous, and it is determined by each household’s human capital
endowment and by other cultural and behavioral factors4. In the case of children, in
particular, these factors exert a double impact on mortality, On one hand, indirectly,
this impact works – via food utilization - through the prevalence of malnutrition,
which is by itself a major cause of mortality. On the other hand, non food-related
exogenous and endogenous factors affect the children’s access to health and other
basic services and the maternal care they receive from other members of the
household (see Figure 1).
Markets, along with appropriate infrastructural, sectoral, and trade policies,
can contribute to fostering food production and, more broadly, economic growth. Yet,
they are of little help in other areas of crucial importance in determining children’s
nutrition and health (which are measured ex post by malnutrition and mortality rates).
The role of public intervention is paramount in influencing income distribution,
non-income access to food, access to health and other basic services, and even - in the long
run - gender relations and cultural habits.
3. Asian market socialism: strategic control of the surplus, fast growth, and
rapid decrease of poverty
In China and Vietnam, the direct and indirect control of the main means of
production on the part of public bodies determines social production relations
different from those typical of capitalist countries. This key feature is significant at
the macroeconomic and systemic levels5, and therefore justifies the use of the term
“socialism”- to be interpreted in a weak, structural and positive sense, and not one
directly related to the normative goals traditionally associated to socialism.
4 Household-level endogenous factors are not immutable, and can be modified by public intervention
in the long run.
5 Conversely, it is scarcely relevant in the domains that are subjectively important for most individuals.
In the market socialism framework, the state determines the rate of
accumulation to a degree that is significantly higher than in capitalism, as it can count
on more and more effective instruments to control the generation and allocation of
surplus and the speed and broad patterns of technical progress These fundamental
characteristics of market socialism have contributed to achieve an intermediate goal
of decisive importance, especially in poor countries: fast economic growth. Growth
is, in the long run, a necessary condition to reduce poverty. China and Vietnam ,
thanks to rapid GDP growth and to specific policy interventions that contributed to lift
the incomes of the rural majority,6 have achieved so far an impressive record in
poverty reduction. If they were considered jointly as a sort of “Asian market socialist
region” (with more than one fourth of the total population of the developing world), it
would be the only region to show significant progress in combating poverty.
Consistently, China and Vietnam account jointly for the bulk of (income- based)
poverty reduction worldwide since the 1980s7 (see Edward P., 2006, Chen and
Ravallion and 2004a,b; Li and Piachaud 2004; Lin 2003).
In the framework of market socialism, it might also be possible to extend the
public control of a large share of the surplus to the area of final consumption,
minimizing the superfluous consumption of privileged social groups, to earmark it to
various forms of public and social consumption. In fact,, this potentiality is not
presently realized. On the contrary, the perverse spiral towards an ever–worsening
income distribution pattern has largely gone out of hand, with severe consequences
also in terms of basic needs satisfaction, as is shown by the high inequalities in under–
5 mortality rate among households belonging to different income classes (see table
1.7.) . Moreover, essential public services have been largely abandoned to market
forces, so that access to them is based on income and wealth instead of being free and
universal.
6 Among them, agricultural de-collectivization (notwithstanding its multiple negative and uneven side
effects) , agricultural pricing policies, and targeted antipoverty programs. These interventions partly compensated the negative impact on poverty of deteriorating income distribution.
7
Chen and Ravallion (2004a), in a milestone study, showed that worldwide reduction in headcount poverty ( using the conservative 1$-a-day poverty line) was 390mn between 1981 and 2001. Out of them, only 30 million took place outside China (in netterms: poverty increased in some countries and decreased in other countries). According to Edwards 2006, these figures show that “the only really significant impact on poverty that occurred in the world was in China.”(p.1682). We agree, although observing that the sentence should be completed with the words “and Vietnam”, suggesting that such a large-scale poverty reduction was attributable to unique features of Asian market socialism, rather than of China alone.
The factors behind the increase in income inequality in China and Vietnam
(starting from a very low initial level) have been the object of numerous studies8. The
focus of the following section is on the underdevelopment of social services..9
4. Relative underdevelopment of social services under market socialism
Under the socialist centrally–planned economic regime, the Chinese and
Vietnamese states strived to provide social services free of charge to all the
population. As the resources available for that purpose were quite scarce, actual was
in fact extremely limited both in quantity and in quality. Nevertheless, basic social
services provision was very egalitarian and, on the whole, distinctively superior to
that of most countries with a similar level of economic development. As result, China
and Vietnam's human development indicators were also significantly better than other
poor countries with similar levels of economic development (see Ministry of Health
2005, Gabriele 2006)).
Since the inception of the market–oriented economic reform process,
provision of basic social services seriously deteriorated in both countries. Moreover,
they lost what was previously their most valuable feature –. their egalitarian nature –
that had allowed virtually free and universal access to the (modest indeed) services
made possible by the very low level of economic and technological development
prevailing at the time.
After recovering from an initial disruption caused by the transition to new
forms of financing, basic public services infrastructure has been further expanded and
strengthened. Yet, the amount of resources channeled to public services has been
8
See, among others, Ravallion 2005a,b;Perloff and Wu, 2005, 2004a,b; Chen and Ravallion 2004, 2001; Gustafsson and Shi,2002; Jalan. and Ravallion, 2001; Masina (ed.) 2002;; Swinkels and Turk 2003; Trin Duy Luam, 2003; Xuan Nam P., 2002; Brandt L. and Benjamin D., 2002. Chen and Ravallion 2004 is a particularly illuminating contribution on the key issue of evaluating the poverty-inequality trade off in China. The authors shows that Chinese provinces with a lower initial level of rural inequality achieved the best record in poverty reduction, due both to faster growth and higher growth elasticity of poverty reduction.
9Of course, the two negative social phenomena are mutually reinforcing. Taking into account the
insufficient. The overall inadequacy of social services policies in China and Vietnam
had an uneven impact in the various areas that affect nutrition, directly and indirectly.
The area of health was the most jeopardized. Since the beginning of economic
reforms, public health systems almost collapsed in the countryside, along with rural
communes, and deteriorated seriously even in urban areas (see Zhao 2006). By the
early 2000s, China’s and Vietnam’s share of expenditure on public health was
exceedingly low (see Table 1.5.)
To a lesser extent, the introduction of fees and the increased cost of books and
other education material also slowed (and , in some circumstances, reverted) the
progress towards universal access to primary education in rural areas10. These
mistakes in basic education policies (common to China and Vietnam) are likely to
have negatively affected nutrition as well, albeit indirectly, weakening the virtuous
impact of mothers’ basic education status on their ability to provide their children
with improved care, besides negatively affecting rural productivity growth.
On the bright side, China and Vietnam kept increasing the provision of basic
infrastructural services affecting nutrition and health status (such as sanitation
services and – less so – provision of drinkable water), and expanding immunization
and specifically nutritional programs(see Table 1.3.).11 Finally, there is another factor
– difficult to quantify – that induces to expect social services to perform better in
China and Vietnam than in most other countries at similar levels of economic
development. In both countries, the construction of the socialist state has implied a
sustained build–up of collective human, institutional and organizational capital, and
the extension of basic state and public structures to the most remote areas at village
and communal levels. Therefore, it is logical to assume the overall “cost
effectiveness” of social services in China and Vietnam to be rather high.
10 WB 2005 figures reported in Figure 1.8. appear to show a decrease in female primary education
completion rate in China.
11 Immunization is a basic preventive action directly affects children’s health status, and can therefore
5. Poverty, malnutrition and child mortality in China and Vietnam
The contradictory trends in the economic and social domains briefly sketched
in the preceding paragraphs jointly shaped the evolution of social and human
development indicators in China and Vietnam.
Rapid economic growth, the low level of initial inequality, and the expansion
of essential infrastructure, on one hand, were major positive factors. The progressive
worsening of income distribution and the deterioration of basic social services, on the
other hand, acted as brakes for social and human development. The balance was tilted
in a virtuous direction by the overwhelming weight of the two positive factors. Rapid
and broad–based12 economic growth and the low level of initial inequality13jointly
allowed for exceptional progress in reducing poverty in both countries (see Table
1.1.,1.6.,1.8. and, among others, Masina 2006, UN Country Vietnam Team 2003a,
2005).
The domain of nutrition was no exception. Thanks mainly to income–related
factors stemming from poverty reduction, major gains were recorded both in China
and in Vietnam. Yet, malnutrition is still a severe mass phenomenon, hitting hundreds
of millions in China and tens of millions in Vietnam, most of them poor farmers (see
Table 1.2.). For China, this was confirmed recently by the China Health and Nutrition
Survey (CHNS) national survey carried out by the Beijing– based Institute of
Nutrition and Food Safety.14. 29 percent of children younger than 5 and living in
poverty–stricken regions were malnourished. By contrast child malnutrition in urban
areas stood at only 1 percent. The prevalence of growth retardation and low body
weight in children has diminished, yet they still make 17.3% and 9.3% nationwide
and 29.3% and 14.4% in rural areas15 .
Overall food availability nationwide has ceased to be a problem, and the
quantity and quality of food supply has improved enormously. Notwithstanding
increasing income inequalities, all social groups have strengthened their energy and
protein intake, which is now basically satisfactory. Food insecurity – a condition
12 China and Vietnam exhibit a very good record in terms of growth of the agricultural sector and of
food production in particular (Table 1.1.).
13 The low level of initial inequality implied a high, though declining, growth elasticity of poverty
reduction.
measured by various indicators, that measures the risk of not having enough food –
improved, with 350 counties (most of them in rural areas of central and western
provinces) identified as “vulnerable” in the latest (2003) survey, against 450 in the
previous (2000) one (WFP/IFAD 2003).
However, numerous studies have shown that – due to the speed and
unevenness of economic, social, behavioral, and dietary patterns, and to the
inadequacies of nutrition policy programs16 – different social groups in China are now
experiencing various forms of malnutrition typical of both poor and rich countries,
such as inadequate vitamins and micronutrients intake, excessive consumption of fats,
and obesity (see Zhai et al. 2002; Mendez M.A. and Popkin B. M., 2004).
Vietnam is much poorer than China, and hence the dietary transition in
Vietnam is at a much earlier stage, notwithstanding the remarkable progress achieved
so far. The prevalence of underweight and stunted children has been halved over the
last two decades, but sheer undernourishment is still widespread in the countryside
and constitutes the core of a malnutrition problem that remains severe (see Table 1.2.,
1.8.). In the early 2000s, thanks mainly to the halving of poverty rates in little more
than a decade, malnutrition rates17 fell to around 30% (down from 50% in 1990), and
the share of households unable to meet minimum dietary energy consumption was
about 11% (30% in 1990). Undernutrition is particularly acute among ethnic
minorities and rural households in which women are less educated (see U.N. Country
Team Vietnam 2005; DFID 2006).
With respect to the progress achieved so far towards achieving the Millennium
Development Goals, China’s and Vietnam’s record is broadly positive vis a vis most
other developing countries. Focusing on under-five mortality, in particular, both
China’s and Vietnam’s record in 2003 was much better than the average for low and
middle income countries. However,it is striking to observe that China’s rate was much
higher than Vietnam’s. Moreover, China’s performance in reducing under-5 mortality
in 1990-2003 was better than that of most other developing countries, but worse than
the average for the East Asia and Pacific region. Conversely, Vietnam achieved an
extremely good result, having reduced this indicator by more than 50% over little
more than a decade. Also Cuba, which started from a very low base and experienced
16 This is not to say that no efforts have been carried out. Awareness on improper nutrition patterns and
interventions aimed at improving dietary patterns are on the rise in China, some of which are very effective (see Zhai et al 2002)
negative GDP growth during the 1990s, managed to reduce under-5 mortality much
faster than China (see table 1.9.).
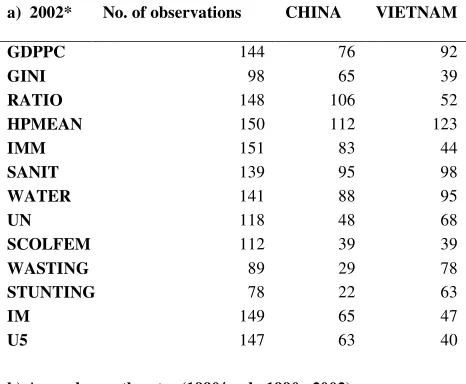
Table 2 presents China’s and Vietnam’s relative ranking among developing
countries, for a number of economic and social variables18. Part a reports rankings
in levels for 2002. In terms of GDP per capita, China’s ranking is intermediate, while
Vietnam is still very poor. The GINI score shows that the deterioration of income
distribution has gone much further in China (where it is by now more unequal than
most of other developing countries ) than in Vietnam. China and Vietnam score well
in terms of female primary schooling.. However, both countries perform very poorly
in terms of public health expenditure and are not particularly impressive (even taking
into account their modest level of economic development) in terms of water,
sanitation, and immunization19 The ratio of female/male expectancy (RATIO), an
indicator of women’s relative status, confirms that gender problems are much more
severe in China than in Vietnam. Scores in undernourishment20, stunting and wasting
show China performing quite well, and much better than Vietnam. Yet the opposite is
true in the case of infant and under–5 mortality,21 where Vietnam’s score is very good
(as usual, taking into account it is still a very poor country), while China’s is only
moderately better than average. Besides the role of the gender factor, the lackluster
record of China is likely to be due to the fact that some aspect of social
underdevelopment that have accompanied so far market–oriented reforms (such as
geographic and class inequalities, the decay of public health services, and even ,
probably, the lack of access to basic education on the part of poor peasant girls in
some rural areas) have been more dramatic and have been operating for a longer time
than in Vietnam. This interpretation is confirmed by part B of Table 2, which shows
rankings in terms of annual growth rates, over the 1990s and early 200s. China’s and
Vietnam’s performance in terms of per capita GDP growth are exceptionally good,
especially so in the case of China... Both countries did well in the expansion of
18 Source: World Bank 2005. For each variable, rankings refer to all low and middle income countries
for which data are reported.
19 In the area of immunization, Vietnam’s score is rather good, while China’s one is poor. 20 Prevalence of undernourishment is a measure of basic access to food estimated by FAO, with a
particular methodology that renders it difficult to compare it on one hand with macroeconomic income and distribution variables, and, on the other hand, with anthropometric malnutrition indicators. We did not use it in our econometric analysis as we focused on the social and economic factors determining income-based market access to food.
21 The most recent (2004) data on under-5 mortality in China, reported by UNICEF 2006 and
sanitation facilities, less so with respect to the access to clean water (especially in the
case of Vietnam)22. Yet, Vietnam clearly outperformed China both in terms of
expansion of immunization and female education23, and in terms of gains in the areas
of undernourishment, infant and under–5 mortality. Actually, Vietnam’s record in
reducing child mortality is among the best in the world, while China’s is just about
average.
6. Data and methodology
According to the conceptual framework sketched in section 2, we attempted to
explore quantitatively the main social and economic factors determining child
mortality, and to discuss China’s and Vietnam’s record in a comparative perspective.
Our basic model is a cross–country one, including all developing (i.e., low and
middle income) countries for which essential data are available. Our core database is
constituted by the World Bank World Development Indicators 2005(WB 2005).24 It is
estimated by OLS, with a few adaptations and specifications aimed at capturing
specific features of the causal chain leading to child mortality in developing countries.
The model comes in two basic forms: in levels and in growth rates. The form in levels
was estimated for the years 2002/200325.. Its results can be interpreted both as static
ones (what are the factors determining malnutrition at the present time) and as the
product of a very long historical process, which led over time to a different evolution
22 The interpretation of the rankings for the annual growth of rate of sanitation, water and immunization
must take into account that some countries show zero or negligible growth simply because they already reached total or quasi-total coverage.
23 Data on primary female primary school completion in Vietnam in 1990 are not available in WB
2005. However, data on another indicator of female education, the gross enrolment ratio of girls in secondary school, show a much faster improvement in Vietnam than in China.
24 Data on Cuba’s GDP growth are from CEPAL 2003.
25 Few mutually comparable data are available for a sufficient number of developing countries for
more recent years. For some variables, we used the latest available figure in WB 2005, or – when reported by the same source - an average for the early 2000s. they were From a substantive point of view, moreover, to calibrate the analysis on 2002 has an additional advantage. Since the 16th congress
of various malnutrition–affecting factors, and thus to different outcomes in terms of
malnutrition and child mortality in different countries. The form in growth rates
attempts to single out a few basic factors common to all countries, explaining trends
in child mortality over the 1990s and early 2000s (seen both as a proxy for children
malnutrition and as its more severe consequence).
Our dependent variables is the prevalence of under-five child mortality With respect
to the explanatory variables, we introduced them in two stages, according to the
interpretative framework proposed in Section 2. First, we introduced per capita GDP,
and thereafter a few other variables, which represent the main factors different from
economic growth which affect child mortality in developing countries. They are: the
Gini coefficient (an indicator of income distribution); one or more variables, some of
which constructive in an additive fashion, indicating the level of development of basic
public services (including women’s education); and the ratio of female to male life
expectancy,
7. Results
We first ran tentative regressions with linear specifications, starting with
models in levels, that shed light on the main factors causing malnutrition and children
mortality in the early 2000s. The first series had stunting as dependent variable,
starting with a very simple model that only includes the 2002 GDP per capita
(GDPPC) and the (latest available) Gini coefficient (GINI) (Table 3, part a, model
3.1.). Both were highly significant and exhibited the expected sign, and jointly
explained about 40% of inter–country variability in the prevalence of stunting. The
coefficient of GINI was quite high (0.33), indicating that income inequality is a
powerful cause of hunger: this is a first finding of general relevance, that was
confirmed invariably also by all the other models.
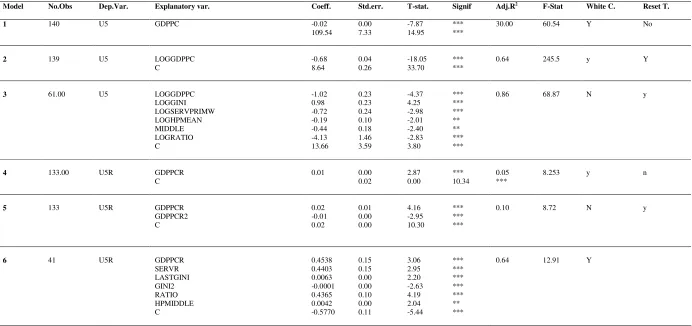
Models 1 and 2 in levels have GDP per capita in 2002 (GDPPC) as the only
explanatory variable, and under-five child mortality (U5) as the dependent variable26:
(1) U5 = + GDPPC +
(2) logU5 = + (logGDPPC) +
Model 2 fits much better than model 1, showing that the relationship between
economic development and child mortality is not a linear one27. Graph 1 illustrates the
logarithmic relation between the two variables. At low levels of development, very
poor countries exhibit quite different levels of child mortality, while at higher levels
the opposite is true, with middle- and higher-income countries sharing similar levels
of child mortality.
In model 3, we added four other explanatory variables in logs, plus a dummy.
The first additional explanatory variable, LOGGIN, is the log of the Gini coefficient,
indicator of income distribution, (the log of the Gini coefficient);28 The second,
LOGSERV,is an indicator of the country’s propensity to invest in the development of
basic services. It is an additive variable, constructed as the sum of four indicators, all
divided by the level of GDPPC29 : the child immunization rate against measles30,
access to an improved water source31, access to improved sanitary facilities32, and the
female primary school completion rate33. LOGHPMEAN is the log of the share of
public health expenditure in GDP.34. LOGRATIO35 is the log of the ratio between
female and male life expectancy36. MIDDLE is a dummy with value 1 for middle
income countries and 0 for all other (low-income) countries. The model is thus:
(3) log U5 = (LOGGDPPC) + (LOGGINI) + (LOGSERV) + (LOGHPMEAN)
+ (LOGRATIO) + (MIDDLE) +
All variables are significant either at the 1% or the 5% level, and the
R-squared increases noticeably with respect to model 2, reaching 0.86 and thereby
27 Model 1 does not pass the RESET test, suggesting the existence of non-linearities in the relationship
between per capita income and child mortality. Non-linearities have also been found in the relationship between income per capita and other hunger and deprivation indicators (see, for instance, IFPRI 2006).
28 Latest available figure
29 This procedure allows to depurate the social indicators from the influence of economic development
per se, so that they reveal ex post their respective governments’ willingness and capability to invest in this area.
30 Percentage for children ages 12-23 months. 31 Share of population.
32 Share of population
33 Percentage of relevant age group, average of available data for the period 1988-2004. For this
indicator, the average was preferred to the latest indicator as primary education affects mother’s child care abilities only after a certain time lag.
34 It is also an indicator of each national government’s policy stance in a key services area, and is
therefore conceptually similar to the previous variable,
suggesting that most of the inter-country variation was captured by this specification.
These results show that child mortality is negatively correlated with economic
development, national governments’ propensity to invest in basic services (including
female education37), and the status of women, while it is positively correlated with
income inequality38. Moreover (consistently with model 2 and Graph 1), even after
taking into account these factors, child mortality is particularly high in low-income
countries.
Models in growth rates attempt at capturing the main determinants of progress
in reducing child mortality over the 1990s and early 2000s. The dependent variable is
the rate of reduction of under-five child mortality over the 1990-2002 period (U5R)
In model 4, the only explanatory variable is the growth rate of GDP over the
same period (GDPPCR):
(4) U5R = + (GDPPCR) +
However, this specification explains very little and does not pass the RESET stability
test, suggesting that the relationship between GDP growth and child mortality
reduction is not linear. Such a non-linearity is confirmed by model 5:
(5) U5R = + (GDPPCR) + (GDPPCR2) +
where GDPPCR2 is the square of GDPPCR.. This quadratic polynomial
relationship between GDPVR and U5R is represented in Graph 2. The function is
strongly concave (CHECK), but is also heavily influenced by two outliers,
Equatorial Guinea and China. Excluding from the sample Equatorial Guinea ( a
scarcely representative country with less than 1 million inhabitants, where GDP
growth was exclusively determined by the recent discovery of oil), the function is still
concave (Graph 3). However, if also China is excluded,, the function becomes convex
(Graph 4). These results show that in China the elasticity of child mortality reduction
37 Trial regressions (not reported) run with each services variable taken individually showed that
female primary school completion was the most significant one, followed by the immunization rate.
38 The coefficients of LOGGDPPC and LOGGINI, in particular, which can be interpreted as
with respect to GDP growth tended to decrease markedly with growth acceleration,
while this was not the case for most other countries (including Vietnam39).
Model 6 is a more comprehensive one, which is structured in a fashion similar
to model 3 in levels. SERPRIMWR is an additive variable constructed as the
(unweighted) average of growth rates in the immunization, water, sanitary, and female
primary completion rate original variables over 1990-1992, minus the growth rate of
GDPPC. It is thus an indicator of the evolution of each country’s propensity to invest
in basic services. For the other variables, it was not possible to construct such a
dynamic indicator, and therefore they are included in levels form, as in the previous
models. This amounts to assume that income inequality, public health expenditure,
and the status of women have also an impact on the evolution of child mortality,
even if they do not change over a given period of time. The best fitting specification
resulted to be one where the health policy variable is represented by HPMIDDLE
(the product of HPMEAN by the MIDDLE )40, and the square of the Gini coefficient
(GINI2) was also included.
(6) U5R = (GDPPCR) + (SERVR) + (GINI) + (GINI2 ) +
(HPMIDDLE) + (RATIO) +
In model 6, R-squared improves dramatically with respect to models 4 and 5,
showing that the regression explains about 2/3 of inter-country variability in child
mortality reduction. The additive services variables is highly significant, and its
coefficient is similar to that of GDP growth. The negative impact of income
distribution is non-linear, and becomes relevant only when the Gini coefficient
reaches the mid-30s (Graph 5). The public health variable is significant only in
middle income countries.41 The latter two findings have a particular bearing on
China, a country that during the 1990s became a middle income one thanks to its
exceptional growth performance, and where in the same period the Gini coefficient
increased progressively and entered the critical zone identified in graph 6. They also
39 In Graph 4, Vietnam is represented by the last point on the right (the fastest-growing country after
equatorial guinea and China), which lies practically on the curve.
40 In a trial regression, the variable HPMEAN turned out as not significant.
41
contribute to explain why Vietnam, which followed a similar development path,
performed much better than China in reducing child mortality.
8. Conclusions
The results of our econometric analysis confirmed that child mortality is caused
chiefly by two classes of economic and social factors. The first one is constituted by
(personal) income-based factors affecting households’ ability to purchase food and
basic services on the market, which depend essentially on the level and distribution of
purchasing power. They are synthetically represented by two indicators, GDP per
capita and the Gini coefficient. Both of them were showed to be significant both in
static terms (as determinants of the present level of child mortality in each developing
country) and in dynamic terms (as determinants of the evolution of the dependent
variables since 1990). The impact of income inequality on child mortality reduction,
however, was relevant only for countries with a Gini coefficient in the mid-30s or
higher. The second class is constituted by non–income factors related to the
availability and access to basic health, sanitary, and education services, and to
women’s relative status. All of them are amenable to state intervention, albeit to very
different extents and with different time lags, and implying different degrees of
freedom on the part of national governments. In a medium–term time horizon,
governments , can be assumed to enjoy a relatively ample degree of policy discretion
to earmark higher shares of GDP to public health expenditure, immunization services
and water and sanitation facilities. In the long run, governments can also promote
primary education for girls and implement policy initiatives aimed at improving the
status of women.
Our analysis has demonstrated the relevance of non–income factors, some of which
represented as governments’ propensities to invest in basic services, as important
(static and dynamic) determinants of child mortality. It also showed that public health
expenditure becomes key beyond a certain threshold of income. The latest findings
show that non–income factors, and especially public expenditure on health and other
key basic services, become even more crucial determinants of child nutrition and
mortality in countries at an intermediate levels of economic development – and thus,
How did China and Vietnam fare ? Their overall results so far are good, yet less so
than what could have been achieved with an optimum policy mix. Thanks to the
structural characteristics of their market socialist economies, they embarked on an
exceptionally rapid path of economic growth. Income distribution deteriorated
steadily, but as it started from a very egalitarian level the impact of growth on the
incomes of the people was broad–based, albeit progressively less so. As a result,
absolute poverty shrank dramatically and both China and Vietnam made enormous
steps forward in improving people’s access to food, and therefore in combating
income– and food–based factors affecting child malnutrition and mortality. However,
as China’s income distribution has worsened so far much more than in Vietnam, the
negative impact of income inequalities on child mortality reduction was much worse
in China than in Vietnam.
China’s and Vietnam’s performance in terms of tackling non–income factors was
more mixed. Immunization and sanitary infrastructure expanded – a progress made
possible by economic growth, but also by the maintenance of a satisfactory degree of
priority for these types of social expenditure. Non (econometrically) quantifiable
scattered evidence on the expansion and effectiveness of targeted nutrition and
sanitary programs is also positive, suggesting that virtuous policy and institutional
forces (partly identifiable with legacies from the pre–reform period) are still at work
in China and Vietnam, helping the overall progress in combating child malnutrition
and mortality. Conversely, China’s and Vietnam’s performance was very bad in the
area of public health policies.
In sum, China and Vietnam experienced an extraordinary economic development, yet
a relative underdevelopment in the social area (due to the deterioration of income
distribution and the inadequate provision of basic public social services). These
contradictory trends were reflected in their path of progress towards reducing child
mortality. Vietnam’s performance was very good, in spite of having still relatively
high rates of undernourishment. China fared very well in reducing undernourishment,
less so in decreasing child mortality – in spite of its exceptional rate of economic
growth. This divergence is to be attributed mainly to two factors. First, gender
discrimination is a serious problem in rural China, but not in rural Vietnam. Second,
the perverse social effects of ill–conceived market–oriented reforms have gone much
Taking also into account the size of their populations, it is fair to acknowledge that the
scale of the progress already realized in China and Vietnam in combating child
hunger and deprivation is historically unprecedented.. Yet – as our analysis has
showed – the level already achieved by the Gini coefficient, the continuing trend
towards a further deterioration of income distribution, and the underfunding of public
health (an area of increasing centrality for countries at an intermediate level of
development) are persistent and increasingly worrying negative factors42. If
unchallenged, they would inevitably imply that future economic growth will deliver
progressively diminishing returns in terms of reducing child malnutrition and
mortality. The urgency of fighting social underdevelopment is strengthened by the
mounting evidence on the multiple virtuous synergies linking nutrition, health, and
economic growth, showing that trade–offs between social and economic development
are much smaller than what could be assumed still 10–15 years ago43. To tackle the
severe contradictions of their presently-existing market socialist systems, both China
and Vietnam would require profound policy changes aimed at combating inequalities
and prioritizing public social expenditure.
42 See Zhao 2006.
43 In China, taking into account the structural imbalances leading to an excessive accumulation of
TABLES
Table 1.
China's and Vietnam's basic economic and social indicators in a comparative perspective
1.1. Growth of GDP, agriculture and food production
Vietnam China Cuba* Middle Income
East Asia & pacific
World Low Income GDP 80-90 4.6 10.3 na 2.8 7.9 3.3 4.4
GDP 90-03 7.5 9.6 -1 3.5 7.6 2.8 4.7
AGR 80-90 2.8 5.9 na 3.6 4.9 2.7 2.8
AGR 90-03 4.2 3.5 na 2.2 3.1 1.9 3
Food production
67 68 na 83 77 84 82
(index 1999-2001=100)
115 110 na 110 111 105 103
* The figure for GDP growth is from CEPAL and refers to 1990-2002. WB 2005 reports for 1990-2003 a figure of 3.9: it is obviously incorrect and therefore it was not utilized. WB 2005 also reports data on Cuba's agricultural and food production growth but we did not consider them to be sufficiently trustworthy.
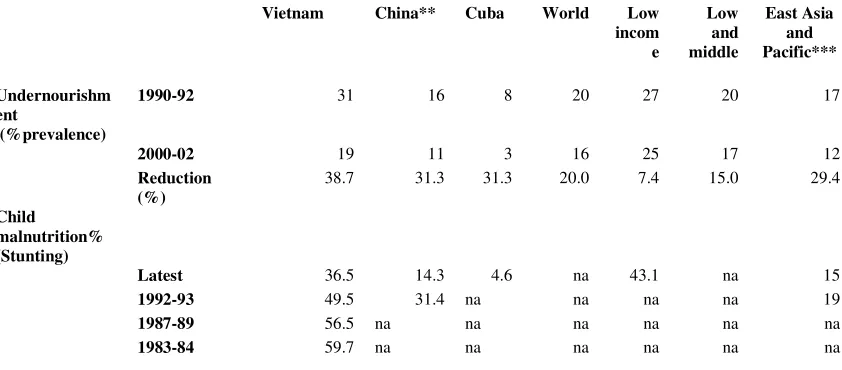
1.2. Nutrition
Vietnam China** Cuba World Low incom e Low and middle East Asia and Pacific*** Undernourishm ent (%prevalence)
1990-92 31 16 8 20 27 20 17
2000-02 19 11 3 16 25 17 12
Reduction (%)
38.7 31.3 31.3 20.0 7.4 15.0 29.4
Child
malnutrition% (Stunting)
Latest 36.5 14.3 4.6 na 43.1 na 15
1992-93 49.5 31.4 na na na na 19
1987-89 56.5 na na na na na na
1983-84 59.7 na na na na na na
* For Vietnam, the latest figure for stunting refers to the 2003 survey
** For China, the latest figure for stunting refers to the 2002 survey, and the one for 1992-93 to the 1992 survey.
1.3. Disease prevention
Vietnam China Cuba World Low income
Low&middle
Access to an improved 90 66** 70 na 75 64 72
water source (% of population)*
2002 79*** 77 91 82 75 79
Increase(%) 19.7 10.0 na 9.3 17.2 9.7
Access to improved 1990 22 23 98 43 20 50
sanitation facilities 2002 41 44 98 54 36 76
86.4 91.3 0.0 25.6 80.0 52.0
Child immunization rate Measles 93 84 99 77 65 76
DPT 99 90 71 78 67 77
Consumption iodized salt Latest 83 93 83 67 53 17
Vitamin A Supplementation 2002 55 na na na na 56
*Data on access to an improved water source are only tentatively comparable among different countries ** 1992-93
*** 2000
1.4. Educational, behavioral and gender variables
Vietnam China Cuba World Low income
Low and middle
Exclusive breastfeed 15 67 41 na na na
Primary completion rate females
1988/89 -1993/94
na 99 93 na 57 88
2000/01 -2003/4
95 95 94 na 66 94
Youth literacy rate 1990 female 94 93 99 87 73 87
good male 94 97 99 79 55 78
1.000 0.959 1.000 1.101 1.327 1.115
Adult literacy rate 1990 female 87 69 95 63 38 73
male 94 87 95 74 60 62
0.926 0.793 1.000 0.851 0.633 1.177
Life expectancy at birth 2003
female 72 73 79 69 59 66
Male 68 69 75 65 57 63
1.5. Health expenditure
Vietnam China Cuba World Low income Low&middle Total % GDP 2002 5.2 5.8 7.5 10 5.5 6
Public % GDP 1.5 2 6.5 5.8 1.5 3
% of total 29.2 33.7 86.5 60 27.8 49.4
Out of pocket % of private 87.6 96.3 75.2
1.6. Poverty
Vietnam China World
% below 1$ line 1981 70* 63.8 40.4
2001 24.1 16.6 21.1
% below 2 $ line 1981 na 88.1 66.7
2001 na 46.7 22.9
Population below 1998 37.4 4.6
national poverty line %** 2003-4 19.5 3.1
* Source: World Bank, quoted in http://perso.wanadoo.fr/patrick.guenin/cantho/vnnews/poverty1.htm ** Source: Wikipedia
(http://en.wikipedia.org/wiki/List_of_countries_by_percentage_of_population_living_in_poverty)
1.7 Under 5 mortality rate by quintile and Gini index Vietnam China
Under 5 mortality rate
Poorest quintile 63
Richest quintile 23
Gini (latest) 37 44.7
1.8 Eradicate extreme poverty and hunger
Vietnam China Cuba East Asia&Pacific
Eradicate extreme poverty and hunger 7.5 4.7 na
Share poorest quintile % 45 17 na 19
Underweight % children under 5 34 10 4 14.7
1.9 Millennium Development Goals
Vietnam China Cuba World Low income
Low and middle
East AsiaPacific
Achieve universal primary education
1988/89-1993/94
na 105 94 65 81 97
Primary completion rate
2000/1-2003/4
95 98 94 71 84 97
Promote gender equality
Ratio male/female enrolment ratio1
1990-91 na 87 106 74 84 89
2003-4 93 97 97 84 91 97
Reduce child mortality*
Under 5 mortality rate/1000
1990 53 49 13 95 149 103 59
2003 23 37 8 86 123 87 41
Reduction (%) 56.6 24.5 38.5 9.5 17.4 15.5 30.5
Improve maternal health
Maternal mortality ratio/100000
2000 130 56 33 407 689 444 116
Birth attended by skilled heath staff
2000-03 85 97 100 na na na 91
Table 2 – Ranking of economic and social indicators: China and Vietnam vis a vis other developing countries
a) 2002* No. of observations CHINA VIETNAM
GDPPC 144 76 92
GINI 98 65 39
RATIO 148 106 52
HPMEAN 150 112 123
IMM 151 83 44
SANIT 139 95 98
WATER 141 88 95
UN 118 48 68
SCOLFEM 112 39 39
WASTING 89 29 78
STUNTING 78 22 63
IM 149 65 47
U5 147 63 40
b) Annual growth rates (1990/early 1990s-2002)
No. of observations CHINA VIETNAM
GDPPCR 137 2 3
IMMR 126 109 49
SANITR WATR 95 78 10 40 11 69
UNR 91 31 14
IMR 148 82 15
U5R 146 77 11
* Or latest available figure in WB 2005
Legend
GDPPC GDP per capita GINI Gini coefficient
RATIO Female to male life expectancy ratio
IMM Child immunization rate (measles, % of children 12-23 months) WATER Access to an improved water source, % of population
SANIT Access to improved sanitation facilities SCOLFEM Primary completion rate, females
UN Prevalence of undernourishment (% of total population) WASTING Prevalence of wasting (%of children under 5)
STUNTING Prevalence of stunting (%of children under 5) IM Infant mortality rate
25
Table 3 – Models’ results
Model No.Obs Dep.Var. Explanatory var. Coeff. Std.err. T-stat. Signif Adj.R2 F-Stat White C. Reset T.
1 140 U5 GDPPC -0.02 0.00 -7.87 *** 30.00 60.54 Y No
109.54 7.33 14.95 ***
2 139 U5 LOGGDPPC -0.68 0.04 -18.05 *** 0.64 245.5 y Y
C 8.64 0.26 33.70 ***
3 61.00 U5 LOGGDPPC -1.02 0.23 -4.37 *** 0.86 68.87 N y
LOGGINI 0.98 0.23 4.25 ***
LOGSERVPRIMW -0.72 0.24 -2.98 ***
LOGHPMEAN -0.19 0.10 -2.01 **
MIDDLE -0.44 0.18 -2.40 **
LOGRATIO -4.13 1.46 -2.83 ***
C 13.66 3.59 3.80 ***
4 133.00 U5R GDPPCR 0.01 0.00 2.87 *** 0.05 8.253 y n
C 0.02 0.00 10.34 ***
5 133 U5R GDPPCR 0.02 0.01 4.16 *** 0.10 8.72 N y
GDPPCR2 -0.01 0.00 -2.95 ***
C 0.02 0.00 10.30 ***
6 41 U5R GDPPCR 0.4538 0.15 3.06 *** 0.64 12.91 Y
SERVR 0.4403 0.15 2.95 ***
LASTGINI 0.0063 0.00 2.20 ***
GINI2 -0.0001 0.00 -2.63 ***
RATIO 0.4365 0.10 4.19 ***
HPMIDDLE 0.0042 0.00 2.04 **
C -0.5770 0.11 -5.44 ***
FIGURES and GRAPHS
Figure 1
MARKET NON-MARKET
Social & economic relations of production and exchange
Property and class relations Economic and social role of the State
GDP growth & food production
Distribution of personal incomes
(Labor and non-labor)
Subsidies, taxes
Market food supply
(Production + Trade)
Income-based poverty
Food Market (Supply, Demand, Prices)
Subsistence food production
Market and income-based access to food
on the part of households
Public policies (access to food, nutrition, health)
Overall access to food on the part of households Cultural patterns
Nutritional status
Graph 1 U5 and GDPPC (all countries)
Graph 2 – U5 RATE and GDPPCR (all countries)
-.08 -.06 -.04 -.02 .00 .02 .04 .06
-1 0 1 2 3 4
GDPPCR
U
5
R
A
T
E
U5RATE vs. Polynomial (degree=2) of GDPPCR 0
50 100 150 200 250 300
0 2000 4000 6000 8000 10000
GDPPC
U
5
Graph 3 – U5 RATE and GDPPCR (Equatorial Guinea excluded)
Graph 4 - U5 RATE and GDPPCR (Equatorial Guinea and China excluded)
-.08 -.06 -.04 -.02 .00 .02 .04 .06
-0.8 -0.4 0.0 0.4 0.8 1.2
GDPPCR
U
5
R
A
T
E
U5RATE vs. Polynomial (degree=2) of GDPPCR -.08
-.06 -.04 -.02 .00 .02 .04 .06
-1.0 -0.5 0.0 0.5 1.0 1.5 2.0
GDPPCR
U
5
R
A
T
E
Graph 5 U5RATE and LASTGINI (all countries)
-.08 -.06 -.04 -.02 .00 .02 .04 .06
20 30 40 50 60 70 80
LASTGINI
U
5
R
A
T
E
References
1. Alderman H., Behrman J., “Reducing the Incidence of Low Birth Weight in Low–Income Countries Has Substantial Economic Benefits” World Bank Research Observer 21(1): 25–48, Spring, 2006.
2. Alderman H., Behrman J., and Hoddinott J., “Nutrition, Malnutrition, and Economic Growth”, in G. Lopez–Casasnovas, B. Rivera, and L. Currais, eds., Health and Economic Growth: Findings and Policy Implications. MIT Press, 2005.
3. Benjamin D., Brandt L., Giles J., “The Evolution of Income Inequality in Rural China”, William Davidson Institute Working Papers Series with number 2004–654, 2004.
4. Blanchard O.J. and Giavazzzi F., 2005, Rebalancing Growth in China: A Three-Handed Approach, MIT Department of Economics Working Paper No. 05-32
5. Brandt L. and Benjamin D., “Agriculture and Income Distribution in Rural Vietnam under Economic Reforms: A Tale of Two Regions”, No 519, William Davidson Institute Working Papers Series from William Davidson Institute at the University of Michigan Stephen M. Ross Business School, 2002.
6. Chen S. and Ravallion M.2004a, How Have the World’s Poorest Fared Since
the Early 1980s, Review of Income and Wealth, 47(3),
7. Chen S. and Ravallion M., 2004b, “China's (uneven) progress against poverty” Policy Research Working Paper WPS3408 World Bank, 2004b.
8. S Chen, M Ravallion - How did the world’s poor fare in the 1990s? - Review
of Income and Wealth, 2001
9. CEPAL, Estudio Economico de America Latina y del Caribe, Santiago del Chile, 2003.
10.CPC 2006, Communique of the Sixth Plenum of the 16th CPC Central Committee, www.chinaview.cn 2006-10-11 20:51:22
11.DFID, “Country Profile: Vietnam, updated on 25 January 2006”, 2006.
12.Dickey V. C., , Pachon H, .Marsh D., Tran Thi Lang, . Claussenius D., Dearden K.A., Tran Thu Ha, and G.Schroeder D., “Implementation of nutrition education and rehabilitation programs (NERPs) in Vietnam”, Food and Nutrition Bulletin – Volume 23, Number 4, December 2002.
13.Dung VTM Tuan T., Thach TD, Ninh NX, Boy E, J Cervinskas E, “Cost– effectiveness of an iron supplementation program for women and children in a rural district of Vietnam”, Poster presentation Th 33, 2003 INACG Symposium, Marrakech, Morocco, 6 Feb 2003.
14.Edward P., 2006, Examining Inequality: Who Really Benefits from global growth, World Development vol. 34, n.10
15.Gabriele A., “Social services policies in a developing market economy oriented towards socialism: the case of health system reforms in Vietnam” Review of International Political Economy, Vol. 13, No.2, May 2006.
16.Garenne M. and Gakusi A.E., 2006, Vulnerability and Resilience:
17.Gustafsson, B. and Shi, Li, 2002, “Income inequality within and across counties in rural China 1988 and 1995” Journal of Development Economics, Elsevier, vol. 69(1), pages 179–204.
18.Hammer L., Lensinsk R., and White H., 2003, Infant and Child Mortality in Developing Countries: Analyzing the Data for Robust Determinants,, Journal of Development Studies, Vol. 40, No.1.
19.Himmelstein D.U., “Response to the Criticism by Henry Aaron on the NEJM
Article on Administrative Waste in US Healthcare” JAMA, August 13, 2003.
20.IFPRI 2006, Global Hunger Index – A Basis for Cross-Country Comparisons
(prepared by D. Wiesman), Washington D.C., October, available in http://www.ifpri.org/media/20061013GHI.asp
21.Jalan, J. and Ravallion, 2001, M., “Household income dynamics in rural China” Volume 1 Policy Research Working Paper WPS 2706.
22.Li B. and Piachaud D., 2004, Poverty and Inequality and social policy in China CASE paper 87 LSE London.
23.Lin B.Q. 2003, Economic growth, income inequality, and poverty reduction in People’s Republic of China, Asian Development Review 20(2)
24.Masina P., 2006, “Vietnam’s Development Strategies”, Routledge
Contemporary South East Asia Series, 2006.
25.Masina P. (ed.), “Rethinking Development in East Asia – From Illusory Miracle to Economic Crisis” Nordic Institute of Asian Studies, Curzon press, Richmond, Surrey, pp.326. 2002.
26.Mendez M.A. and Popkin B. M., “Globalization, Urbanization and Nutritional
Change in the Developing” World Journal of Agricultural and Development Economics (e–JADE, www.fao.org/es/esa/eJADE),Vol. 1, No. 2, 2004, pp. 220–241. 2004.
27.Ministry of Health, 2005, “Report on China's Health Care System and Reform”, August
28.Pachon H., Schroeder, D. G., Marsh D., Dearden K.A., Tran Thu Ha, and Tran
Thi Lang, “Effect of an integrated child nutrition intervention on the complementary food intake of young children in rural North Vietnam”, Food and Nutrition Bulletin – Volume 23, Number 4, December 2002
29.Perloff J. and Wu Ximing Wu, “China's Income Distribution and Inequality,”
Econometric Society 2004 North American Summer Meetings 316, Econometric Society, 2004a.
30.Ravallion M., “Inequality is bad for the poor” Policy Research Working Paper , World Bank WPS3677, 2005a
31.Ravallion M., “A poverty–inequality trade–off” Policy Research Working Paper , World Bank WPS3579, 2005b.
32.Schuftan C. and Le Dinh Cong 2001 The successful fight against malaria in Vietnam. In: Mekong Malaria forum quarterly bulletin of the regional malaria program in Cambodia Laos and Vietnam issue no. 8 December 2001
33.Smith C. and Haddad L., 2000, Explaining Child Malnutrition in Developing
Countries: A Cross-Country Analysis, research report, IFPRI.
35.Swinkels R. and Turk C., 2003, Strategic Planning for Poverty Reduction in Vietnam – Progress and Challenges for Meeting the Localized Millennium Development Goals, World Bank BPRWP No.2961
36.Trin Duy Luam, 2003, Current Social Stratification and Social Equity in Vietnam, Vietnam Social Sciences 1(93)
37.Tuan T. , Dung VTM, Thach TD, NX Ninh TD, Thang HV, Khan NC ,Boy E,
Cervinskas J, 2003, Cost–effectiveness of delivering low dose Vitamin A integrated with other community health activities in Vietnam,, Oral presentation T61, XXI IVACG meeting, Marrakeck, Morocco, 3–5 Feb 2003, in http://www.hsph.edu.vn/en/Research/research1.htm
38.UNICEF 2006, Progress for Children – A Report Card on Nutrition, No.4, May
39.U.N. System Standing Committee on Nutrition 2005 (UNSSCN 2005),
Integrating Food and Nutrition Interventions in National Development Plans in Order to Accelerate the Achievement of the MDGs in the Context of Realizing the Human Right to Adequate Food: A Synthesis of Findings and Recommendations (by Roger Shrimpton, Uwe Kracht, Elisabetta Recine, Flavio Valente), presented to the Symposium “Realizing the Right to Adequate Food to help achieve the Millennium Development Goals, 32nd Annual Session, Brasilia, 14 to 18 March 2005
40.U.N. Country Team Vietnam 2005, MDGs and Vietnam’s Socio–Economic
Development Plan 2006–2010
41.U.N. Country Team Vietnam 2003a MDGs Closing the Millennium Gaps 2003
42.U.N. Country Team Vietnam, 2003b, Health care Financing for Vietnam, Discussion Paper No.2, June
43.UNDP, 1996, http://www.undp.org/rbec/nhdr/1996/georgia/glossary.htm
44.WFP (World Food Programme) 2006. World Hunger Series 2006: Hunger and
Learning. Palo Alto, CA, Stanford University Press.
45.WFP/IFAD 2003, China VAM Unit 2003 Vulnerability analysis of Chinese counties, June
46.World Bank 2005, Repositioning Nutrition as Central to Development – A Strategy for Large –Scale Action
47.World Bank 1993, World Development Report, Investing in Health.
48.World Bank 2006 , Country Experiences in Nutrition Programming – China
49.Ximing Wu, and Jeffrey M. Perloff, "China's Income Distribution, 1985-2001," Review of Economics and Statistics; February 2005
50.Xuan Nam P., 2002, Some preliminary ideas on the change of social structure and classes in Vietnam during the transition to a socialist–oriented market economy, Vietnam Social Sciences 6, pp.31–42
51.Wu, Ximing and Perloff, Jeffrey M., "China's Income Distribution Over Time: Reasons for Rising Inequality" (2004b).
52.Zhai, Fengying, Fu, Dawei, Du, Shufa, Ge, Keyou, Chen, Chunming, & Popkin, Barry M. (2002).