http://dx.doi.org/10.4236/oje.2014.45025
How to cite this paper: Chomba, C., Simpamba, T., Kampamba, G. and Nyirenda, V. (2014) Does the Luangwa Hippo Popu-lation Size and Density Distribution Vary between Upper and Lower Study Blocks? What Are the Management Implications of Such Distribution Pattern? Open Journal of Ecology, 4, 262-280. http://dx.doi.org/10.4236/oje.2014.45025
Does the Luangwa Hippo Population Size
and Density Distribution Vary between
Upper and Lower Study Blocks? What Are
the Management Implications of Such
Distribution Pattern?
Chansa Chomba
1*, Twakundine Simpamba
2, George Kampamba
3, Vincent Nyirenda
2 1School of Agriculture and Natural Resources, Disaster Management Training Centre, Mulungushi University,Kabwe, Zambia
2Zambia Wildlife Authority, Department of Research, Chilanga, Zambia 3Copperbelt University, Kitwe, Zambia
Email: *[email protected], *[email protected], *[email protected]
Received 6 February 2014; revised 6 March 2014; accepted 15 March 2014
Copyright © 2014 by authors and Scientific Research Publishing Inc.
This work is licensed under the Creative Commons Attribution International License (CC BY).
http://creativecommons.org/licenses/by/4.0/
Abstract
The pattern of population distribution of the common hippopotamus was examined along the 165 km stretch of the Luangwa River in eastern Zambia. The study area was divided between the up- per (A - D) and lower (E - H) study blocks. Population data are collected between 1976 - 2008 and this study 2009-2012 showed a significant difference in the pattern of density distribution be-tween upper and lower study blocks. Upper blocks had higher density of 41/km than lower blocks 29/km. Length of study blocks was discounted as density was used to determine distribution pat- tern. Results obtained suggest that primary production in each study block as influenced by river geomorphologic features such as river bends and confluences characterized higher hippopotamus density in the upper blocks. Further research is required to investigate other factors that may have interplayed with food (above ground grass biomass) and river meander features to separate upper and lower blocks.
Keywords
Common Hippopotamus, Pattern, Density, Upper Blocks, Lower Blocks
1. Introduction
The Luangwa River holds the most significant proportion of the national hippo (Hippopotamus amphibius) pop- ulation size and density of circa 25,000 individuals and 35/km respectively, which is 62% of the national popu- lation [1]-[3] and therefore, the most important hippo habitat in Zambia and the region. Since Zambia still holds the largest global population of the common hippo [1] [4], this population has also been of global concern and understanding the distribution pattern and the factors characterizing such distribution is critical in improving management of the species and in particular off take levels such as; culling, when the population exceeds its ecological carrying capacity, control and trophy hunting.
Data collected since 1976 have shown that the population has reached its ecological carrying capacity K at 6000 individuals and density of 35/km stretch of the river [2].The density has been varying between 29 and 42 hippos per km of the Luangwa River with the total number rising close to 7000 and falling to 5000 but recover- ing quickly to surpass 6000 individuals over the 165 km stretch. These rise and fall create oscillations which have persisted in the last 36 years (1976-2012). Although Chansa and others [5] [6] suggested that geomorpho-logic features as factors determine the pattern of density distribution; they did not examine the distribution pat-tern between the upper and lower study areas since these are the recognized administrative segments used when conducting culling or trophy hunting. They attributed aggregated nature of distribution to geomorphologic fea-tures such as river meanders and confluences and primary production kg/ha [5] which in their view provided ha-bitat welfare factors such as basking sites and food in varying quantities respectively. The factor of geomorpho-logic features was earlier mentioned by Attwell [7]and Darling [8]. In their description, the pattern of hippopo-tamus population density distribution in the Luangwa River was more aggregated in certain river segments than others but did not allot such distribution to the upper and lower study areas neither did they address specific riv-er segments as provided for undriv-er this study. Attwell [7]additionally reported having taken Darling to the Nsefu sector which he described as being the most densely populated sector of the Luangwa River in 1957, but said nothing about the lower study area. The Nsefu sector at the time had a population of about 100 animals distri-buted over 6.5 km (four miles) of river, and he further noted that Nsefu sector had numerous bends forming large flattened “S” shapes an aspect of which was later studied and reported in detail by Chansa and others [5]. The two studies, conducted by Attwell [7]and Darling [8] did not segment the upper and lower study blocks which for administrative purposes belong to two separate sector regimes.
The various culling programmes conducted in the Luangwa Valley from as early as 1965 to the present dec- ade have usually concentrated around study blocks E - H, leaving blocks A-D almost free of culling, control and trophy hunting. Such culling programmes including the most recent one 2006-2012/13 were based on the overall density of the hippo covering the entire 165 km as one unit. When such calculations of hippo density were made it was assumed that the entire 165 km stretch had uniform density of 35/km and above. Whenever a density of 35/km and above was recorded, a culling was recommended. But such culling did follow segment-based density distribution. In fact in addition to culling pressure, the same areas that were subjected to culling were the same ones that suffered problem animal control and subjected to trophy hunting.
In this study, we argue that the best approach in determining population density distribution would be to iso- late river segments with low and high density distribution and recommend off take levels based on the popula- tion size and segment specific density distribution rather than an average density which considers the entire 165 km river stretch as one unit. Since hippos do not undergo long distance migration like the elephant, this ap- proach would be the most ecologically sustainable way of managing the hippo population along the 165 km riv- er stretch. The study also re-examined the distribution of geomorphologic features and the study on primary production per study block earlier carried out by Chansa and others [6]. We compared river segments which were static and dynamic in terms of changing river course between upper and lower study blocks and recom- mended appropriate densities and plausible off take levels that would not impact negatively on the growth of population size and density. Security features in the form of Wildlife Police Officers and Tourist Lodges as ear- lier reported by Chomba [2] were also re assessed to determine their influence on population size and density distribution.
2. Methods and Materials
2.1. Study Area
Location
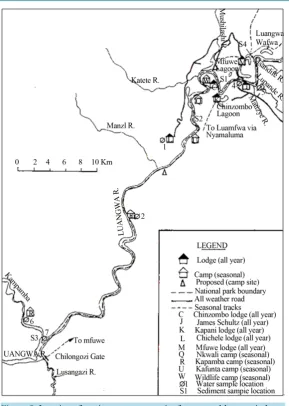
river length for 165 km, starting from the Chibembe pontoon (12˚48'S, 32˚03'E) to the Lusangazi-Luangwa con- fluence (13˚24'S, 31˚33'E). The study area was divided into study blocks A - H, which were further split be- tween upper study blocks A-D and lower blocks E -H(Figure 1;Table 1).
2.2. Population Size
The river bank total count method earlier reported by Chomba (2013) was used, a method which was adopted in 1976 as a standard method for counting hippos in the Luangwa Valley [9]. It has since been possible to compare data collected in different years from 1976 to date.
Calculating Population’s Mean Size and Density
Population mean size and density, were calculated based on the formulae by [10]:
X x
n
= ∑
and hippo density;
N D
L
[image:3.595.142.484.215.692.2]=
Figure 1. Location of study area along Luangwa River, South Luangwa National Park,
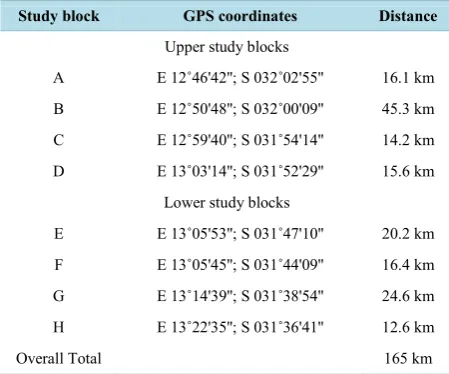
Table 1. Details of the geographic location and coordinates of the study area blocks, A - H. Luangwa Valley, Zambia.
Study block GPS coordinates Distance
Upper study blocks
A E 12˚46'42''; S 032˚02'55'' 16.1 km B E 12˚50'48''; S 032˚00'09'' 45.3 km C E 12˚59'40''; S 031˚54'14'' 14.2 km D E 13˚03'14''; S 031˚52'29'' 15.6 km
Lower study blocks
E E 13˚05'53''; S 031˚47'10'' 20.2 km F E 13˚05'45''; S 031˚44'09'' 16.4 km G E 13˚14'39''; S 031˚38'54'' 24.6 km H E 13˚22'35''; S 031˚36'41'' 12.6 km
Overall Total 165 km
where, D is density; N is the number of hippopotami and L is the river length.
Data on primary production were collected from the data earlier calculated by Chomba [2] for each study block.
2.3. River Geomorphology
A verification of the information earlier reported by Chansa and others [6] and Chomba [2] on river configura- tion and geomorphologic features such as lagoons, river confluences, river bends, and river channel changes in the last half century was made by examining recent maps of the scale 1:250,000 and Google Map Search.
A table showing study blocks, total number of geomorphologic features and their mean length and width measurements per study block and hippopotamus population density which was earlier presented by Chansa and others [5] was also verified. An F Test described by Dytham [11] and Fowler and others [12], was used to com- pare the means of population density between the upper and lower blocks.
2.4. Location of Wildlife Police Officers’ Outposts and Lodges as Security Features
Global Positioning System coordinates were taken for all Lodges, Wildlife Police Officers (WPO) outposts and Tourism Concession Blocks (TCB) located within 2 km of the river bank along the 165 km river stretch. The physical location of WPO outposts, Lodges and TCBs were considered to be important security features in de- terring poaching incursions and hence promoting high hippo population densities [13]. Data on patrol man days, based on Jachmann and Billiouw [14] which show the intensity of patrols in the area, were collected from South Luangwa Area Management Unit headquarters at Mfuwe.
The location of WPO outposts and lodges were considered to be security features that deterred poaching in- cursions. These were plotted using GIS coordinates and a map showing their location was produced. An absence or presence matrix was produced that matched hippopotamus schools with the presence or absence of WPO outposts and Lodges. The density of hippo along the river stretch was then matched with the security outposts to see whether there were more hippos in areas with more WPO outposts and less density in areas with fewer WPO outposts.
3. Results
3.1. Population Distribution between Upper and Lower Study Blocks
higher mean density 41/km than the lower blocks 29/km. Table 1 below compares population size of upper and lower blocks between 1976 and 2012.
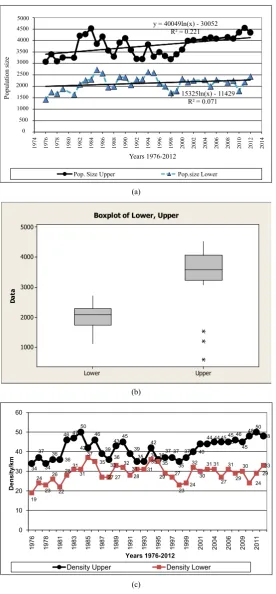
A regression analysis comparing the upper and lower blocks showed a higher rate of population increase for the upper blocks (y = 40049 in(x) − 30042, R2 = 0.0.221) contributing 66% to the total population increase be-
tween the periods 1976-2012. The lower blocks had a smaller population size and probably declining at K and a lower rate of increase (y = 1532ln (x) − 11429, R2 = 0.071) and accounted for only 33% overall population size
(Figure 2(a),Figure 2(b)).
The upper blocks had a mean size of 4000 (3, 763) individuals at K and a mean density of 41 individuals per km stretch at K, while the lower blocks had 2000 (2, 137) and mean density of 29/km of the river stretch (Table 2; Figures 2(a)-(c)). At the time of conducting this study, both study blocks had reached their ecological carry- ing capacity at density of 41 and 29 individuals respectively, implying that the northern blocks have a higher carrying capacity than the lower study blocks
The assertion that upper blocks carried higher densities was further explored by Variance Ratio Test (F test) (Fowler et al., 1998; Afifi and Azen, 1979), which compared variances of hippo population density between upper and lower study blocks. The F test showed a significant difference in population density variances be- tween upper and lower blocks (Fo = 0. 010 (2) n1 = 30 n1 = 30; Fo = 0.05 (1) n2 = 30, n2 = 30 = 2.63, P < 0.001).
The hippopotamus population size in both upper and lower blocks was above K. A regression analysis of the annual population change between lower and upper blocks indicated a higher decline in the annual population change for lower blocks (y = −4.777x + 9541.8, R2= 0.0212) and a marginal decline for the upper blocks (y = −1.1738 x = R2 =
0.0008) which is an indication that the populations was declining downwards towards K. The years of increase and decline in both upper and lower blocks were not different (Figure 3).
3.2. Influence of Primary Production on Hippopotamus Density Distribution
The amount of grass biomass per study block A - H along the 165 km river stretch varied significantly, being higher in some study blocks and lower in others (χ2 = 2, 204.58, DF = 7, α = 0.05, P < 0.05). Study blocks with
high grass biomass (46% of total primary production) had the highest hippo population density. Hippo popula- tion density therefore, followed amount of food (biomass) per study block A-H (Table 3).
The upper blocks had 60% of the biomass with mean of 9000 kg/study block while the lower blocks had 6366 kg/study block.
3.3. Prevalence of River Geomorphologic and Security Features
The number and nature of geomorphologic features (river bends, confluences and lagoons) was still 64 and had not changed since Chansa and others carried out a similar study [5] [6] reported in 2011. After food (grass bio- mass), geomorphologic features were the second most important factor in regulating hippo pattern of population density distribution between study blocks A-H along the 165 km stretch of the Luangwa River and not security. The river segment in the upper study blocks was more dynamic and had many river course changes(Figures 4(a)-(f)) but more or less static in the lower study blocks with more or less no river course changes (Figure 5). Both had security features in form of Lodges and WPO outposts.
In the lower study blocks, the river was less dynamic, but security features were present (Figure 5).
The pattern of hippo population density distribution was found to be higher in upper study blocks which also had more and longer geomorphologic features while the lower study blocks had fewer and more sparse geo- morphologic features (χ2 = 50.40, DF = 7, α = 0.05, P < 0.05).
3.4. Number of Geomorphologic Features and Hippo Density Distribution
Results on the comparison of the number of geomorphologic features between the upper and lower study blocks showed that hippo density distribution was higher in study blocks with a larger number of geomorphologic fea- tures. As the number of geomorphologic features declined (y = −1.131x + 13.214, R2 = 0.5662), hippo density
also declined (y = −3.5564x + 47.671, R2 = 0.2839) (Figure 3).Study blocks with more geomorphologic fea-
y = 40049ln(x) - 30052 R² = 0.221
y = 15325ln(x) - 11429 R² = 0.071
0 500 1,000 1,500 2,000 2,500 3,000 3,500 4,000 4,500 5,000
1974 1976 1978 1980 1982 1984 1986 1988 1990 1992 1994 1996 1998 2000 2002 2004 2006 2008 2010 2012 2014
Popul at ion s iz e Years 1976-2012
Pop. Size Upper Pop.size Lower
5000 4500 4000 3500 3000 2500 2000 1500 1000 500 0 (a) D at a Upper Lower 5000 4000 3000 2000 1000
Boxplot of Lower, Upper
(b)
[image:6.595.176.453.80.676.2](c)
Figure 2. (a) Population size between upper and lower for the period 1976-2012 (b) box plot comparing population means for upper and lower study blocks, (c) density distribution between upper and lower study blocks, South Luangwa National Park, 2012, Zambia.
34 37 34 36 36 46 47 50 42 46 39 36 4345 39 35 35 42
3637 37 35
37 40 44 44 45
45 45 46 45 4850 48 19 24 23 26 22 283131
37 35 27 27 33 32 28 31 31 36 35 29 27 23 24 32 30 31 31 27 31 29 30 24 29 33 0 10 20 30 40 50 60
1976 1978 1981 1983 1985 1987 1989 1991 1993 1995 1997 1999 2001 2004 2006 2009 2011
D en si ty /km Years 1976-2012
Table 2. Comparison of population between upper and lower study blocks, South Luangwa National Park, 2012, Zambia.
Year Pop. Size Density Pop. Change Pop. Size Density Pop. Change
Upper Upper Upper Lower Lower Lower
1976 3076 34 1425 19
1977 3403 37 327 1744 24 319
1978 3095 34 −308 1670 23 −74
1979 3260 36 165 1891 26 221
1981 3251 36 −9 1633 22 −258
1982 4211 46 960 2082 28 449
1983 4282 47 71 2262 31 180
1984 4534 50 252 2298 31 36
1985 3857 42 −677 2723 37 425
1986 4174 46 317 2567 35 −156
1987 3566 39 −608 1956 27 −611
1988 3301 36 −265 1988 27 32
1989 3913 43 612 2408 33 420
1990 4107 45 194 2388 32 −16
1991 3590 39 −517 2061 28 −327
1992 3199 35 −391 2301 31 240
1993 3192 35 −7 2301 31 240
1994 3829 42 637 2620 36 459
1995 3298 36 −531 2588 35 −32
1996 3497 37 109 2119 29 −469
1997 3329 37 −78 2001 27 −118
1998 3188 35 −141 1716 23 −285
1999 3401 37 213 1788 24 72
2000 3605 40 204 2333 32 545
2001 3990 44 385 2179 30 −154
2002 4019 44 29 2253 31 74
2004 4068 45 49 2282 31 29
2005 4138 45 70 1992 27 -290
2006 4085 45 −53 2284 31 292
2008 4151 46 37 2167 29 −117
2009 4087 45 −64 2244 30 77
2010 4355 48 268 1795 24 −449
2011 4554 50 99 2184 29 389
2012 4351 48 −203 2426 33 242
Mean 4000 41 2000 29
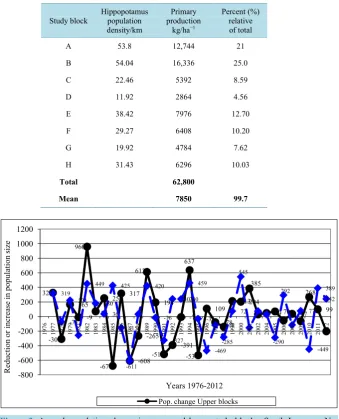
Table 3. Comparison of hippopotamus population density and primary production (food) between study blocks. Luangwa Valley, Zambia (Data are for the year 2008 from Chomba et al.
2012).
Study block Hippopotamus population density/km
Primary production
kg/ha−1
Percent (%) relative of total
A 53.8 12,744 21
B 54.04 16,336 25.0
C 22.46 5392 8.59
D 11.92 2864 4.56
E 38.42 7976 12.70
F 29.27 6408 10.20
G 19.92 4784 7.62
H 31.43 6296 10.03
Total 62,800
[image:8.595.143.483.129.549.2]Mean 7850 99.7
Figure 3. Annual population change in upper and lower study blocks, South Luangwa Na- tional Park, 2012, Zambia.
(χ2 = 218.6, DF = 7, α = 0.05, P < 0.05). Study blocks, A and B which are in the upper study area, had the high-
est number of geomorphologic features and also the highest density (Figure 6).
The number of geomorphologic features declined significantly between study blocks A - H (y = −1.131x + 13.214, R2 = 0.5662). Hippo density also declined with decline in the number of geomorphologic features (y =
−3.5564x + 47.671, R2 = 0.2839).
There was a significant difference in the overall hippo density between upper study blocks (A - D) and lower study blocks (E - H). Such differences in density were partly attributed to the difference in the number of geo- morphologic features between upper and lower study blocks (Figure 6). Upper study blocks had a total number of 40 geomorphologic features and mean hippopotamus density of 41/km while the lower blocks had 24 geo- morphologic features and lower hippo density of 29/km. The high number of geomorphologic features in the upper study blocks was attributed partly to the river course changes that have occurred in the last 50 years (Fig- ure 4(b) andFigure 4(c)).
327 -308 165 -9 960 252 -677 317 -608 -265 612 194 -517 -391 -7 637 -531 109 -78 213204 385
49 70 37 268 99 319 -74 221 449 180 36 425 -156 -611 420 -16 -327 240240 459 -32 -469 -118 -285 72 545 -290 292 77 -449 389 242 -800 -600 -400 -200 0 200 400 600 800 1000 1200 19 76 19 77 19 78 19 79 19 81 19 82 19 83 19 84 19 85 19 86 19 87 19 88 19 89 19 90 19 91 19 92 19 93 19 94 19 95 19 96 19 97 19 98 19 99 20 00 20 01 20 02 20 04 20 05 20 06 20 08 20 09 20 10 20 11 20 12 R educ tion or inc re as e i n popul at ion s iz e Years 1976-2012
(a) (b)
(c)
(f)
Figure 4. Upper study blocks; (a) River meanders and lagoons, (b) River meanders 1953-1957, (c) Minor channel which form river cu- toffs; (d) (e) Luangwa River meander cut offs, which form grassland plains in upper, (f) River meanders and tourist camps in upper study area, Luangwa Valley, Zambia (Modified after Sichingabula, 1998; Anon, 2008), South Luangwa National Park, Zambia.
The highest density was in study blocks A (53.80 individuals/km) and B (54. 04 individuals/km) both of which were in the upper study blocks which also had the highest number of geomorphologic features (exceeding eight) and only block E in the lower study blocks had eight geomorphologic features and density of 38.42 indi- viduals/km which was also above overall hippo density of 35 individuals/km (Table 3).
3.5. Security
3.5.1. Location of Wildlife Police Officers Outposts
Results suggest that security was not an important factor in promoting density. The location of Wildlife Police Officer’s (WPO) outposts showed no direct influence on hippo population size and density distribution between upper and lower study blocks. Although the number of WPO outposts varied significantly between study blocks A-H (χ2 = 56.62 DF = 7, α = 0.05, P < 0.05), being high in some study blocks and lower in others, they did not
match with hippo density. Block E in the lower study blocks had the largest number and also housed the Nation- al Park headquarters but did not have the largest hippo density as would have been expected. Based on this fact, it was assumed that the number of WPO outposts did not influence hippo population size and pattern of density distribution.
Figure 5. Location of tourist camps as security features and lagoons in lower study area (Modified after Sichingabula, 1998; Anon, 2008).
(22.72% of total) WPO outposts which was fewer than the lower study area which had the highest number 34 (77.27% of total). The lower study blocks (E - H) despite having the largest number of WPO outposts (77.27%) as security features, had the lowest hippo population size and density. Among all the study blocks in the study area, block E had the highest number of security features 16 (36.36%) (Table 4), but did not have the highest population density/km.
3.5.2. Patrol Mandays
The number of patrol mandays and length of patrols did not influence hippo population size and density distri- bution along the 165 km stretch. However, the total number of patrol mandays and length of patrols increased significantly between 2007 and 2008. Patrol mandays in 2007 were 7, 958 and actual time spent patrolling in the field for more than one day was 6, 954 days. In 2008 patrol mandays were 10, 001 and actual time spent patrol- ling in the field for more than one day was and 8, 169 days. The increases in patrol mandays between 2007 and 2008 was significant (χ2 = 232.41, DF = 1, α = 0.05, P < 0.05), but conversely, there was a slight decline in
Figure 6. Plot of number of geomorphologic features between upper and lower study blocks and hippopotamus density distribution, Luangwa Valley, Zambia.
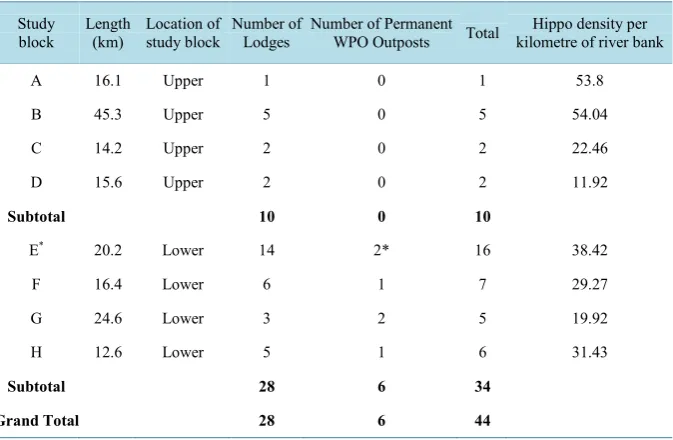
Table 4. Number of Wildlife Police Officers outposts and Lodges, in the upper and lower study blocks. Luangwa Valley, (Data from Chomba, 2013).
Study
block Length (km) Location of study block Number of Lodges Number of Permanent WPO Outposts Total kilometre of river bank Hippo density per
A 16.1 Upper 1 0 1 53.8
B 45.3 Upper 5 0 5 54.04
C 14.2 Upper 2 0 2 22.46
D 15.6 Upper 2 0 2 11.92
Subtotal 10 0 10
E* 20.2 Lower 14 2* 16 38.42
F 16.4 Lower 6 1 7 29.27
G 24.6 Lower 3 2 5 19.92
H 12.6 Lower 5 1 6 31.43
Subtotal 28 6 34
Grand Total 28 6 44
Note: *Is the regional headquarters for the eastern region and had the highest security features.
tween upper and lower study blocks; because between 2007 - 2008 when patrol mandays increased, hippo pop- ulation declined.
y = -1.131x + 13.214
R2 = 0.5662
y = -3.3364x + 47.671
R2 = 0.2839
0 10 20 30 40 50 60
A B C D E F G H
Study blocks A-H
H
ippo de
ns
ity/
km
; N
o. of ge
om
. fe
at
ure
s
Total number of geomorphologic features Hippo. density /km
[image:12.595.131.468.451.671.2]4. Discussion
4.1. Influence of Quantity of Herbage Produced on Population Size and Density
Results earlier obtained by Chomba [2] suggest that the amount of food produced influenced hippo population size and density. Study blocks with high biomass had more food available to support high hippo density. Food availability enabled hippo to obtain adequate daily food requirements which was converted into protein thus ex- plaining why upper study blocks which also had herbaceous biomass > 7000 kg/ha, had high hippo density of up to 42/km. Based on the amount of food produced and daily consumption of 2.5% of body weight, areas with grass biomass below 7000 kg/ha could not provide adequate amount of food to keep hippos in good body condi- tion. In such study blocks, such as the ones in the lower study blocks could only sustain low animal density of less than the overall mean of 35/km.
It is therefore assumed that in years of drought, there would be low biomass and animals would be in poor condition. In such years, the lower study blocks should not be permitted to exceed 35/km but should be kept be- low 29/km. In years of low rainfall or during the dry season, water flow would be reduced and many pools and lagoons would dry up. Given the reduced number of pools, particularly in the lower study blocks, competition for limited wallowing space would increase. School size would also increase as individuals crowd in areas with limited pools of water which would lead to crowding there-by accentuating aggressive behavior which ultimate- ly increases stress levels. Coupled with reduced food base in dry years/dry season, animals would lose body condition and may be unable to breed. Food availability therefore, and not security was suggested to be the main factor responsible for the large disparity in population size and density between upper and lower study blocks.
4.2. Role of Non Food Resources in General
River geomorphologic features were found to be critical attributes in a hippo habitat by influencing density dis- tribution patterns[6]. These provided sand bars for basking, which conserves energy for the hippo that is known to have low fat reserves relative to body size. Sand bars and shallow pools also acted as mating (Figures 7(a)-(e)) and nursery areas for securing calves (Figure 8), the latter of which increased calf survival. In areas with many geomorphologic features therefore, there would be relatively higher calf survival. School size would also be smaller as there would be adequate space to spread out individuals thereby minimizing aggressive beha- viour which conserves energy that is consequently channeled towards reproduction. Areas with more geomor- phologic features such as the upper study blocks had higher densities and carrying capacity (Figure 2(a)). Shore length was also longer in areas with bends and shorter in areas where the river was straight. Longer shore length provided more space to accommodate more hippo schools and establishment of territories by males which mi- nimizes territorial fights.
River meandering and cut offs (Figure 4)also provided adequate cooling and wallowing sites for hippo and subsurface moisture in these areas supported plant growth even in the dry season which increased herbaceous biomass production. In the upper study area for instance, where there were more geomorphologic features, hippo density was highest and carrying capacity was also higher than lower river segments which had fewer geomor- phologic features.
It is a well known fact that hippos depend on water to cool their bodies and to keep the skin moist to prevent dehydration. Owing to their relatively low fat reserves, hippos therefore, require basking to warm their bodies. They also require shallow areas for mating purposes. In this study, it was assumed that hippo population distri- bution would be influenced by geomorphologic features which provide for; day time cooling, wallowing and basking and other habitat welfare factors.
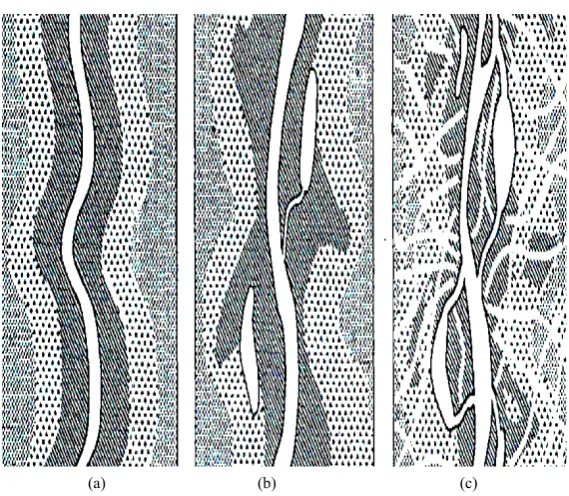
It was also assumed that certain geomorphologic features such as lagoons were important dispersal areas for hippo. River segments with high number of geomorphologic features were expected to have higher hippo densi- ty/km and such high hippo influenced river morphology which in turn created additional hippo micro habitats as modeled by Naiman and Rogers [15] (Figure 9).
Based on this interpretation, upper study blocks are synonymous with Figure 9(b),Figure 9(c) and Lower study blocks Figure 9(a).
(a) (b)
(c) (d)
[image:14.595.86.538.81.540.2](e)
Figure 7. Shallow pools are used for mating, (a) Courtship begins on land with male rubbing females’ hindquarters and flanks, after the urine-testing grimace, (b) Male attempts to mount and female submits, (c) Female lies in prone and submis- sive posture to allow male to mount successfully, (d) Mating begins, (e) Mating completed and pair heads for grazing, Lua- ngwa Valley Zambia, 2007. (Photographs courtesy of Mark and Iise Tennat).
mating (Figures 7(a)-(e)) and others (Figure 10)rather than straight river segments with steep banks which are not suitable hippo habitat.
It is evident that river course changes which create lagoons, sand bars and grassland plains influence hippo density distribution by providing pasture areas and suitable habitat welfare factors such as sand bars for basking and shallow areas where calves can bask while being protected from land predators and thereby enhancing calf survival (Figure 8). This analysis of hippo density distribution along river geomorphologic features has shown that river geomorphologic features influenced hippo pattern of population density distribution along the 165 km river stretch and not security as previously thought at the stage of planning this research.
Figure 8. Shallow pools are favourable physical attributes for calves; they can cool their bodies while at the same time being protected from land predators such as lion even when they are not close to the mother. Luangwa River, Zambia.
[image:15.595.195.435.81.295.2](a) (b) (c)
Figure 9. Influence of hippopotamus on river morphology,(a) low disturbance few animals, (b) moderate hydrologic disturbance and (c) hydrologic and ani- mal disturbances high population density (Naiman and Rogers, 1997).
[image:15.595.171.456.343.591.2]
(a) (b)
[image:16.595.90.538.84.330.2]
(c) (d)
Figure 10. (a) Hippos use shallow areas of the river for cooling their bodies and basking. Nsefu area, upper study block A, (b) Gentle slopes and sand bars common in the upper study blocks where there are numerous river meanders are suitable basking areas for hippopotamus schools, (c) Sand bars at a river bends in upper study block B are favourable physical fea- tures in the hippo habitat, (d) Straight river segment with fast running water devoid of sand study block F lack sand bars for basking and grasslands for grazing, Luangwa River, Zambia.
High frequency occurrence of geomorphologic features in the upper study blocks (A-D) was found to be the main reason why the upper study blocks (A - D) had the highest hippo density distribution (Figure 2), while meandering of the river in the upper blocks was found to be the main cause of river cut offs (Figure 4) leading to the formation of lagoons and widening of river mouths. It was earlier suggested by Sichingabula [16] that widening of river mouths occurred when tributaries failed to off-load their water into the Luangwa River during high floods which encouraged a back flow that subsequently eroded the banks of the tributaries. Sand deposits would then accumulate at the mouth of the tributary; consequently the tributary would continue to cut its banks on each side to offload water into the Luangwa Riverand thus forming sand bars. In the process some of the water would flood the surrounding areas thus supporting grassland growth. At times, such overflow would feed into lagoons. Such lagoons and meander cut offs remained green even in the dry season which provided rich pasture for hippo. These geomorphologic features combined with expansive grassland plains in the upper study blocks were the main reasons for higher hippo population density in the upper study blocks (Figure 2(c)). Areas where the river was straight, devoid of sand bars and other suitable habitat attributes were generally not suitable for hippo and had lower hippo densities/km(Figure 10(c)).
It was established based on the density distribution pattern that geomorphologic features influenced high den- sities of hippo recorded in blocks A, B and E. It was also evident that other water bodies in sub-Saharan Africa with similar features as the ones recorded in this study would have capacity to carry high hippo densities, if there is adequate security to minimize poaching. Translocation of hippo to new areas should also consider such features as being the best habitat attributes in selecting hippo release sites.
dering more than a mile (2.59 km) away from the river. This suggested that meandering of the river which slowed down water flow, encouraged spill overs which filled lagoons and in turn holding water for a large part of the year. This promoted growth of green and luxuriant grass throughout the year by way of subsurface mois- ture unlike the lower blocks where the few lagoons dried much earlier in the year. Availability of subsurface moisture allowed green grass to continue growing in the dry season providing quality food for the hippo [17], and this explains the higher population densities in the upper blocks.
In 1960, Darling [8]admitted that the Nsefu area was well supplied with lagoons and depressions, but at the same time it was being heavily used by elephant, buffalo, and several antelope species, yet hippo densities were also high. He [8]could not say, after examination of the well-used grassland that it bore signs of over use. In his repeat visit, he assessed hippo distribution along Luangwa River and concluded that Nsefu Sector (upper study blocks A - B) had more lagoons and pans than any other section of the river and carried the greatest density of hippo in the Luangwa River, but provided no reasons for such skewed density distribution.
This study therefore, has underscored the importance of river geomorphologic features in influencing hippo population density distribution, as also supported by Sichingabula [16] who showed the importance of river bends in slowing the flow of water and filling of lagoons. In this study, we confirmed Sichingabula’s assertion [16] after it was observed that the few lagoons in the lower blocks dried earlier in the year (also recorded earlier August in 2007 by Chansa et al. (2011a) than the ones in the upper blocks where lagoons retained water into the rainy season. Such water provided subsurface moisture in the dry season which promoted growth of green grass [17] [18], while a large part of the lower study area remained dry during the end of the dry season (October-No- vember). With these observations, it was found that geomorphologic features influenced hippo population den- sity distribution, by providing microhabitats and influencing primary production through moisture retention in the dry season.
4.3. Security Features along the Luangwa River
It was initially thought that security along the 165 km stretch was an important factor promoting high densities as poaching was to a large extent deterred [2].
Contrary to the popular view that security promotes population increase, it was in the present study concluded that hippo population distribution between upper and lower blocks was not influenced by levels of security. The pattern of distribution influenced by security levels was however, reported in elephant by Barnes and Kapela [19] but does not seem to apply to hippo in general. Very low numbers of hippo were poached, mainly because; (a) hippo is not popular meat for Luangwa Valley residents who believe that it causes leprosy, a belief which is also shared with residents of Rukwa area in Tanzania and hence low demand for hippo meat among the local Kunda tribe, (b) there is a well developed community based natural resources management (CBNRM) in which local communities participate in managing wildlife and this has improved and encouraged positive community atti- tudes towards wildlife including hippo [13],(c) communities collect a 50% share from all hunting revenues and so an animal sold on safari would be of more economic value than meat from poachers and hence engage rela- tively less in hippo poaching, (d) hippo is classified in Appendix II of CITES which requires a permit in order to export any specimen which makes it difficult for hippo teeth from poached specimens to enter the legal interna- tional market and hence no incentive for residents to engage in commercial poaching, and (e) the area along the Luangwa river is the most patrolled area in South Luangwa National Park[19] [20] which when combined with community involvement in law enforcement are deterrent enough to prevent poaching incursions. Poaching and other forms of mortality are therefore discounted from being key factors regulating hippo population size. The caution here however, is that; although security was not found to have a significant impact on hippo population size, it is still critical that Zambia Wildlife Authority maintains law enforcement along the Luangwa River to secure the species from poaching in the long-term.
4.4. Location of Wildlife Police Officers Outposts and Lodges
where local communities share revenues from hunting of hippo on a 50% basis with Zambia Wildlife Authority. Communities also get a 50% share from all the revenues generated from hippo culling programmes. These fi- nancial benefits could have influenced positive attitudes towards hippo by the local communities and hence to- lerating some of the damage to human property caused by hippo such as destruction to crops (Anon, 2007). The only exception when hippo would not be tolerated was when human life was lost, Kakumbi CRB chairperson (personal. comm.). The second reason was due to high levels of security provided by the South Luangwa Area Management Unit (SLAMU) which receives financial assistance from the Norwegian Agency for International Development (NORAD). NORAD has provided budgetary support to the area since the mid 1980s. Such con- sistent financial support has enabled SLAMU to conduct monthly patrols along the 165 km river stretch.
In support of this observation, where food was found to be the main factor, Bere [20] also noted high popula- tion density in Congo and attributed such densities to a rich food base due to a favourable rainfall and presence of river rapids and sand bars. Similarly, distribution of hippo in Lake Kariba seemed to have been in alignment with areas with river mouths, shallow areas with sand bars and grassland plains as shown by Moreau [21]. On the southern shores of Lake Tanganyika located in the Nsumbu National Park, hippo schools were also mainly concentrated around the Lufubu river mouth, Kasaba bay, Nkamba bay and other bays where the banks were low enough for the species to come out of the water at night to the grassland plains for grazing Kasempa (per- sonal comm.). In rocky steep banks of the south banks of the Lake Tanganyika, very few hippo sightings were made. We construed rare sightings of hippo in areas with steep banks and rock outcrops to imply single males that were unable to access desirable habitats where dominant males chase them away (personal experience). Similar observations were made by the Green Force Research Team on Lake Itezhi tezhi where hippo schools favoured shallow areas and low banks and river mouths where they could easily access sand bars and grassland areas for grazing Stewart (personal. comm.). Security like disease therefore, comes as a secondary factor in de- termining population regulation.
5. Conclusion
River Geomorphologic Features
The present study found that hippo pasture was mainly restricted to the alluvial belt which had in some instances vast grasslands such as the Nsefu Plains. Such grasslands were also associated with areas of river meanders and cut offs and lagoons. Such geomorphologic attributes provided microhabitats for hippo and were major reasons for the high hippo densities in the upper study area where the geomorphologic features and grassland plains were most abundant. Meandering of the river produced sand bars which provided basking areas for adults and nursery grounds for calves. Additionally, sand bars increased security from lion for calves and senescent indi- viduals thereby increasing calf survival. This conclusion tallied with the findings by Scotcher and others [22] who also noted that river geomorphology influenced distribution of hippo schools in favour of slow moving and meandering courses with sand bars or rocks where individuals can bask. Owing to relative low fat reserves un- der the skin in hippo (unlike other animals of similar size), sun basking was important in keeping the body warm and so areas with sand bars would be preferred habitats for hippo.
References
[1] Chansa, W. and Milanzi, J. (2010) Population Status of the Hippopotamus in Zambia. African Journal of Ecology, 49, 130-132.
[2] Chomba, C. (2013) Factors Affecting the Luangwa (Zambia) Hippo Population Dynamics within Its Carrying Capacity Band—Insights for Better Management. International Journal of Biodiversity and Conservation, 5, 109-121.
[3] Chansa, W., Senzota, R., Chabwela, H.N. and Nyirenda, V. (2012) Does Shore Length Influence Population Size and Density Distribution of Hippopotamus? Journal of Ecology and the Natural Environment, 4, 150-153.
[4] Lewison, R., (2007) Population Responses to Natural and Human-Mediated Disturbances: Assessing the Vulnerability of the Common Hippopotamus (Hippopotamus amphibius). African Journal of Ecology, 45, 407-415.
http://dx.doi.org/10.1111/j.1365-2028.2006.00747.x
[5] Chansa, W., Milanzi, J. and Sichone, P. (2011) Influence of River Geomorphologic Features on Hippopotamus Density Distribution along Luangwa River, Zambia. African Journal of Ecology, 49, 221-226.
http://dx.doi.org/10.1111/j.1365-2028.2010.01252.x
Hip-popotamus Population Density Distribution along Luangwa River, Zambia. Journal of Ecology and the Natural Envi-ronment, 3, 186-194.
[7] Attwell, R.I.G. (1963) Surveying Luangwa Hippo. Puku, 1, 29-49.
[8] Darling, F.F. (1960) Wildlife in African Territory. Oxford University Press, London.
[9] Tembo, A. (1987) Population Status of the Hippopotamus on the Luangwa River, Zambia. African Journal of Ecology,
25, 71-77. http://dx.doi.org/10.1111/j.1365-2028.1987.tb01094.x
[10] Onyango, J.P. and Plews, A.M. (2005) A Text Book of Basic Statistics. East African Educational Publishers, Nairobi. [11] Dytham, C. (2004) Choosing and Using Statistics: A Biologists’s Guide. Blackwell Publishing, Victoria.
[12] Fowler, J., Cohen, L. and Jarvis, P. (1998) Practical Statistics for Field Biology. John Wiley and Sons, New York. [13] Anon. (2007) South Luangwa Area Management Annual Report. Zambia Wildlife Authority, Mfuwe.
[14] Jachmann, H. and Billiouw, M. (1997) Elephant Poaching and Law Enforcement in the Central Luangwa Valley, Zambia.
Journal of Applied Ecology, 33, 1241-1250.
[15] Naiman, R.J. and Rogers, H.K. (1997) Large Animals and System-Level Characteristics in River Corridors. Bioscience,
47, 521-529. http://dx.doi.org/10.2307/1313120
[16] Sichingabula, H. (1998) Hydrology, Character of Channel Changes on Luangwa River, Their Impacts and Implications on Tourism, South Luangwa National Park and Adjacent Game Management Areas. Report Prepared for EDF/NPWS towards the Development of a General Management Plan for South Luangwa National Park and Adjacent Game Man- agement Areas, Chilanga.
[17] Anon. (2008) Report to Zambia Wildlife Authority on the Hippopotamus Survey. Chinzombo Research Centre, Chilanga. [18] Child, G. (1999) An Evaluation of the Hippopotamus Impacts on Habitats along the Luangwa River. A Report Sub-
mitted to the Norwegian Agency for International Development, Chipata.
[19] Barnes, R.F.W. and Kapela, E.B. (1991) Changes in Ruaha Elephant Population Caused by Poaching. African Journal
of Ecology, 29, 289-294. http://dx.doi.org/10.1111/j.1365-2028.1991.tb00466.x
[20] Bere, R.M. (1959) Queen Elizabeth National Park, Uganda: The Hippopotamus Problem and Experiment. Oryx, 5, 116- 124. http://dx.doi.org/10.1017/S0030605300000454
[21] Moreau, J. (1997) Advances in the Ecology of Lake Kariba. Print Holdings, Harare.