An Efficient and Automatic Systolic Peak Detection
Algorithm for Photoplethysmographic Signals
Srinivas Kuntamalla
Department of Physics National Institute of Technology
Warangal, India - 506004
L. Ram Gopal Reddy
Department of Physics National Institute of Technology
Warangal, India - 506004
ABSTRACT
Processing of physiological signals often involves detection of peaks and finding intervals between them. Well developed methods are available for Electrocardiogram(ECG) QRS complex detection. However, there are only a few algorithms published for peak detection suitable for pulse wave signals such as arterial pressure wave and photoplethysmographic (PPG) signals. Algorithms for detection of QRS complex in ECG are based on the impulsive character of the signal and are not applicable for pulse wave signals, which are more sinusoidal in nature and the shape varies with age. In this background, a versatile algorithm based on the physiology of the pulse wave is developed to detect the peaks from a pulse wave signal such as PPG. The algorithm combines the technique of moving average of valley-peak differences with an adaptive threshold filtering to detect the systolic peaks. The algorithm is validated against a publicly available validation dataset and achieved a sensitivity of 99.82 and a positive predictivity of 98.88 when compared to expert manual annotations. This algorithm is computationally simple and can be easily implemented in real time processing hardware.
General Terms
Algorithms, Biomedical signals, Signal processing
Keywords
Peak detection algorithm, Systolic peaks, Photoplethysmographic signal (PPG), Pulse oximetry, Pulse transit time, Heart rate variability.
1.
INTRODUCTION
Detection of peaks often forms an essential part of time domain analysis of biomedical signals and patient monitoring. Peak detection is the process of finding the locations and amplitudes of local maxima in a signal that satisfies certain properties. Generally a signal sample x(n) is considered as a peak when it is greater than its previous sample and next sample (x(n-1) < x(n) > x(n+1)). Fortunately, the peak detection algorithms for Electrocardiogram (ECG) signals are well developed and widely available [1]. Whereas, there are only a few publications that describe algorithms to detect features in pulse wave signals such as arterial pressure wave and photoplethysmographic (PPG) signals [2–5].
Most of the algorithms for detection of QRS complexes in ECG combine a band pass filter with a transformation, such as the signal derivative or the wavelet transform, to exploit the large slope and high frequency content of the QRS complex (10 to 25 Hz). This transformation generates a feature signal in which QRS complexes can be detected easily by a threshold. In contrast, PPG signals are more sinusoidal and
less impulsive than ECG signals and most of its power is in a lower frequency range, typically from 0.7–3.5 Hz. Thus, the algorithms that rely on the impulsive shape of the QRS complex are inappropriate for PPG signals and cannot yield accurate results.
In the absence of suitable algorithms, PPG signals are manually annotated to get the desired components. Although, some researchers use their own semi automatic algorithms which may not match the performance, generality and the robustness of algorithms available for the analysis of ECG signal [6]. However, pulse-oximeters employ different techniques to detect peaks necessary for estimation of blood oxygenation level and, invariably these algorithms are proprietary and not available for use by others. There are a variety of other applications that require detection of systolic peaks such as measurement of baroreflex sensitivity [7], assessing the interaction between respiration and beat-by-beat ventricular parameters and stroke volume [8]. Pulse wave peak detection also helps to study large-artery damage [9] and peripheral vascular disease [10]. Further, the intervals between successive peaks in a pulse wave give a measure of the instantaneous heart rates in supine position [11-13]. It is also necessary to find systolic peaks of PPG signal to calculate pulse transmit time (PTT) and pulse wave velocity (PWV). PTT and PWV are extensively used for determining physiological parameters such as blood pressure[14], left ventricular ejection time (LVET), left ventricular pre-ejection period (LVPEP)[15]and arterial stiffness [16]. PTT is also a good indicator for monitoring patient’s blood loss during a surgical operation [17]. Hence peak detection has become very important in time domain analysis of PPG signal.
The peak detection algorithm of Mateo Aboy et.al [2] use multistage complex processing, and has the inherent disadvantage of using heart rate for fixing of cut off frequencies and interval decision logic. The heart rate is determined using Blackman Tukey power spectral density, which adds to the complexity of the algorithm. Another important algorithm applicable to pulse wave signals is that of Ernesto F Treo et.al [3]. But it is meant for only beat separation and interval measurement and can’t be used for peak detection. Hangsik Shin et al proposed an adaptive threshold method for peak detection of PPG signals, which is based on processing of minimum and maximum amplitudes of signal along with time intervals. This method has a limitation that it cannot classify incident wave peak and reflected wave peak of PPG signal, when the reflected wave peak is large and close to the incident wave peak[4].
this method, four points in each rising edge of pulse are detected and similarity of closely positioned rising edges is estimated. The current rising edge is considered a valid edge in the pulse wave when the estimated similarity satisfies one of the seven decision rules. The authors did not provide any performance measures such as sensitivity and specificity etc. The algorithm is very lengthy and lots of computations are required and more over each rising edge has to be tested with a seven-rule decision logic [5]. In this background, a versatile algorithm governed by the physiological aspects of pulse wave is developed to detect the systolic peaks in the plethysmographic signal.
Fig 1: Typical Volume or Pressure pulse wave: AP1-systolic peak amplitude, AP2-dicrotic peak amplitude, AV1 and AV2 are the corresponding valley amplitudes
2.
ALGORITHM DESCRIPTION
2.1
Overview
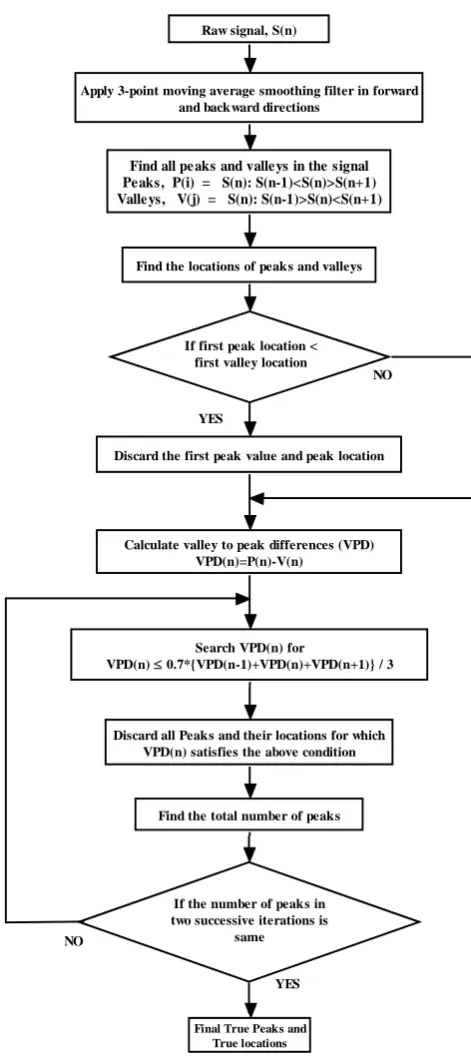
The algorithm developed is based on considering the physiology of the cardiovascular system. The typical volume pulse wave shape of the peripheral artery is shown in figure 1. There are two peaks corresponding to two waves, systolic wave and dicrotic wave. The valley between these two waves is called dicrotic notch. The location of the dicrotic notch changes from subject to subject and also depends on the age [18]. This prevents the use of simple threshold to detect systolic peaks as compared to peak detection in ECG. The algorithm uses the relative amplitudes of corresponding systolic and dicrotic waves to distinguish the systolic peaks from the dicrotic peaks. The algorithm detects the systolic peaks from the PPG signal and takes care to eliminate the minor peaks due to dicrotic notches and noise by using the wave amplitudes in combination with a moving average technique. The difference between successive valley amplitude and peak amplitude (valley – peak difference (VPD)) gives the amplitudes of systolic and dicrotic waves. The algorithm employs moving average of valley- peak differences along with local threshold filters to identify the systolic peaks. All the spurious peaks due to noise and dicrotic peaks are eliminated by looping, until the number of peaks remains unchanged in two successive iterations. The flow diagram of the algorithm is given in figure 2. Different stages in processing a typical signal S1 areshown in figure 3. The algorithm is implemented in LabVIEW 7.1 software.
2.2
Preprocessing
The first step in the algorithm is to process the signal to enhance the signal components by using a 3-point moving average smoothing filter. The filter is applied forward and backward to eliminate any phase shift produced due to filtering the signal.
2.3
Maxima & minima detection
The second step detects all the peaks and valleys and their locations in the signal. Given the PPG signal time series S(n)={s1,s2,s3…..sN}, the peaks and the valleys are those points that satisfy the following criteria
Peaks , P(n) = S(n): S(n-1)<S(n)>S(n+1) ;
n=1,2,3…N (1)
And Peak locations Lp(i) = n : S(n-1)<S(n)>S(n+1) ;
i=1,2,3…m (2)
Valleys, V(n) = S(n): S(n-1)>S(n)<S(n+1);
n=1,2,3…N (3) And Valley locations Lv(j) = n : S(n-1)>S(n)<S(n+1);
j=1,2,3…m (4) respectively.
Here m = number of peaks = number of valleys
2.4
VPD Processing
In this stage, it is ensured that the processing begins with a valley. The location of first peak and first valley are compared and if the peak comes first, then it is discarded and the signal is taken starting from the valley. This implies that the discarded peak has no corresponding valley.
S(n)= {s1,s2,s3…..sN} is the original signal; n = 1,2,3,………, N
P(i)={p1,p2,p3…pm} is the series of all peaks; i = 1,2,3,………,m
Lp(i)=( lp1, lp2, lp3… lpm) is the series of locations of peaks; i = 1,2,3,………,m
V(j)=(v1,v2,v3…vm) is the time series of all valleys; j = 1,2,3,………,m
Lv(i)=( lv1, lv2, lv3… lvm) is the series of locations of valleys; j = 1,2,3,………,m
VPD(k)=P(k)-V(k); k = 1,2,3,………,m (5) After the calculation of VPDs, the algorithm searches the VPD series for the instances where
VPD(k) < 0.7*{VPD(k-1)+VPD(k)+VPD(k+1)}/3 (6) This is considered as an over detection so, corresponding P(i) and P(i) location, Lp(i) is removed from the candidate series. This VPD processing is repeated until the number of peaks in the two successive iterations remains the same. This eliminates all the dicrotic peaks and peaks due to noise and artifacts.
3.
METHODS & DATA
3.1
Data acquisition and manual
annotation
[image:2.595.87.247.204.333.2]Raw signal, S(n)
Apply 3-point moving average smoothing filter in forward and backward directions
Find all pe aks and valle ys in the signal Peaks, P(i) = S(n): S(n-1)<S(n)>S(n+1) Valle ys, V(j) = S(n): S(n-1)>S(n)<S(n+1)
Find the locations of peaks and valleys
If first peak location < first valley location
Discard the first peak value and peak location
Calculate valley to peak differences (VPD) VPD(n)=P(n)-V(n)
Search VPD(n) for
VPD(n) 0.7*{VPD(n-1)+VPD(n)+VPD(n+1)} / 3 YES
NO
Discard all Peaks and their locations for which VPD(n) satisfies the above condition
Find the total number of peaks
If the number of peaks in two successive iterations is
same
Final True Peaks and True locations
NO
YES
[image:3.595.55.291.65.598.2]
Fig 2: Flow chart of the peak detection algorithm
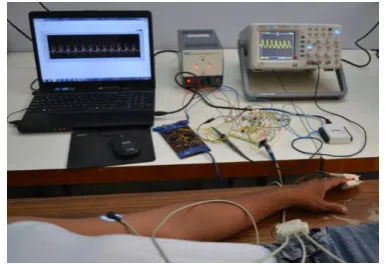
A self designed opto-electronic sensor is placed at the finger phalanx, which passes the red light through the finger and detects the transmitted light. The photoplethysmographic signal is the record of the arterial blood pulsations in the finger produced by the cardiovascular system. The peaks in PPG pulse wave signal represent the peaking of arterial blood after each cycle of blood ejection through left ventricular contraction.
The PPG signals are recorded by using a USB data acquisition card NI USB 6009 of National Instruments, USA on 47 volunteers (20 to 65 years, 30 male and 11 female),some of who are diabetic and also have known cardiovascular problems. The signals are acquired for duration of 5-minutes
with 14-bit resolution and 256 Hz sampling rate. The subjects are allowed to rest 10-minutes before the acquisition and the data is acquired with the subjects in supine position in order to reduce the baseline drift and artifacts. The experimental setup is shown in figure 4. One expert manually annotated all the 47 PPG records by visually identifying each peak using a program written in MATLAB software. A total of 4603 beats (56 minutes data) are randomly selected from the 47 records, by taking 1 or 2 minutes data from each record. The algorithm is applied to these randomly chosen segments without taking into consideration whether they contain portions of artifact.
0 5 10 15
-2 0 2
S1
0 5 10 15
0 2 4
W1
0 5 10 15
0 1 2
W2
0 5 10 15
0 1 2
W3
0 5 10 15
-2 0 2
Time(s)
S2
Fig 3: Different stages while processing a typical signal. S1 is the original signal; W1 gives the locations and amplitudes of all peaks in the signal; W2 is the valley to peak differences of corresponding peaks; W3 is the VPDs after processing; S2 is the original signal with the detected peaks shown corresponding to W3 VPDs
3.2
Performance measures
The Association for the Advancement of Medical Instrumentation (AAMI) proposed guidelines to assess the algorithms performance. They are sensitivity (Se) and positive predictivity (+P). Sensitivity and positive predictivity are defined as
TP Se
TP FN
TP P
TP FP
[image:3.595.321.540.198.451.2]3.3
Validation of Algorithm
Fortunately, the authors Mateo Aboy et.al [4] have provided their validation dataset at http://bsp.pdx.edu to facilitate other developers to validate their beat detection algorithms. The database contains two PPG signals each of 60 minutes duration with expert annotated detections generated by two different experts (DT and JM). The signals are sampled at 125 Hz with a resolution of 8-bits. The dataset includes segments of significant artifact. The algorithm’s performance was first assessed using the expert manual annotations (DT) on 15866 beats, corresponding to two 60 minute records. Secondly, the performance of the algorithm was assessed against the two expert manual annotations (DT and JM) on 2649 beats of randomly selected PPGsignals.
Fig 4: Experimental setup used for acquiring PPG signals
4.
RESULTS
The Se and +P values of the algorithm obtained for the PPG signals recorded by the authors is reported in Table 1. Table 1 also shows the false positives, false negatives and acceptance interval. Acceptance interval is the time interval between a true peak (annotated by an expert) and a detected peak, for which the detected peak can be considered as a true peak. For instance, if the PPG signal is recorded with 256 Hz sampling rate, each sample of the signal is separated by 3 ms. An acceptance interval of 8 ms means that a detected peak can be treated as true peak it is at a distance of ± 2 samples. The values in the Table1 are based on treating the expert manual annotations for all 4603 beats randomly selected from 47 PPG records as true peaks. The Se and +P values were obtained for an acceptance interval of 4 ms (± 1 sample) compared with the expert annotations. Table 2 reports sensitivity and positive predictivity of the detection algorithm for PPG signals of validation database. This Table shows the Se and +P results for acceptance intervals of 8.0, 16.0, 24.0, 32.0, 40.0, and 48.0 ms (corresponding to ± 1 sample to ± 6 samples deviation, as the validation data set is sampled at 125 Hz) compared to expert annotations. These results used the expert manual annotations (DT) on randomly selected 15866 beats as true peaks. The segments considered by expert DT include regions of significant artifact. Table 3 reports the algorithm’s sensitivity and positive predictivity validated against two experts manual annotations of 2649 beats of randomly selected PPGsignals of validation database for acceptance intervals of 16.0 and 24.0 ms. The Table shows the proposed algorithm performance (PA) against two experts (DT and JM) of Mateo Aboy et al paper and the consistency of the proposed algorithm with the M. Aboy et al Algorithm (AD). The average sensitivity of the algorithm is 99.82 (99.58+99.97+99.92)/3; with a positive predictivity of 98.88 (99.15+99.36+98.13)/3, for an acceptance interval of 24 ms (±
3 samples) with the validation dataset (see Table 2 &Table 3). The algorithm showed a Se of 99.89 and +P of 99.95 for an acceptance interval of 4 ms (± 1 sample) with the data acquired by the authors.
Table 1. Sensitivity and positive predictivity of the algorithm for the PPG signals, acquired by the authors. Table shows the Se and +P for acceptance interval (AI) of 4.0 ms and number of false negatives and false positives out of 4603 peaks
AI Se +P FN FP
4 ms 99.89 99.95 5 2
Table 2. Sensitivity and positive predictivity of the peak detection algorithm for PPG signals of validation database (M. Aboy). The table shows the Se and +P results for acceptance intervals of 8.0, 16.0, 24.0, 32.0, 40.0, and 48.0 ms. These results used the expert manual annotations (DT) on randomly selected 15866 beats. The segments included regions of artifact.
8 ms 16 ms 24 ms 32 ms 40 ms 48 ms
Se 85.66 97.12 99.58 99.76 99.79 99.82
+P 84.41 95.71 98.13 98.31 98.34 98.37
Table 3. Algorithm’s sensitivity and positive predictivity validated against two experts manual annotations of 2649 beats of randomly selected PPG signals of validation database for acceptance intervals of 16.0 and 24.0 ms. The table shows the algorithm performance (PA) against two experts (DT and JM) and the consistency of the proposed algorithm with the M. Aboy et al Algorithm (AD).
AI Se +P
PA-DT 16 ms 99.77 98.95
PA-JM 16 ms 99.81 99.25
PA-AD 16ms 99.55 99.21
PA-DT 24 ms 99.97 99.15
PA-JM 24 ms 99.92 99.36
PA-AD 24 ms 99.62 99.29
5.
DISCUSSION
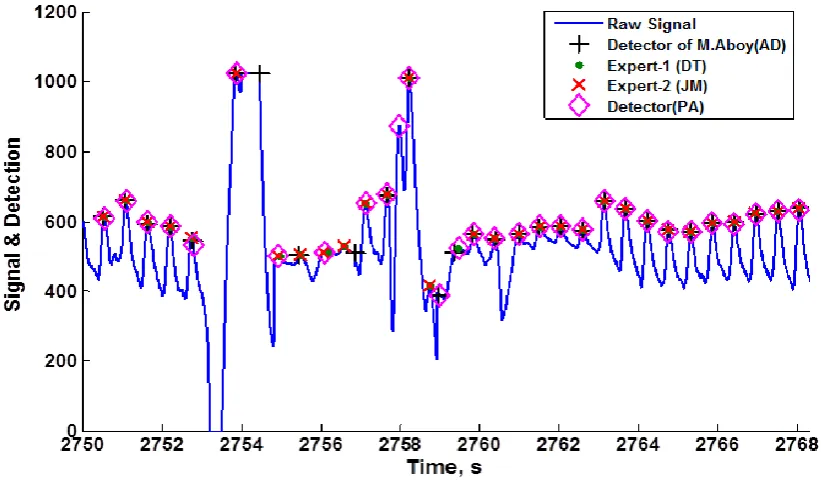
[image:4.595.70.263.231.363.2] [image:4.595.311.548.403.500.2]Fig 5: Example showing a PPG signal of the validation data set and the systolic peak identified b the detection algorithm of M Aboy et al , two experts and the detection algorithm. In this case, the experts and the algorithms labeled different peaks in the
region of artifact
6.
CONCLUSION
In this paper, an automatic beat detection algorithm to detect the systolic peaks of PPG signals is described. This type of algorithms is needed in many clinical and research applications such as pulse rate variability etc. The algorithm uses the relative amplitudes of corresponding systolic and dicrotic waves to distinguish the systolic peaks from the dicrotic peaks. The algorithm detects the systolic peaks from the PPG signal and takes care to eliminate the minor peaks due to dicrotic notches and noise by using an adaptive threshold obtained from the moving average of the wave amplitudes. The algorithm is validated against a publicly available validation dataset and it achieved a sensitivity of 99.82 and a positive predictivity of 98.88 when compared to expert manual annotations. This algorithm is computationally simple and can be implemented in hardware.
7.
ACKNOWLEDGEMENTS
The authors are thankful to M. Aboy et al for making their validation dataset publicly available, which is very much useful for the researchers working in this area.
8.
REFERENCES
[1] Köhler, B.-U., Henning, C., and Orglmeister, R. 2002. The principles of software QRS detection. IEEE Eng. Med. Biol. Mag., 21(1), 42–57.
[2] Aboy, M., McNames, J., Thong,T., Tsunami, D., Ellenby, M.S., Goldstein, B. 2005. An automatic beat detection algorithm for pressure signals. IEEE Trans. on Biomed. Eng., 52 (10), 1662-1670.
[3] Treo, E.F., Herrera, M.C., Valentinuzzi, M.E. 2005. Algorithm for identifying and separating beats from arterial pulse records. Biomedical Engineering online, 4, 48.
[4] Shin, H.S., Lee, C., Lee, M. 2009. Adaptive threshold method for the peak detection of photoplethysmographic waveform. Comp. in Biol. Med., 39, 1145-1152.
[5] Nenova, B., Iliev, I. 2010. An automated algorithm for fast pulse wave detection. Int. J. BIOautomation, 14(3), 203-216.
[6] Caiani, E.G., Turiel, M., Muzzupappa, S., Porta, A., Baselli, G., Cerutti, S., Malliani, A. 2000. Evaluation of respiratory influences on left ventricular function parameters extracted from echocardiographic acoustic quantification. Physiol. Meas., 21, 175–186.
[7] Rienzo, M.D., Castiglioni, P., Mancia, G., Pedotti, A., Parati, G. 2001. Advances in estimating baroreflex function. IEEE Eng. Med. Biol. Mag., 20( 2), 25–32.
[8] Caiani, E.G., Turiel, M., Muzzupappa, S., Porta, A., Colombo, L.P., Baselli, G. 2002. Noninvasive quantification of respiratory modulation on left ventricular size and stroke volume. Physiol. Meas., 23, 567–580.
[9] Hlimonenko, I., Meigas, K., Vahisalu, R. 2003. Waveform analysis of peripheral pulse wave detected in the fingertip with photoplethysmograph. Measurement Science Review, 3(2), 49-52.
[10]Erts, R., Spigulis, J., Kukulis, I., Ozols, M. 2005. Bilateral photoplethysmography studies of leg arterial stenosis. Physiol. Meas., 26, 865-874.
[11]Constant, I., Laude, D., Murat, I., Elghozi, J.L. 1999. Pulse rate variability is not a surrogate for heart rate variability. Clinical Science, 97, 391-397.
[13]Lu, S., Zhao, H., Ju, K., Shin, K., Lee, M., Shelly, K., Chon, K.H. 2008. Can photoplethysmography variability serve as an alternative approach to obtain heart rate variability information?. Journal of clinical monitoring and computing, 22, 23-29.
[14]Gesche, H., Grosskurth, D., Küchler, G., Patzak, A. 2012. Continuous blood pressure measurement by using the pulse transit time: comparison to a cuff based method. Eur. J Appl. Physiol., 112(1), 309-315.
[15]John Allen. 2007. Photoplethysmography and its application in clinical physiological measurement. Physiol. Meas., 28, R1-R39.
[16] Foo, J.Y.A., Wilson S.J., Williams, G., Harris, M.A., Cooper, D. 2005. Pulse transit time as a derived non invasive mean to monitor arterial distensibility changes
in children. Journal of Human Hypertension, 19, 723-729.
[17]Wang, C.H., Lu, C.W., Lin T.Y., Abbod, M.F., Shieh, J.S. 2012. An assessment of pulse transit time for detecting heavy blood loss during surgical operation. Open Biomed. Eng. J, 6, 104-111.