Munich Personal RePEc Archive
Do Freedom of Information Laws
Decrease Corruption?
Tavares, Samia
Rochester Institute of Technology
2 May 2007
Online at
https://mpra.ub.uni-muenchen.de/3560/
Do Freedom of Information Laws Decrease Corruption?
Samia Costa Tavares*
Rochester Institute of Technology
May 2, 2007
It has been argued that greater transparency is needed to reduce corruption. One way of increasing transparency is through the adoption of Freedom of Information (FOI) laws. This paper uses the introduction of FOI laws as a natural experiment to determine their effect on corruption. Using a sample of democratic countries and two different corruption indices, I find that countries that adopted FOI laws saw an increase in corruption. Results are robust throughout different specifications. Moreover, I find that countries with plurality systems potentially
experienced a decrease in corruption following the adoption of FOI legislation. Having a parliamentary system, however, had no impact on the effect of the reform.
Keywords: Corruption; freedom of information; transparency; accountability
JEL classification: D72; D73; H11; K39; K42
* Department of Economics, Rochester Institute of Technology, 92 Lomb Memorial Drive, Rochester, NY
2
1. Introduction
Recently, corruption has become a major preoccupation among economists and
policymakers.1 Previous studies have found that corruption curbs growth and investment (Mauro,
1995), along with the provision of public services (Mauro, 1998), in addition to increasing
inequality (Li et al., 2000). As a result, the World Bank has supported hundreds of anticorruption
efforts developed by its member countries since 1996.2 Furthermore, in 2003, the General
Assembly adopted the United Nations Convention against Corruption, which entered into force
in December 2005, with the purpose of preventing and combating corruption.3 Clearly
understanding the causes of corruption is important in developing ways to prevent it.
A major problem that has allowed corruption to flourish in some countries is lack of
accountability. Lederman et al. (2005), for example, find that greater political accountability, in
the form of democracy and freedom of the press, reduce corruption. But corruption is not a
phenomenon restricted to autocratic countries with a government-controlled press. In fact,
although more democratic countries are less corrupt (see Treisman, 2000), there are still
differences in the levels of corruption among those countries that have democratic systems. This
paper, then, focuses on democratic countries to explore the effect of an increase in
accountability, in the form of greater access to information, on corruption.
Accountability, however, is not enough to curb corruption if citizens are unable to
monitor officials. A free press is then essential to investigate and divulge abuses of power to the
public, thus reducing the cost of obtaining information (see Djankov et al. (2003) and Brunetti
1
A search on Google Scholar for articles on corruption in 2006 yielded 258 articles or books with the word corruption in the title.
2
The World Bank’s Anti-Corruption Section.
3
and Weder (2003), for instance).4 Nevertheless, there is only so much that a free press can do to
observe the activities of politicians if there is no legislation providing citizens the right to access
information. And if information on government behavior cannot be obtained, then elected
officials will not have the threat of being voted out of office due to a misuse of public office as a
deterrent. As a result, whether or not a country has a Freedom of Information (FOI) law can have
an important impact on a country’s level of corruption.
And yet even if the press is unbiased, greater transparency may not necessarily lead to
lower corruption. Bac (2001) argues that greater transparency also leads to better information
about whom to bribe. If the incentive to establish a connection with the relevant official is
greater than the probability of detection, corruption may actually increase. Furthermore, Sutter
(2006) finds that greater media scrutiny my actually decrease the quality of politicians, as it
creates privacy and reputational costs. This means that an FOI law may not necessarily decrease
corruption.
The type of electoral system may also play a role in determining the impact of greater
transparency on corruption. Persson and Tabellini (2003), for instance, find that proportional
representation systems are more prone to corruption than majoritarian systems.5 This is because
in majoritarian systems, voters are choosing among individual candidates, which creates an
incentive for incumbents to perform well. In PR systems, on the other hand, voters are choosing
among party lists, so that a politician’s chance of reelection is based not on performance, but on
his or her rank on the list. Myerson (1993), on the other hand, moves away from this
4 A free press, however, does not mean an unbiased press. A biased press may report on corruption cases involving
one party but not another. See Strömberg (2004), DellaVigna and Kaplan (2006), Besley and Prat (2006), and Larcinese et al. (2006) for details.
5
transparency argument to suggest that plurality systems are more corrupt, since the resulting
barriers to entry allow for corruption profits. In PR systems, on the other hand, competition
drives corruption to zero. Other authors have found support for this barriers-to-entry argument,
though in the context of district magnitude. In particular, Persson and Tabellini (2003), as well as
Persson et al. (2003) find that the lower the district magnitude (defined as the number of seats
per district), the higher is corruption.
The type of executive also affects accountability. Lederman et al. (2005) argue that in
presidential systems, the executive is more independent and hence less subject to accountability
from the other branches of government. Their empirical analysis confirms that parliamentary
systems are in fact associated with lower corruption levels.
Several democratic countries have adopted an FOI law in the past decade, which provides
for a natural experiment to address this issue. However, to my knowledge, no study has
examined the effect of freedom of information laws on corruption. The closest is Islam (2006),
who uses cross-sectional data to explore whether more transparency, in the form of greater
information access, affects governance. She finds that countries with greater transparency,
measured in one case as having FOI legislation, do have lower corruption. This paper, however,
focuses on whether enacting an FOI law reduces corruption, rather than whether countries that
have such legislation have lower corruption. In addition, I explore whether the effect on
corruption takes place during the first five years of the law or only during subsequent years.
Furthermore, because the type of electoral system, as well as the type of executive, seem to be
important determinants of corruption among democratic countries, I also examine whether the
well as between presidential and parliamentary systems. Finally, since I rely on panel data, I am
able to take care of possible spurious correlation through fixed effects.
One of the difficulties in measuring corruption, however, lies in how to distinguish
between corruption and rent-seeking. The World Bank defines corruption as the misuse of public
office for private gain. As Tanzi (1998) points out, corruption can take many forms, and may not
necessarily involve the payment of bribes.6 This paper uses the International Country Risk Guide
(ICRG) corruption index, which has been produced annually since 1982 by Political Risk
Services, a private international investment risk service, as an indicator. This index, which
measures corruption at all levels of government and bureaucracy, is based on the opinion of
experts, and seeks to capture the extent to which “high government officials are likely to demand
special payments” and “illegal payments are generally expected throughout low levels of
government” in the form of “bribes connected with import and export licenses, exchange
controls, tax assessments, police protection, or loans.”7 The sample, which is restricted to
democratic countries, consists of an unbalanced panel8 of up to 70 countries from 1984 to 2005,
34 of which enacted FOI legislation during the period (see Appendix 1). In addition, and as a
robustness check, I also use Transparency International’s corruption perceptions index, which
gives me a sample of up 72 democratic countries from 1995 to 2005, with 21 of them adopting
an FOI law during the period. This allows me to use a difference-in-difference approach to
examine the effects of the legislation on corruption, with the treatment effect being estimated
only from within-country variation around the law. 9
6 It is also difficult distinguishing between a gift and a bribe (Tanzi, 1998). 7http://www.icrgonline.com/page.aspx?page=icrgmethods
8 It is an unbalanced panel because the ICRG index was not available for the entire period for some countries, and
because some countries only came into existence later in the sample period.
9 It should be noted that the concern here is only whether or not a country passed an FOI law, not whether it is
The results, described in section 4, indicate that adopting an FOI law resulted in an
increase in corruption. Countries with plurality systems, however, experienced a decrease in
corruption or at least a smaller increase than those with PR or mixed systems. The effect of the
law on parliamentary systems did not seem to be much different from that in presidential
systems. These results are robust to using different sets of control and treatment groups as a
result of a different dependent variable, restricting the sample to very democratic countries, and
including additional control variables.
The paper is divided as follows. Section 2 provides a description of the data, while
section 3 presents the empirical specification. Section 4 examines the results and subjects them
to a variety of sensitivity tests. The last section concludes.
2. Data
2.1. Corruption
There exists no objective measure of corruption, so since Mauro (1995), a number of
empirical studies have employed various subjective indices that attempt to measure the perceived
levels of corruption in a country. One of these indices is the International Country Risk Guide
(ICRG) corruption index. The ICRG index provides an appraisal of corruption within the
political system. It based on the opinion of experts, and aims to provide potential investors with
an assessment of political risk.
The index varies from 0 to 6, with higher values denoting less corruption. The data are a
simple average of monthly indices, which makes it continuous between 0 and 6. For ease of
interpretation, I reverse the index and rescale it from 0 to 10 so that high values correspond to
higher corruption levels.
One advantage of the ICRG index over other available indices is the fact that it is
available for a long time period and for a large sample of countries. It is also highly correlated to
other indices that have been used in the literature (see Treisman, 2000, for more details), which
suggests that they are consistent despite being a subjective rating. However, as Ades and di Tella
(1999) point out, some of the disadvantages of using such subjective indices include the fact that
the rankings may not be uniform, so that a change from a score of 3 to 4 is different from a
change from 5 to 6. Finally, there have been arguments that such corruption perception indices
are more a measure of institutional quality than actual corruption. Mocan (2004), for instance,
uses the United Nation’s International Crime Victim Survey (ICVS) to construct a measure of
actual corruption. After controlling for institutional quality, he finds that the extent of actual
corruption does not have a significant effect on perceptions of corruption. The ICVS survey,
however, only asks a sample of households whether “any government official asked or expected
a bribe for services.”10 The ICRG index, on the other hand, is more concerned with “actual or
potential corruption in form of excessive patronage, nepotism, job reservations, favor-for-favors,
secret party funding, and suspiciously close ties between politics and business,” in addition to
financial corruption. 11 Clearly the question asked by the ICVS survey does not address these
forms of corruption. Furthermore, given that such indices are used by banks and multinationals
in making investment decisions, they are important in predicting a country’s economic
performance.
10http://www.unicri.it/icvs
As a robustness check, I also experiment with Transparency International’s corruption
perceptions index (CPI).12 The CPI is available starting in 1995 and until 2006, but country
coverage varies by year. This index is a composite of other indices assessing corruption among
public officials and politicians. One problem with the CPI is that year-to-year variations could
result from changes in corruption perception, but also from changes in the sample of surveys
included, as well the methodology used to construct the index. This means that it is difficult to
say whether changes in score reflect changes in real levels of corruption, or the addition of new
data or methodological differences.
The sample of countries included in the analysis, shown in Appendix 1, is restricted to
include only democracies for which I could obtain scores. They include countries that already
had an FOI law, those that adopted one, and those that never adopted one in the 1984-2005
period (in the case where corruption is measured using the ICRG index) or in the 1995-2005
period (when corruption is measured using the CPI).13
2.2. Freedom of Information Act
Information on when countries adopted Freedom of Information laws is taken from
Banisar (2006), who provides a description of the legislation in different countries. From this I
construct an indicator that equals 1 starting on the year a country enacted an FOI law. Some
countries passed an FOI legislation in one year, only to pass another many years later to replace
the previous one. For instance, the Netherlands first adopted an FOI law in 1978, only to replace
it in 1991 with the Government Information (Public Access) Act. The Philippines, for its part,
does not have an FOI Act per se, but it was included in the 1973 Constitution, only to be
12
See http://www.transparency.org
expanded in the 1987 Constitution. In these cases, I take the year of adoption as the first year in
which the country enacted legislation providing citizens the right to information. Appendix 1
lists the different laws and years of adoption.
2.3. Electoral System
The indicators for a country’s electoral system, as well as for whether a country has a
presidential or parliamentary system, are taken from the World Bank’s Database on Political
Institutions (DPI2004), as described by Keefer (2005). The database contains data on the type of
system from 1976 to 2004. The variable PLURALITY takes a value of 1 if legislators are elected
using a winner-take-all or first past the post rule and 0 if it is not. The variable is further coded
NA if “there is no competition for seats in a one-party state or if legislators are appointed” and is
left blank “if it is unclear whether there is competition in a one-party state.” The variable PR, for
its part, has a value of 1 if the country has a proportional representation system, and 0 otherwise,
unless there is only one party, one candidate, the legislature is not elected, or there is no
legislature, in which case the variable takes a value of NA.
From these indicators, I constructed the measure ELECSYS.14
This variable takes a value
of 1 if the country has a plurality system and 0 if it has a PR or mixed system.
In addition, the variable SYSTEM in the DPI2004 dataset distinguishes between direct
presidential systems, strong president elected by assembly, and parliamentary system. From this
14 Because of inconsistencies in the DPI2004 dataset, I changed the index in the following cases, as the electoral rule
I generate the dummy variable PARLIAMENT, which takes a value of 1 if the country has a
parliamentary system and 0 if it is a presidential system.15
2.4. Control
The POLITY2 indicator is taken from the POLITY IV database, which is currently
available up to 2004.16 The variable POLITY2 is a modified version of POLITY, which codes
transition years so as to detect changes in regime. The POLITY variable, for its part, is a measure
of the quality of democratic institutions, and varies from +10 (strongly democratic) to -10
(strongly autocratic). The sample is restricted to solely democratic countries, which are defined
as having a strictly positive POLITY2 score. Still, because the degree of democracy varies from
one country to another, and because the level of democracy can be taken as a proxy for press
freedom,17 I include the POLITY2 index in all regressions as a control.
3. Empirical Specification
3.1. Methodology
The effect of adopting a Freedom of Information (FOI) law is estimated using a
difference-in-difference (DID) approach. In DID estimation, the outcome—in this case, the
perceived level of corruption—is compared between two groups before and after a policy
change—here enacting an FOI law. One group, denoted the “control,” consists of countries that
15 Presidential systems include both direct presidential system and those with a strong president elected by an
assembly. 16
See http://www.cidcm.umd.edu/inscr/polity/index.htm.
17 An indicator for freedom of the press is available from Freedom House. The data are available from 1980-2006.
have not undergone reform. The other group, the “treatment,” in turn includes the countries that
have adopted an FOI law during the period. If the two groups are very similar, then any
difference in outcome can be attributed to the causal effect of the treatment. This means that the
effect of the law on corruption is then estimated from the difference in outcomes for these two
groups (Meyer, 1995). An advantage of DID is that it takes care of all unobserved exogenous
factors that exist before and after reform, as well as unobserved endogenous factors for each
country in the sample if they are fixed before and after the reform in question.
Simply comparing countries that underwent reform with those that did not, however, is
problematic. For example, the set of countries that enacted FOI legislation may have been
structurally different in various ways, such as culture, institutional arrangements, or
constitutional tradition. Furthermore, there could be general trends that affect all countries in a
similar way. If these unobserved heterogeneities are not taken into account, they could bias the
results. Based on previous empirical studies on the causes of corruption, it is plausible to assume
that these omitted effects are fixed in nature, rather than the outcome of a random draw.18
Because the unobservables may contain a cross-sectional as well as a temporal dimension, I
include both country- and year-specific fixed effects in the estimated equation. This means that
identification is obtained out of within group variation.
The estimated equation is of the form
CORRit =!0+!1FOIit+!2Democracyit+"i+#t+$it (1)
where CORR
it is the ICRG or CPI corruption index for country i at time t; FOIit is an indicator
for whether country i adopted an FOI law during time t; Democracyitis the POLITY2 index; "i
18
captures the country-level fixed effects, which are assumed constant over time; "t is the
year-specific fixed effect, which is assumed constant across countries and which allows me to obtain
difference-in-difference estimates; and "it is the unobserved error term.19 The coefficient of
interest is !1,which measures the impact of enacting FOI legislation. Because there could be a
difference in the impact of an FOI law between very democratic countries and those that are not
very democratic, I also experiment with including solely those countries that have a POLITY2
score of 6 or higher.
I further distinguish between the effect of the law during the first five years of adoption
and subsequent years. The equation estimated in that case is
CORRit =!0+!1NEW_FOI_ 5it+!2EST_FOI_ 5it+!3Democracyit+"i+#t+$it (2)
where NEW_FOI_ 5
it equals 1 in the first 5 years of passing an FOI law, and EST_FOI_ 5it
equals 1 after 5 years of adoption. The other variables are as defined above. Here the coefficients
of interest are !1 and !2, with !1+!2 indicating the overall effect of the reform. To allow for
the fact reforms may take longer to have an impact on corruption due to the time lag before
citizens become fully aware of the law, I also estimate, in the case of the ICRG sample, the
equation
CORRit =!0+!1NEW_FOI_10it+!2EST_FOI_10it+!3Democracyit+"i+#t+$it (3)
where NEW_FOI_10it equals 1 in the first 10 years of passing an FOI law, and
EST_FOI_10it equals 1 after 10 years of adoption.20 The other variables are as defined above.
The fourth estimated equation explores whether the electoral system of a country has an
impact on the effect of enacting FOI legislation. In particular,
19
Standard errors are heteroskedasticity-consistent unless otherwise specified. More detailed is provided in the next section.
CORRit =!0+!1FOIit+!2FOIit*ELECSYSit+!3Democracyit+"i+#t+$it (4)
where FOI
it*ELECSYSitdenotes the interaction between the FOI indicator and the type of
electoral system and other variables are as defined above. Here !1 denotes the effect of reform in
PR and mixed systems, while !1+!2 is the effect of the reform in plurality systems. An equation
similar to (2), examining the effect of newly adopting an FOI law versus having an FOI law for
more than 5 years, is also estimated.
Finally, I estimate whether the effect of the law on corruption differs in presidential
versus parliamentary systems. The estimated equation in this case is
CORRit =!0+!1FOIit+!2FOIit*PARLIAMit+!3Democracyit+"i+#t+$it (5)
where FOI
it*PARLIAMitis the interaction between the FOI indicator and an indicator for
whether the country has a parliamentary or presidential system. The coefficient !1 denotes the
effect of reform in presidential systems, while !1+!2 is the effect of the reform in parliamentary
systems. Other variables are as defined above. As in the case of the electoral system, an equation
similar to (2) is also estimated.
Because there could also be factors that evolve over time in different ways across
countries, I also experiment with including the time-varying and country-specific determinants of
corruption that appeared to differ between the treatment and control group according to Table 1
as a robustness check.
Countries are defined as “treated” only if they adopted an FOI law during the period
under consideration. More specifically, “treated” countries are the ones that enacted the
years before the end of the sample.21 This is to allow for the delay between adoption and its
effect on perceptions of corruption.
3.2. Identification
With DID estimation, a crucial identifying assumption is that there is no unobserved
variable affecting corruption that moves systematically over time in different ways between the
groups of countries that underwent reform and those that did not (see Besley and Case, 2000).
This means that the two groups of countries must be similar to each other, so that any omitted
variable that varies across time, such as increased globalization, cannot affect the control and
treated countries differently. In other words, the only difference between the two groups of
countries must be the fact that one of them underwent reform and the other did not.
Another factor that could cause the identifying assumption to be violated is if how
countries are assigned to the treatment or control group is endogenous, so that the decision to
adopt an FOI law is dependent on the level of corruption. This potentially could be the case here.
As Banisar (2006) notes, such laws were often adopted as a result of corruption scandals. But
this was the case mostly in long established democracies. For instance, in the U.S., the FOI Act
only became far-reaching when it was revised in 1974 following Watergate. Similarly, Ireland
passed an FOI law in 1997 as a result of a public outcry over the management of a public blood
bank and the conditions in the meatpacking industry. In newer democracies, however, laws were
adopted due to the demand for more open and democratic governments that resulted from the
collapse of totalitarian governments, as well as the influence of international organizations.
Hungary passed an FOI law in 1992 to make the previous communist regime accountable.
Similarly, as a result of its experience under apartheid, South Africa included in its 1994
constitution a provision guaranteeing the access to government information to its citizens.
Finally, Estonia, Lithania, Latvia, the Czech Republic, Slovakia, Bulgaria, and Bosnia and
Herzegovina, all adopted FOI legislation at the behest of the OECD. (Blanton, 2002).
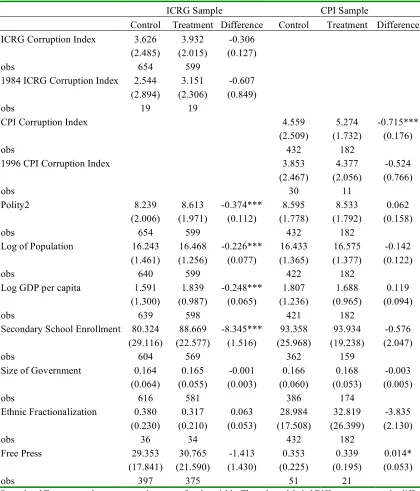
Table 1, then, compares characteristics that have been used to explain corruption levels in
the literature across countries that enacted FOI legislation versus those that did not, using the
ICRG and the CPI samples. These variables are the size of the government, which is measured as
total government expenditures as a fraction of GDP (World Bank’s World Development
Indicators); the log of GDP per capita (World Development Indicators); secondary school
enrollment (World Development Indicators); fuel exports as a percentage of total exports (World
Development Indicators), the log of population (World Development Indicators); ethnic
fractionalization (Alesina et al., 2003); and a freedom of the press indicator (Freedom House).
Tests of means do reveal some statistical difference between the two groups in both the ICRG
and CPI samples, and in particular in the log of population, log of GDP per capita, and secondary
school enrollment, in the case of the ICRG index; and freedom of the press in the case of the
CPI. This means that additional tests must be taken to ensure the casual interpretation of the
results. Furthermore, corruption, as measured by the ICRG index or CPI, differs between the two
groups, but not initial corruption. This suggests that countries with more corruption are no more
likely to adopt FOI laws. To further check the similarity of the groups, Appendix 2 compares the
America,22 the so-called propensity score, for the control and treatment groups. Tests of means
using either the ICRG sample or the CPI sample show no difference between the two groups.23
The fact that the control group includes countries that had an FOI law during the period
under consideration helps ensure that the control and treatment countries are not much different
on average. However, to further address these issues, the robustness of the results is examined in
various ways. Firstly, as mentioned above, I experiment with using a different dependent
variable, Transparency International’s CPI index. Because the coverage varies, both in number
of countries and years available, it allows me to test whether results hold with a different set of
control and treatment countries. Secondly, I include an interaction term between year fixed
effects and time-invariant indices classifying a country according to its region (Asia, Africa,
Latin America). This again would make the different groups of countries more similar.
Finally, I add the time-varying control variables that have been used in the literature to
explain corruption levels, and which were found to differ in some cases across groups. This
further helps ensure that the control and various treatment groups are as similar as possible.
These variables are, again, the log of population, the log of GDP per capita, secondary school
enrollment, and the POLITY2 index. In the case of the CPI sample, I include the POLITY2
index and the freedom of the press indicator. The log of GDP per capita is included as a measure
of economic development. More developed countries have been found to have lower corruption
22 I include only these regions because the most corrupt countries fall in these regions. On average, countries in
Latin America and Caribbean have an ICRG score of 3.3, Africa 2.2, and Asia 2.77. In the meantime the average score for European countries is 1.56 and for North America (which here includes only the U.S. and Canada, since Mexico is classified as part of Latin America) is 0.78.
23
levels (see Treisman, 2000, for instance). As for secondary school enrollment, countries with
lower education levels are predicted to be more corrupt, as less educated people may not have
much understanding of government process (see Rose-Ackerman, 1999). Finally, Ades and
Wacziarg (1997) argue that large countries have smaller ratios of public service outlets per capita
as a result of economies of scale in the provision of public services, so that individuals may
resort to bribes in order to obtain service.24 Fisman and Gatti (2002) also find that corruption is
more widespread in larger countries. Knack and Azfar (2003), on the other hand, find that
sample selection bias drives this result that smaller countries are less corrupt, as most of the
available corruption perception indices include only small countries with good governance.
When more countries are included in the sample, the relationship disappears. They also point out
that due to the breadth of coverage, the ICRG index is less subject to this bias.
A final consideration regards the possible presence of positive serial correlation, which is
common in DID estimation (see Bertrand et al., 2004). Positive serial correlation would not bias
the estimated treatment effect, but it could cause standard errors to be understated. This is of
particular concern in this case, as the corruption measure moves slowly over time. To correct this
problem, I follow Bertrand et al. (2004), and estimate the regressions allowing residuals to be
correlated within each country.
4. Results
Results are presented in Tables 2-10. All regressions include country and year fixed
effects. Furthermore, in all cases, heteroskedastic-consistent standard errors are adjusted by
clustering by country. Tables 2-4 present the results examining the effects of enacting an FOI
law on corruption. Tables 5-7 look at whether the effect of the FOI law varies depending on the
type of electoral system, while Tables 8-10 explore whether FOI laws have different effects on
corruption depending on whether the country has a presidential or parliamentary system.
4.1. FOI Law and Corruption
Tables 2-4 present the results examining the effects of enacting an FOI law on corruption.
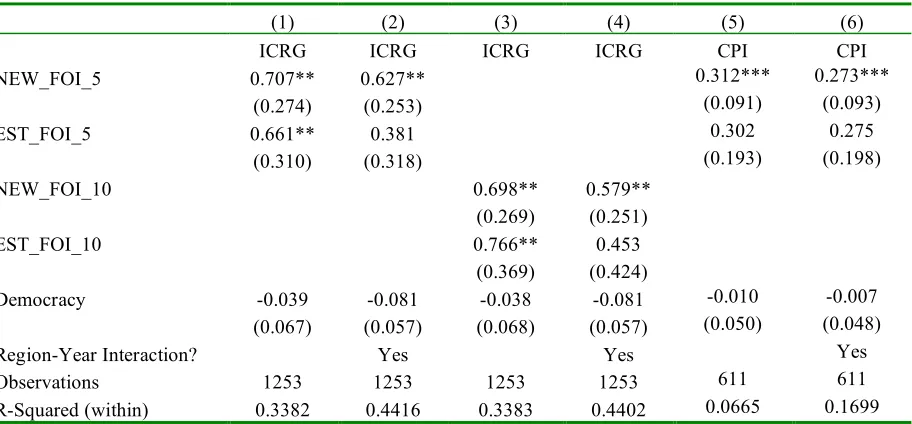
In Table 2, the overall effect of the legislation is estimated; in Table 3, I test whether the impact
of the legislation in the first five years differs from its effect in subsequent years. Table 4
includes further control variables to check for the robustness of the results.
In all cases, it is seen that adopting an FOI law increases corruption. The result is robust
regardless of the dependent variable. In Table 2, enacting such legislation increases corruption,
whereas democracy has mostly an insignificant impact on corruption. The coefficient on FOI
indicates that passing an FOI law increases the ICRG index by about 0.6-0.7 points, and the CPI
index by 0.3 points. Table 3 suggests that this increase in corruption takes place in the first five
years of adoption, as the coefficient on EST_FOI_5, which measures the effect of the law after
the first five years of adoption, is mostly insignificant. Passing such legislation is estimated to
increase the ICRG index by about 0.7 points in the first five years, and the CPI index by 0.3
points. A similar result is found when examining the impact of the reform in the first 10 years
and in subsequent years. In particular, passing an FOI law increases corruption as measured by
the ICRG index by 0.6-0.7 points.
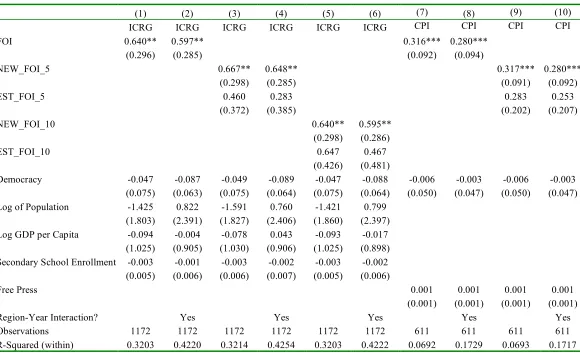
Adding further controls in Table 4 to reduce the differences between the control and
treatment groups does not change the conclusions. In particular, results suggest that passing an
taking place in the first five, as well as the first ten years. The effect of the law on subsequent
years, however, is insignificant, as are all the control variables.
4.2. FOI Law, Electoral System, and Corruption
Tables 5-7 explore whether the impact of an FOI law varies depending on the type of
electoral system. Table 5 presents the baseline results, where the overall effect of the legislation
is estimated, with an additional indicator to capture whether the impact of the law differs if the
country has a plurality system. In Table 6, I test for whether the impact of the reform is in the
first five years only or whether it continues on into subsequent years. Table 7 includes further
control variables to check for the robustness of the results.
Table 5 shows that passing an FOI law increases corruption in PR and mixed systems.
However, the coefficient on FOI*ELECSYS indicates that countries with a plurality system that
enact this type of legislation may actually experience a decline in corruption, or at least a much
smaller increase. The effect of the law in PR and mixed systems is to increase the ICRG index by
0.6-0.8 points and the CPI by 0.3-0.4 points. Plurality systems, however, have a decline of about
0.1 points in the ICRG scale, and an increase of 0.1 points in the CPI. Furthermore, more
democratic countries have lower corruption, as expected, though again only in column 2.
Table 6 suggests that this increase in corruption in PR and mixed systems takes place
mostly in the first five years of adoption, with the effect carrying on to subsequent years. The
conclusions, however, are unchanged. Enacting FOI legislation raises corruption both in the first
five years, as well as in subsequent years, regardless of how corruption is measured. However, in
countries with plurality systems, the effect of the FOI law is to reduce the ICRG index in the first
increase the CPI index by a smaller margin during the first 5 years, only to decrease in
subsequent years.
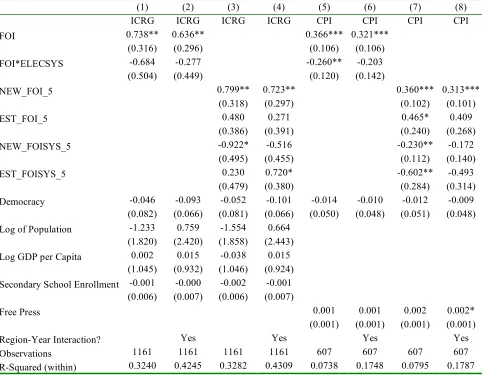
Finally, adding further controls in Table 7 does not alter the conclusions. In particular,
results suggest that passing an FOI law again raises corruption, but potentially lowers it in
countries with plurality systems, or at least results in a smaller increase. When comparing new
versus established reforms in columns 3-4 and 7-8, it is seen that the increase in corruption in PR
and mixed systems takes place both within the first five years and in subsequent years. However,
in countries with plurality systems, new reforms reduce the ICRG index, while increasing the
CPI index, although by less than in PR and mixed systems. Having enacted the law for more than
5 years does reduce the CPI index in plurality systems, as before.
4.3. FOI Law, Parliamentary Systems, and Corruption
Tables 8-10 examine whether having a parliamentary or presidential system affects the
impact of an FOI law on corruption. Table 8 presents the overall effect of the legislation, along
with its impact on parliamentary systems; in Table 9, I test whether the impact of the legislation
in the first five years differs from its effect in subsequent years. Table 10 includes further control
variables to check for the robustness of the results.
According to Table 8, passing an FOI law increases corruption in presidential systems,
regardless of which index is used to measure it. In the case of parliamentary systems, however,
the effect of the legislation is the same, as the coefficient on FOI*PARLIAM is insignificant,
suggesting that the impact of an FOI law on corruption does not differ among presidential and
Table 9 suggests that the impact of the legislation when also taking into account whether
the country had a parliamentary system is mostly insignificant when corruption is measured
using the CPI. When the dependent variable is the ICRG index, however, it is seen that adopting
an FOI law increases corruption in the first five years, followed by a further increase in the
following years. Enacting this legislation in parliamentary systems, however, results in a smaller
increase in corruption in subsequent years.
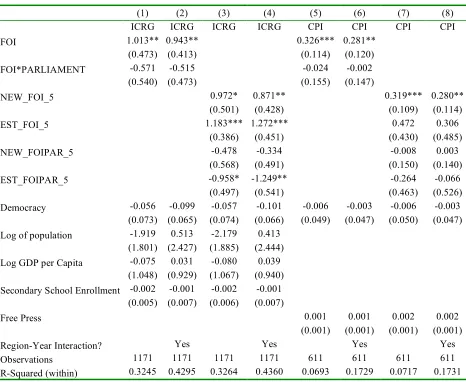
As a further robustness check, Table 10 adds further control variables designed to make
the control and treatment groups more similar. Here it is found that passing an FOI law still
raises corruption. However, parliamentary systems experience a smaller increase in corruption as
measured by the ICRG index.
In sum, these results suggest that adopting an FOI law increases corruption, although
countries with a plurality system are found to potentially experience a decrease in corruption.
Having a parliamentary rather than a presidential system, however, does not change the effect of
the law on corruption.
5. Conclusion
Corruption has recently become an issue of great concern, as it is believed to be a major
obstacle preventing countries from developing. The problem of corruption has always been
linked to a question of accountability. If politicians and other public officials are accountable for
their behavior in office, so that there is a threat of being removed from office if they misbehave,
then they have an incentive not to misuse their office for private gain. A democratic system is
then fundamental in keeping politicians in check. Just as important, however, is transparency. If
A free press helps voters obtain such information. But in order for the press to monitor the
government, it must be able to directly observe its actions. Freedom of Information legislation,
then, serves to allow such access.
This paper used the recent move towards adopting Freedom of Information Acts as a
natural experiment to determine the casual impact of FOI legislation on corruption. Using two
different measures of corruption, which allowed for different control and treatment groups, I
found that countries that adopted an FOI law experienced an increase in corruption, with the
increase taking place mostly in the first 5 years of the legislation. Plurality systems, however,
saw a potential decrease in corruption, whereas there was little difference in the impact between
presidential and parliamentary systems. Results were robust throughout different specifications.
If adopting an FOI law does not decrease, but actually increases corruption, does this
mean, then, that citizens should not be allowed to have access to government information? Not
necessarily. Although the law provides for access to government information, there is still the
problem of actually obtaining it, as disclosure comes at the discretion of the officials in charge of
providing information. For instance, the FOI law in the UK makes no provision for a time limit
in which officials need to consider a request. This has resulted in a backlog of over 1000 cases,
so that it can take more than 12 months before a citizen is able to obtain information. In India,
citizens need to pay a bribe in order to obtain access to government information (Banisar 2006).
Furthermore, it could be that the full impact of these laws will not be known until many years
later, as they are used more often and as the information is passed on to voters. For example, in
Albania, the law is not used very often because neither government officials nor citizens are
aware of its existence (Banisar 2006). However, when distinguishing the effect of new versus
passage of an FOI law. The results of this paper, then, suggest that the potential benefits of FOI
laws are being marred by difficulties in actually obtaining information, which is allowing
corruption to rise. This paper, however, also shows that the type of electoral system does have an
impact on how effective this type of law is on curbing corruption. These effects then should be
6. References
Ades, Alberto and Rafael di Tella. (1999). “Rents, Competition, and Corruption.” American Economic Review, vol. 89 no. 4, pp. 982-93.
Ades, Alberto and Romain Wacziarg. (1997). “Openness, Country Size, and Government.”
Journal of Public Economics, vol. 369 no. 69, pp. 305-21.
Bac, Mehmet. (2001). “Corruption, Connections and Transparency: Does a Better Screen Imply a Better Scene?” Public Choice, 107. 87-96.
Banisar, David. (2006). “Freedom of Information Around the World 2006: A Global Survey of Access to Government Information Laws.” Privacy International.
Bertrand, Marianne, Esther Duflo, and Sendhil Mullainathan. (2004). “How Much Should We Trust Differences-Differences Estimates?” Quarterly Journal of Economics, 119(1), pp. 249-75.
Besley, Timothy and Anne Case. (2000). “Unnatural Experiments? Estimating the Incidence of Endogenous Policies.” Economic Journal, vol. 110, pp. F672-94.
Besley, Timothy and Andrea Prat. (2006). “Handcufs for the Grabbing Hand? Media Capture
and Government Accountability.” American Economic Review, vol. 96, pp. 720-736.
Blanton, Thomas. (2002). “The World’s Right to Know.” Foreign Policy, 131, 50-58.
Brunetti, Aymo and Beatrice Weder. (2003). “A Free Press is Bad News for Corruption.”
Journal of Public Economics, vol. 87, pp. 1801-1824,
DellaVigna, Stefano and Ethan Kaplan. (2006). “The Fox News Effect: Media Bias and Voting.” NBER Working Paper 12169.
Djankov, Simeon, Caralee McLiesh, Tatiana Nenova, and Andrei Shleifer. (2003). “Who Owns the Media?” Journal of Law and Economics, vol. 46, pp. 341-381.
Fisman, Raymond and Roberta Gatti. (2002). “Decentralization and Corruption: Evidence Across Countries.” Journal of Public Economics, vol. 83, pp. 325–345
Graeff, P. and G. Mehlkop. (2003). “The Impact of Economic Freedom on Corruption: Different Patterns for Rich and Poor Countries.” European Journal of Political Economy, vol. 19, pp. 605-20.
Islam, Roumeen. (2006). “Does More Transparency go along with Better Governance?”
Economics and Politics, vol. 18 no. 2, pp. 121-167.
Jain, Arvind K. (2001). “Corruption: A Review.” Journal of Economic Surveys, vol. 15 no. 1.
Keefer, Philip. (2005). “DPI2004 Database of Political Institutions: Changes and Variable Definitions.” World Bank.
Knack, Stephen and Omar Azfar. (2003) “Trade Intensity, Country Size, and Corruption.”
Economics of Governance, vol. 4, pp. 1-18.
Kunicova, Jana and Susan Rose-Ackerman. (2005). “Electoral Rules and Constitutional
Larcinese, Valentino, Riccardo Puglisi and James M. Snyder, Jr. (2006). “Partisan Bias in Economic News: Evidence on the Agenda-Setting Behavior of U.S. Newspapers.”
Lederman, Daniel, Norman Loayza, and Rodrigo Reis Soares. (2005). “Accountability and Corruption: Political Institutions Matter.” Economics and Politics, vol. 17 no. 1, pp. 1-35.
Li, Hongyi, Lixin Colin Xu, Heng-fu Zou. (2000). “Corruption, Income Distribution, and Growth.” Economics and Politics, vol. 12, pp. 155–182.
Mauro, Paolo. (1995). “Corruption and Growth.” Quarterly Journal of Economics, vol. 110, pp. 681-712.
Mauro, Paolo. (1998). “Corruption and the Composition of Government Expenditures.” Journal
of Public Economics, vol. 69, pp. 263-279.
Meyer, Bruce D. (1995). “Natural and Quasi-Experiments in Economics.” Journal of Business & Economic Statistics, vol. 13 no. 2.
Mocan, Naci. (2004). “What Determines Corruption? International Evidence from Micro Data.” NBER Working Paper 10460.
Myerson, Roger. (1993). “Effectiveness of Electoral Systems for Reducing Government
Consumption.” Games and Economic Behavior, vol. 5, pp. 118-32.
Persson, Torsten, Tabellini, Guido and Francesco Trebbi. (2003). “Electoral Rules and Corruption,” European Economic Review, vol. 1, pp. 958-89.
Persson, Torsten and Guido Tabellini. (2003). Economic Effects of Constitutions. Cambridge: MIT Press.
Persson, Torsten and Guido Tabellini. (2004). “Constitutions and Economic Policy.” Journal of Economic Perspectives, vol 18, pp. 75–98.
Rose-Ackerman, Susan. (1999). Corruption and Government. Cambridge: Cambridge University
Press.
Strömberg, David. (2004). “Mass Media Competition, Political Competition, and Public Policy.”
Review of Economic Studies, vol. 71, pp. 265-284.
Sutter, Daniel. (2006). “Media Scrutiny and the Quality of Public Officials.” Public Choice, 129, pp. 25-40.
Tanzi, Vito. (1998). “Corruption Around the World: Causes, Consequences, Scope, and Cures.”
IMF Staff Papers, vol. 45 no. 4, pp. 559-94.
Table 1: Characteristics of Control and Treatment Groups
ICRG Sample CPI Sample
Control Treatment Difference Control Treatment Difference
ICRG Corruption Index 3.626 3.932 -0.306
(2.485) (2.015) (0.127)
obs 654 599
1984 ICRG Corruption Index 2.544 3.151 -0.607
(2.894) (2.306) (0.849)
obs 19 19
CPI Corruption Index 4.559 5.274 -0.715***
(2.509) (1.732) (0.176)
obs 432 182
1996 CPI Corruption Index 3.853 4.377 -0.524
(2.467) (2.056) (0.766)
obs 30 11
Polity2 8.239 8.613 -0.374*** 8.595 8.533 0.062
(2.006) (1.971) (0.112) (1.778) (1.792) (0.158)
obs 654 599 432 182
Log of Population 16.243 16.468 -0.226*** 16.433 16.575 -0.142
(1.461) (1.256) (0.077) (1.365) (1.377) (0.122)
obs 640 599 422 182
Log GDP per capita 1.591 1.839 -0.248*** 1.807 1.688 0.119
(1.300) (0.987) (0.065) (1.236) (0.965) (0.094)
obs 639 598 421 182
Secondary School Enrollment 80.324 88.669 -8.345*** 93.358 93.934 -0.576
(29.116) (22.577) (1.516) (25.968) (19.238) (2.047)
obs 604 569 362 159
Size of Government 0.164 0.165 -0.001 0.166 0.168 -0.003
(0.064) (0.055) (0.003) (0.060) (0.053) (0.005)
obs 616 581 386 174
Ethnic Fractionalization 0.380 0.317 0.063 28.984 32.819 -3.835
(0.230) (0.210) (0.053) (17.508) (26.399) (2.130)
obs 36 34 432 182
Free Press 29.353 30.765 -1.413 0.353 0.339 0.014*
(17.841) (21.590) (1.430) (0.225) (0.195) (0.053)
obs 397 375 51 21
Table 2: Effects of Adopting an FOI Law on Corruption
(1) (2) (3) (4) (5) (6) (7) (8)
ICRG ICRG ICRG ICRG CPI CPI CPI CPI
FOI 0.697** 0.580** 0.659** 0.512* 0.312*** 0.273*** 0.350*** 0.313***
(0.268) (0.251) (0.280) (0.266) (0.092) (0.094) (0.092) (0.093)
Democracy -0.039 -0.080 -0.064 -0.118 -0.010 -0.007 -0.126*** -0.084*
(0.068) (0.057) (0.107) (0.099) (0.050) (0.048) (0.038) (0.046)
Region-Year Interaction? Yes Yes Yes Yes
Observations 1253 1253 1136 1136 611 611 579 579
R-squared (within) 0.3382 0.4399 0.3384 0.4378 0.0665 0.1699 0.0930 0.1965
Note: Heteroskedastic-consistent standard errors, clustered by country, are in parenthesis. * significant at 10%; ** significant at 5%; *** significant at 1%. All regressions include country and time fixed effects. Region-Year Interaction refers to the interaction between the year fixed effects and dummy variables for Asia, Africa, and Latin America. In columns 1-4, the dependent variable is the ICRG corruption perception index. In columns 5-8, the dependent variable is Transparency
International’s corruption perception index. In columns 1-2 and 5-6, the sample includes all countries with a positive POLITY2 score; in columns 3-4 and 7-8, only those countries that scored in the 6-10 range of the POLITY2 scale are included. The FOI dummy equals 1 if country adopted an FOI law. Democracy refers to the POLITY2 index. Regressions where the CPI is the dependent variable are weighted by the inverse of the variance associated with the index.
Table 3: Effects of New versus Established FOI Law on Corruption
(1) (2) (3) (4) (5) (6)
ICRG ICRG ICRG ICRG CPI CPI
NEW_FOI_5 0.707** 0.627** 0.312*** 0.273***
(0.274) (0.253) (0.091) (0.093)
EST_FOI_5 0.661** 0.381 0.302 0.275
(0.310) (0.318) (0.193) (0.198)
NEW_FOI_10 0.698** 0.579**
(0.269) (0.251)
EST_FOI_10 0.766** 0.453
(0.369) (0.424)
Democracy -0.039 -0.081 -0.038 -0.081 -0.010 -0.007
(0.067) (0.057) (0.068) (0.057) (0.050) (0.048)
Region-Year Interaction? Yes Yes Yes
Observations 1253 1253 1253 1253 611 611
R-Squared (within) 0.3382 0.4416 0.3383 0.4402 0.0665 0.1699
[image:28.612.80.536.365.577.2]Table 4: Robustness Check, Effects of Adopting FOI Law on Corruption
(1) (2) (3) (4) (5) (6) (7) (8) (9) (10)
ICRG ICRG ICRG ICRG ICRG ICRG CPI CPI CPI CPI
FOI 0.640** 0.597** 0.316*** 0.280***
(0.296) (0.285) (0.092) (0.094)
NEW_FOI_5 0.667** 0.648** 0.317*** 0.280***
(0.298) (0.285) (0.091) (0.092)
EST_FOI_5 0.460 0.283 0.283 0.253
(0.372) (0.385) (0.202) (0.207)
NEW_FOI_10 0.640** 0.595**
(0.298) (0.286)
EST_FOI_10 0.647 0.467
(0.426) (0.481)
Democracy -0.047 -0.087 -0.049 -0.089 -0.047 -0.088 -0.006 -0.003 -0.006 -0.003
(0.075) (0.063) (0.075) (0.064) (0.075) (0.064) (0.050) (0.047) (0.050) (0.047)
Log of Population -1.425 0.822 -1.591 0.760 -1.421 0.799
(1.803) (2.391) (1.827) (2.406) (1.860) (2.397)
Log GDP per Capita -0.094 -0.004 -0.078 0.043 -0.093 -0.017
(1.025) (0.905) (1.030) (0.906) (1.025) (0.898)
Secondary School Enrollment -0.003 -0.001 -0.003 -0.002 -0.003 -0.002
(0.005) (0.006) (0.006) (0.007) (0.005) (0.006)
Free Press 0.001 0.001 0.001 0.001
(0.001) (0.001) (0.001) (0.001)
Region-Year Interaction? Yes Yes Yes Yes Yes
Observations 1172 1172 1172 1172 1172 1172 611 611 611 611
R-Squared (within) 0.3203 0.4220 0.3214 0.4254 0.3203 0.4222 0.0692 0.1729 0.0693 0.1717
Table 5: Effect of Adopting FOI Law on Corruption, Distinguishing Electoral System
(1) (2) (3) (4) (5) (6) (7) (8)
ICRG ICRG ICRG ICRG CPI CPI CPI CPI
FOI 0.789*** 0.630** 0.804** 0.638** 0.362*** 0.313*** 0.414*** 0.359***
(0.292) (0.273) (0.304) (0.290) (0.106) (0.106) (0.103) (0.102)
FOI*ELECSYS -0.696 -0.330 -0.902** -0.712** -0.256** -0.196 -0.302** -0.216
(0.455) (0.401) (0.353) (0.312) (0.121) (0.142) (0.114) (0.148)
Democracy -0.040 -0.088 -0.098 -0.150 -0.018 -0.014 -0.142*** -0.102**
(0.075) (0.060) (0.105) (0.096) (0.051) (0.048) (0.036) (0.044)
Region-Year Interaction? Yes Yes Yes Yes
Observations 1238 1238 1126 1126 607 607 575 575
R-Squared (within) 0.3455 0.4450 0.3478 0.4453 0.0719 0.1725 0.1043 0.2023
Note: Heteroskedastic-consistent standard errors, clustered by country, are in parenthesis. * significant at 10%; ** significant at 5%; *** significant at 1%. All regressions include country and time fixed effects. Region-Year Interaction refers to the interaction between the year fixed effects and dummy variables for Asia, Africa, and Latin America. In columns 1-4, the dependent variable is the ICRG corruption perception index. In columns 5-8, the dependent variable is Transparency
International’s corruption perception index. FOI dummy equals 1 if country adopted an FOI law. FOI*ELECSYS equals 1 if the country adopted an FOI law and had a plurality system. In columns 1-2 and 5-6, the sample includes all countries with a positive POLITY2 score; in columns 3-4 and 7-8, only those countries that scored in the 6-10 range of the POLITY2 scale are included. Democracy refers to the POLITY2 index. Regressions where the CPI is the dependent variable are weighted by the inverse of the variance associated with the index.
Table 6: Effect of New versus Established FOI Law on Corruption, Distinguishing Electoral System
(1) (2) (3) (4) (5) (6) (7) (8)
ICRG ICRG ICRG ICRG CPI CPI CPI CPI
NEW_FOI_5 0.830*** 0.708** 0.832** 0.704** 0.354*** 0.305*** 0.406*** 0.352***
(0.301) (0.277) (0.315) (0.297) (0.103) (0.102) (0.099) (0.096)
EST_FOI_5 0.685** 0.377 0.731** 0.426 0.456* 0.403 0.508** 0.437
(0.323) (0.333) (0.337) (0.345) (0.241) (0.267) (0.248) (0.270)
NEW_FOISYS_5 -0.886* -0.559 -1.023** -0.882** -0.231** -0.173 -0.277** -0.190
(0.452) (0.402) (0.386) (0.365) (0.115) (0.142) (0.107) (0.147)
EST_FOISYS_5 -0.087 0.404 -0.456 -0.146 -0.522** -0.417 -0.567** -0.447
(0.435) (0.438) (0.331) (0.364) (0.260) (0.296) (0.266) (0.305)
Democracy -0.045 -0.094 -0.100 -0.154 -0.017 -0.013 -0.143*** -0.103**
(0.074) (0.059) (0.105) (0.096) (0.051) (0.048) (0.036) (0.044)
Region-Year Interaction? Yes Yes Yes Yes
Observations 1238 1238 1126 1126 607 607 575 575
R-Squared (within) 0.3472 0.4489 0.3488 0.4481 0.0755 0.1748 0.1081 0.2050
[image:30.612.78.538.395.605.2]Table 7: Robustness Check, Effect of Adopting FOI Law on Corruption, Distinguishing Electoral System
(1) (2) (3) (4) (5) (6) (7) (8)
ICRG ICRG ICRG ICRG CPI CPI CPI CPI
FOI 0.738** 0.636** 0.366*** 0.321***
(0.316) (0.296) (0.106) (0.106)
FOI*ELECSYS -0.684 -0.277 -0.260** -0.203
(0.504) (0.449) (0.120) (0.142)
NEW_FOI_5 0.799** 0.723** 0.360*** 0.313***
(0.318) (0.297) (0.102) (0.101)
EST_FOI_5 0.480 0.271 0.465* 0.409
(0.386) (0.391) (0.240) (0.268)
NEW_FOISYS_5 -0.922* -0.516 -0.230** -0.172
(0.495) (0.455) (0.112) (0.140)
EST_FOISYS_5 0.230 0.720* -0.602** -0.493
(0.479) (0.380) (0.284) (0.314)
Democracy -0.046 -0.093 -0.052 -0.101 -0.014 -0.010 -0.012 -0.009
(0.082) (0.066) (0.081) (0.066) (0.050) (0.048) (0.051) (0.048)
Log of Population -1.233 0.759 -1.554 0.664
(1.820) (2.420) (1.858) (2.443)
Log GDP per Capita 0.002 0.015 -0.038 0.015
(1.045) (0.932) (1.046) (0.924) Secondary School Enrollment -0.001 -0.000 -0.002 -0.001 (0.006) (0.007) (0.006) (0.007)
Free Press 0.001 0.001 0.002 0.002*
(0.001) (0.001) (0.001) (0.001)
Region-Year Interaction? Yes Yes Yes Yes
Observations 1161 1161 1161 1161 607 607 607 607
R-Squared (within) 0.3240 0.4245 0.3282 0.4309 0.0738 0.1748 0.0795 0.1787
Table 8: Effect of Adopting FOI Law,
Distinguishing Parliamentary vs. Presidential System
(1) (2) (3) (4) (5) (6) (7) (8)
ICRG ICRG ICRG ICRG CPI CPI CPI CPI
FOI 0.956** 0.917** 0.967** 0.985** 0.321*** 0.272** 0.375*** 0.322***
(0.461) (0.402) (0.447) (0.417) (0.114) (0.120) (0.110) (0.117)
FOI*PARLIAMENT -0.383 -0.500 -0.451 -0.682 -0.023 0.004 -0.058 -0.022
(0.510) (0.442) (0.485) (0.462) (0.155) (0.148) (0.149) (0.146)
Democracy -0.049 -0.094 -0.103 -0.171* -0.010 -0.007 -0.128*** -0.085*
(0.064) (0.060) (0.105) (0.093) (0.050) (0.047) (0.037) (0.046)
Region-Year Interaction? Yes Yes Yes Yes
Observations 1248 1248 1131 1131 611 611 579 579
R-Squared (within) 0.3428 0.4489 0.3444 0.4508 0.0666 0.1699 0.0936 0.1966
Note: Heteroskedastic-consistent standard errors, clustered by country, are in parenthesis. * significant at 10%; ** significant at 5%; *** significant at 1%. All regressions include country and time fixed effects. Region-Year Interaction refers to the interaction between the year fixed effects and dummy variables for Asia, Africa, and Latin America. In columns 1-4, the dependent variable is the ICRG corruption perception index. In columns 5-8, the dependent variable is Transparency
International’s corruption perception index. FOI dummy equals 1 if country adopted an FOI law; FOI*PARLIAMENT equals 1 if country adopted an FOI law and the country had a parliamentary system. In columns 1-2 and 5-6, the sample includes all countries with a positive POLITY2 score; in columns 3-4 and 7-8, only those countries that scored in the 6-10 range of the POLITY2 scale are included. Democracy refers to the POLITY2 index. Regressions where the CPI is the dependent variable are weighted by the inverse of the variance associated with the index.
Table 9: Effect of New versus Established FOI Law, Distinguishing Parliamentary vs. Presidential System
(1) (2) (3) (4) (5) (6) (7) (8)
ICRG ICRG ICRG ICRG CPI CPI CPI CPI
NEW_FOI 0.899* 0.837** 0.909* 0.893** 0.315*** 0.271** 0.368*** 0.321***
(0.482) (0.413) (0.471) (0.430) (0.109) (0.115) (0.102) (0.108)
EST_FOI 1.247*** 1.306*** 1.292*** 1.475*** 0.465 0.299 0.517 0.333
(0.375) (0.395) (0.337) (0.368) (0.430) (0.484) (0.444) (0.490)
NEW_FOIPAR -0.288 -0.312 -0.368 -0.489 -0.011 0.005 -0.046 -0.019
(0.542) (0.457) (0.526) (0.485) (0.150) (0.141) (0.142) (0.136)
EST_FOIPAR -0.743* -1.186** -0.808** -1.422*** -0.229 -0.030 -0.258 -0.048
(0.412) (0.464) (0.351) (0.436) (0.456) (0.519) (0.468) (0.527)
Democracy -0.050 -0.095 -0.105 -0.174* -0.010 -0.007 -0.128*** -0.086*
(0.064) (0.061) (0.105) (0.091) (0.050) (0.047) (0.037) (0.046)
Region-Year Interaction? Yes Yes Yes Yes
Observations 1248 1248 1131 1131 611 611 579 579
R-Squared (within) 0.3439 0.4538 0.3456 0.4560 0.0683 0.1699 0.0952 0.1966
[image:32.612.77.540.386.600.2]Table 10: Robustness Check, Effect of Adopting FOI Law,
Distinguishing Parliamentary vs. Presidential System
(1) (2) (3) (4) (5) (6) (7) (8)
ICRG ICRG ICRG ICRG CPI CPI CPI CPI
FOI 1.013** 0.943** 0.326*** 0.281**
(0.473) (0.413) (0.114) (0.120)
FOI*PARLIAMENT -0.571 -0.515 -0.024 -0.002
(0.540) (0.473) (0.155) (0.147)
NEW_FOI_5 0.972* 0.871** 0.319*** 0.280**
(0.501) (0.428) (0.109) (0.114)
EST_FOI_5 1.183*** 1.272*** 0.472 0.306
(0.386) (0.451) (0.430) (0.485)
NEW_FOIPAR_5 -0.478 -0.334 -0.008 0.003
(0.568) (0.491) (0.150) (0.140)
EST_FOIPAR_5 -0.958* -1.249** -0.264 -0.066
(0.497) (0.541) (0.463) (0.526)
Democracy -0.056 -0.099 -0.057 -0.101 -0.006 -0.003 -0.006 -0.003
(0.073) (0.065) (0.074) (0.066) (0.049) (0.047) (0.050) (0.047)
Log of population -1.919 0.513 -2.179 0.413
(1.801) (2.427) (1.885) (2.444)
Log GDP per Capita -0.075 0.031 -0.080 0.039
(1.048) (0.929) (1.067) (0.940) Secondary School Enrollment -0.002 -0.001 -0.002 -0.001
(0.005) (0.007) (0.006) (0.007)
Free Press 0.001 0.001 0.002 0.002
(0.001) (0.001) (0.001) (0.001)
Region-Year Interaction? Yes Yes Yes Yes
Observations 1171 1171 1171 1171 611 611 611 611
R-Squared (within) 0.3245 0.4295 0.3264 0.4360 0.0693 0.1729 0.0717 0.1731
Note: Heteroskedastic-consistent standard errors, clustered by country, are in parenthesis. Dependent variable is the ICRG corruption perception index. * significant at 10%; ** significant at 5%; *** significant at 1%. All regressions include country and time fixed effects. Region-Year Interaction refers to the interaction between the year fixed effects and dummy variables for Asia, Africa, and Latin America. In columns 1-4, the dependent variable is the ICRG index; in columns 5-8, it is the CPI index. FOI dummy equals 1 if country adopted an FOI law; FOI*PARLIAMENT equals 1 if country adopted FOI law and had a
Appendix 1: Control and Treated Countries, ICRG Index and CPI Index
Control Countries—ICRG Indes
Australia Dominican Republic Indonesia Paraguay United States*
Bolivia Ecuador Iran Philippines* Uruguay
Botswana El Salvador Latvia Russian Federation Venezuela
Brazil Finland Malaysia Sri Lanka Yugoslavia
Canada* France* Namibia Sweden*
Chile Germany Netherlands* Switzerland
Costa Rica Guyana New Zealand* Taiwan
Cyprus Honduras Norway* Ukraine*
Treated Countries Year Law
Albania 1999 The Law on the Right to Information for Official Documents
Argentina 2003 Access to Public Information Regulation
Armenia 2003 Law on Freedom of Information
Austria 1987 Federal Law on the Duty to Furnish Information 1
Belgium 1994 Law on the right of access to administrative documents held by federal public authorities
Bulgaria 2000 Access to Public Information Act
Colombia 1985 Law Ordering the Publicity of Official Acts and Documents
Croatia 2003 Act on the Right of Access to Information
Czech Republic 1999 Law on Free Access to Information
Denmark 1985 Access to Public Administration Files Act
Estonia 2001 Public Information Act
Greece 1999 Code of Administrative Procedure 1999
Hungary 1992 Protection of Personal Data and Disclosure of Data of Public Interest
Ireland 1997 Freedom of Information Act
Israel 1998 Freedom of Information Law
Italy 1990 No. 241 of 7 August 1990
Jamaica 2002 Access to Information Act
Japan 1999 Law Concerning Access to Information Held by Administrative Organs
Korea, Rep. 1996 Act on Disclosure of Information by Public Agencies
Lithuania 2000 Law on the Right to Obtain Information from State and Local Government Institutions
Mexico 2002 Federal Law of Transparency and Access to Public Government Information
Panama 2001 The Law on Transparency in Public Administration
Peru 2003 The Law of Transparency and Access to Public Information
Poland 2001 Law on Access to Public Information
Portugal 1993 Law of Access to Administrative Documents
Romania 2001 Law Regarding Free Access to Information of Public Interest
Slovak Republic 2000 Act on Free Access to Information
Slovenia 2003 Access to Public Information Act
Spain 1992 Law on Rules for Public Administration
Thailand 1997 Official Information Act
Trinidad and Tobago 1999 Freedom of Information Act
Turkey 2003 Law on the Right to Information
United Kingdom 2000 Freedom of Information Act
Control—CPI Index
Albania* Ecuador Latvia* Russian Federation
Australia* El Salvador Macedonia Spain*
Austria* Finland* Malaysia Sri Lanka
Belgium* France* Mauritius Sweden*
Bolivia Georgia* Namibia Switzerland
Botswana Germany Netherlands* Taiwan
Brazil Greece* New Zealand* Trinidad and Tobago*
Canada* Guatemala Norway* Ukraine
Chile Honduras Panama United States*
Colombia* Hungary* Paraguay Uruguay
Costa Rica Indonesia Philippines* Venezuela
Denmark* Italy Portugal* Yugoslavia
Dominican Republic
Treated Year Law
Argentina 2003 Access to Public Information Regulation
Armenia 2003 Law on Freedom of Information
Bulgaria 2000 Access to Public Information Act
Croatia 2003 Act on the Right of Access to Information Czech Republic 1999 Law on Free Access to Information
Estonia 2001 Public Information Act
Ireland 1997 Freedom of Information Act
Israel 1998 Freedom of Information Law
Jamaica 2002 Access to Information Act
Japan 1999 Law Concerning Access to Information Held by Administrative Organs
Lithuania 2000
Law on the Right to Obtain Information from State and Local Government Institutions
Mexico 2002 Federal Law of Transparency and Access to Public Government Information Peru 2003 The Law of Transparency and Access to Public Information
Poland 2001 Law on Access to Public Information
Romania 2001 Law Regarding Free Access to Information of Public Interest Slovak Republic 2000 Act on Free Access to Information
Slovenia 2003 Access to Public Information Act South Africa 2000 Promotion of Access to Information Act
Thailand 1997 Official Information Act
Turkey 2003 Law on the Right to Information
Appendix 2: Comparing Estimated Probability of Adopting FOI Law Control Treatment Difference
ICRG 0.469 0.503 -0.034 (0.095) (0.089) (0.022)
36 34
CPI 0.276 0.289 -0.013 (0.053) (0.048) (0.013)
54 21