http://dx.doi.org/10.4236/jep.2016.71003
How to cite this paper: Herron, S.L., Sharpley, A.N., Brye, K.R., Miller, D.M., Watkins, S., McCreery, D. and Daniels, M.B. (2016) Determination of Nutrient Concentrations in Simulated Rainfall-Runoff from Poultry House Dust Deposited Adjacent to Exhaust Fans. Journal of Environmental Protection, 7, 27-40. http://dx.doi.org/10.4236/jep.2016.71003
Determination of Nutrient Concentrations
in Simulated Rainfall-Runoff from Poultry
House Dust Deposited Adjacent to Exhaust
Fans
Sheri L. Herron1, Andrew N. Sharpley1*, Kristofor R. Brye1, David M. Miller1,
Susan Watkins2, David McCreery3, Mike B. Daniels4
1Department of Crop, Soil, and Environmental Sciences, University of Arkansas, Fayetteville, AR, USA 2Center of Excellence for Poultry Science, University of Arkansas, Fayetteville, AR, USA
3Pilgrim’s Pride, Gainesville, GA, USA
4Department of Crop, Soil, and Environmental Sciences, South University Ave., Little Rock, AR, USA
Received 16 November 2015; accepted 4 January 2016; published 7 January 2016
Copyright © 2016 by authors and Scientific Research Publishing Inc.
This work is licensed under the Creative Commons Attribution International License (CC BY). http://creativecommons.org/licenses/by/4.0/
Abstract
Until recently, little attention has been given to the loss of nutrients that may occur in stormwater runoff from poultry houses. Dust emitted from poultry house fans and deposited near the fans has been shown to contain similar amounts of phosphorus (P) and nitrogen (N) as in poultry litter, thus, there is need for information on the potential of runoff to transport deposited dust off-site. The objectives of this study are to quantify P and N in simulated rainfall-runoff from sites imme-diately adjacent to fans (sidewall and tunnel) from a commercial poultry house in northwest Ar-kansas. Runoff from fan plots range in total P (TP) and total N (TN) concentration from 1.0 to 26.0 mg∙L−1 and from 5.1 to 189 mg∙L−1. The concentration of P and N in runoff from plots adjacent to
sidewall fans is significantly lower (P < 0.05) during warmer (June to August; 1 and 2 mg∙L−1 for TP
and TN, respectively) than cooler months (November through March; 3 and 7 mg∙L−1 for TP and TN,
respectively). In contrast, TP and TN concentrations of runoff from tunnel fan plots are signifi-cantly greater (P < 0.05) during warm (14 and 170 mg∙L−1, respectively) than cool months (5 and
60 mg∙L−1, respectively). The results of this research indicate that conservation practices are
needed around poultry production houses to minimize the potential for runoff of nutrients in emitted dust entering nearby surface waters.
Keywords
Broiler House Dust, Broiler Litter, Nutrient Runoff, Surface Water Quality
1. Introduction
In 1996, over half of surveyed waters in the U.S. were nutrient impaired [1]. Nearly 20 years later, nutrient enrichment remains a major impairment to designated uses of fresh and coastal waters of the U.S. [2] [3], which have led to major initiatives to reduce nutrient losses from major watersheds, such as the Chesapeake Bay Wa-tershed [4] and Mississippi River Basin [5]. As nonpoint sources are far more difficult to quantify and control, the contribution of excess nutrients to surface waters from agriculture, in particular intensive livestock and crop production, has received increased attention [6].
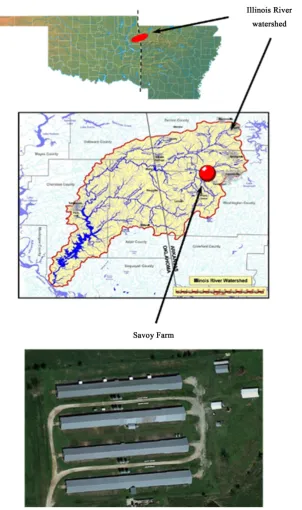
The U.S. Environmental Protection Agency (USEPA) recently focuses on the potential for dust and feathers exhausted fans from poultry broiler houses to be a nonpoint source of nutrients to nearby surface waters [7]. With the backdrop of ongoing litigation between Oklahoma and poultry integrators headquartered in northwest Arkansas [8] [9], Region 6 USEPA (i.e., Arkansas, Louisiana, New Mexico, Oklahoma, and Texas) sampled soils and standing water around poultry production facilities in the Illinois River Watershed in northwest Ar-kansas and northeast Oklahoma in 2010 through 2013. The results of these inspections are used to encourage independent producers to implement management strategies to reduce nutrient runoff from their facilities [10].
Producing 1.0 billion birds per year, Arkansas is third to Georgia and Alabama (1.3 and 1.1 billion birds∙yr−1,
respectively) in broiler production [11]. The majority of this production is located in northwest Arkansas and northeast Oklahoma. To accommodate a large production density, broiler houses are constructed on compacted clay pads with a minimum of two adjacent houses per farm. Between each house is a drainage swale for rainfall runoff to be transported away from the houses. Grass is established in this area for erosion control and to facili-tate water infiltration and reduce surface runoff volume and energy.
One of the few studies investigating dust emissions from poultry house operation is conducted by Burns et al. [12] in Kentucky, who report that a single poultry house can emit in excess of 1700 kg of dust annually. The study utilizes sensors on the fans to measure size and concentration of dust particles prior to being discharged from the house. Based on visual examinations of production facilities on aerial photos, dust deposition can ex-tend 3 to 9 m from the fan outlet. Fans are operated for different purposes and at different times during a flock production cycle, which greatly affects the amount of dust exhausted by each fan. There are two modes of fan operation, desired in-house temperature and ventilation to provide required air quality needed for optimum bird health and weight gain.
While dust deposited adjacent to fans has been observed at several poultry facilities in northwest Arkansas by USEPA inspections, no studies since Burns et al.[12] have investigated the potential for fan dust to actually enrich runoff from adjacent to poultry houses with P and N. Given the water quality concerns in the Illinois River Watershed [13] [14] and ongoing litigation affecting poultry producers and integrators [8] [9], there is an urgent need for more information on the extent and magnitude of the potential of ventilation fan dust to contri-bute nutrients to runoff from production facilities.
The objectives of this study were to quantify P and N in runoff from sites immediately adjacent to poultry house fans in order to evaluate the potential for P and N in dust emitted during bird growth to be transported off site during surface runoff. Using simulated rainfall-runoff adjacent to house ventilation fans, the collected data were intended to represent the greatest potential nutrient concentrations from the dust from a single flock of birds. The dust deposition pattern allowed for installation of simulated rainfall plots centered over the thickest dust deposits outside a poultry house. Rainfall simulations were conducted after each flock was removed for five consecutive flocks to measure nutrient runoff for different seasons over one year from both sidewall and tunnel fans. It was hypothesized that simulated rainfall-runoff P and N concentrations differed seasonally and between fan types.
2. Materials and Methods
2.1. Site Description94˚18'22.84''W) in western Washington County, northwest Arkansas (Figure 1). This facility is a small-scale, commercial production facility located in the Ozark Highlands (i.e., Major Land Resource Area 116A) [15] and consists of a set of four broiler houses. The natural soils immediately surrounding this facility, which is located in a summit landscape position at an elevation of approximately 384 m, are mapped as Nixa very gravelly silt loam (loamy-skeletal, siliceous, active, mesic Glossic Fragiudults) [16]. The Nixa series soils are very slowly permeable soils that formed in cherty limestone [16], thus natural rainfall is prone to surface runoff from the area surrounding the broiler houses. Runoff from the area flows to nearby upland headwater tributaries that flow into the Illinois River, which is approximately 3.3 km directly west of the study site.
2.2. Experimental Design
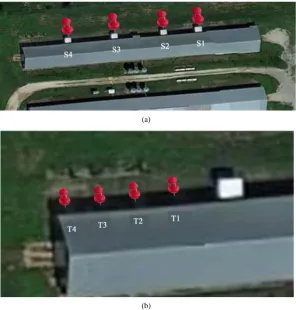
Rainfall-runoff simulations were conducted adjacent to house #4 at the facility (Figure 2) to evaluate the effects of fan type (i.e., sidewall ventilation fans versus tunnel ventilation fans) and fan operation time (i.e., season, warm months versus cool months) on runoff quantity and runoff water quality; thus the experiment was treated as a block design. Rainfall-runoff simulations were conducted adjacent to only one house to minimize variability in nutrient concentrations in the dust on the soil surface adjacent to each fan. Though the measured data were specific to this particular single house and this production facility, the results were assumed to be representative of other broiler houses with both sidewall and tunnel ventilation fans throughout the Ozark Highlands region.
2.3. Ventilation Fan Configuration and Operation
At the study site, sidewall fans 1 (S1) and 4 (S4) operate on a timed schedule at the beginning of each flock during cool weather (Figure 2(a)). Sidewall fans S1, S3, and S4 operate on a timed schedule at the beginning of each flock during warm weather. If the in-house temperature is 1.1˚C above the desired level, all sidewall fans, including sidewall fan S2, automatically operate to maintain house temperature and humidity. Sidewall-fan use dominates during cool weather. When the in-house temperature rises to 1.6˚C, 2.2˚C, 3.1˚C, or 3.3˚C above the desired level, tunnel ventilation fans T1, T2, T3, and T4, respectively, automatically start operating (Figure 2(b)). Prior to T4 operating, airflow is directed across the house. Once T4 begins operating, airflow is pulled down the house through cooling cells at the opposite end of the house.
Tunnel fan use is greater during warm weather and each tunnel fan (34,000 m3 min−1) exhausts air at an ap-preciably greater rate than a sidewall fan (20,400 m3∙min−1), resulting in more dust being exhausted from the house via tunnel than sidewall ventilation fans. Based on the amount of electricity used by each fan to maintain optimum in-house humidity and temperate, the volume of air exhausted by each fan was determined (Figure 3).
(a)
[image:4.595.166.463.372.683.2](b)
Figure 3.Volume of air exhausted by sidewall and tunnel fans during each flock of birds in 2012 and 2013.
2.4. Surface Runoff Plot Installation
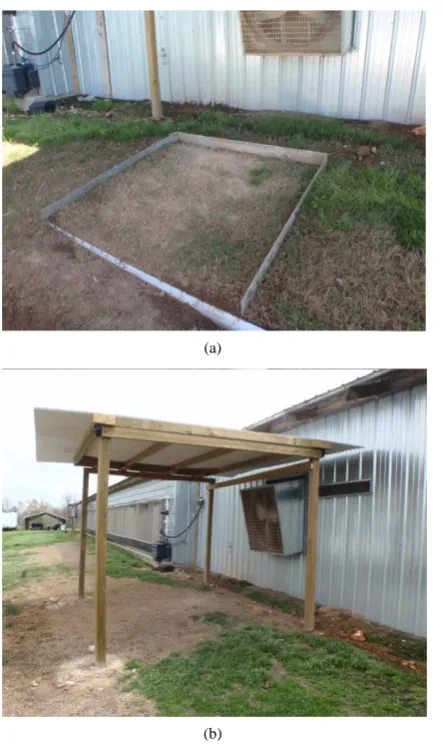
Identically sized plots (3 m2) were installed outside broiler house #4 adjacent to each fan (Figure 4). As the grassed areas adjacent to the fans are exposed to natural rainfall, structures were built to cover the plot areas to protect deposited dust from natural rainfall (Figure 4(a)). For each fan, plots were positioned within the high-volume dust trail and in areas with consistent slopes (~3%) to obtain uniform runoff (Figure 4(b)). Dust volumes and deposition uniformity were expected to differ at least slightly among plots due to variability in fan operating time. The runoff plots were covered to avoid disturbance by natural rainfall between flocks (i.e., when there were birds in the house). Roof structures were removed prior to each rainfall simulation study, and re-placed immediately following rainfall. The only disturbance to the grass at the site was cutting grass to a 5-cm height following each rainfall simulation.
Rainfall simulation plots 1.5-m wide by 2-m long with 3% slope bounded by 0.2-cm thick and 15-cm wide metal frames, were installed in the center of the dust plume adjacent to each fan (Figure 4(b)). Runoff collection gutters at the downslope edge of the plots diverted runoff to a below-ground container, from which the runoff was pumped into a 190-L barrel using a peristaltic pump. The frames were designed to fit under the rainfall si-mulator so the areas enclosed would receive equal amounts of rainfall with a coefficient of uniformity of >90% and followed National Phosphorus Research Project and U.S. Department of Agriculture-Natural Resources Conservation Service protocols [17]-[19].
2.5. Surface Runoff Plot Installation
(a)
[image:6.595.206.428.80.453.2](b)
Figure 4. Simulated rainfall-runoff plot borders (a) and protective shelter (b).
5OWSQ), designed for a flow rate of 210 mL∙s−1
, was mounted central to the top of the frame and 3 m above the surface of the plot [18]. Windscreens were attached to three sides to restrict wind impact on rainfall uniformity. Water was supplied by a 25-mm diameter pipe from the farm’s well. Samples of simulated rainfall were col-lected prior to each rainfall simulation for chemical analysis.
A regulator maintained water pressure at 28.3 kPa (4.1 PSI) to produce raindrops of similar size to natural rainfall [20] [21]. Rainfall distribution and volume were measured prior to each simulation study using five col-lection pans located in each corner and the center of the plot, equidistant from each other. Pressure was main-tained at 28.3 kPa (4.1 PSI) and rainfall was collected for 5 minutes prior to measurement.
Rainfall simulations were conducted at an intensity of 7 cm∙hr−1
, which is equivalent to a 2-year, 24-hour storm, and runoff was collected for a total of 30 minutes according to the National Phosphorus Research Project
[18]. Rainfall simulations were conducted on the same day for all plots of a particular fan type.
2.6. Control Data
The chemical composition of runoff from pastures adjacent to the farm, which had not received fertilizer nor had been grazed in the prior 15 years, were used as unamended control observations for comparison [22].
2.7. Chemical Analyses
until analyzed. The concentration of dissolved P (DP) was determined on filtered runoff by the colorimetric molybdenum-blue method of Murphy and Riley [23] and ammonia-N (NH3-N) and nitrate-N (NO3-N) were
measured on a Lachat Instruments QuikChem 8500 flow injection analysis system (Milwaukee, WI). A 125-mL subsample was acidified with 12 drops of concentrated sulfuric acid for sample preservation. Total phosphorus (TP) and total nitrogen (TN) were determined on unfiltered runoff samples following persulfate/autoclave diges-tion [24]. Total solids (TS) content was determined gravimetrically on a 125-mL sample of unfiltered runoff af-ter over-drying (105˚C) for 12 hours. Rainwaaf-ter was sampled, prepared, and analyzed identically.
2.8. Flow-Weighted Concentrations
Flow-weighted concentrations were determined by calculating the load (i.e., event concentration multiplied by total volume from 30 minutes of runoff) for each fan from a rainfall simulation runoff event. Loads for all of the plots for the runoff event were summed and flow for all of plots and runoff events were summed. Finally, the sum of loads was divided by the sum of runoff to obtain flow-weighted concentrations for the event for sidewall and tunnel fan plots. The flow-weighted concentrations represent the worst-case scenario if a poultry house was located adjacent to a waterway.
2.9. Statistical Analyses
Separate one-factor analyses of variance (ANOVA), were conducted to evaluate the effects of season and fan location/type (i.e., sidewall and tunnel fans) on runoff water quality (i.e., DP, TP, NH3-N, NO3-N, TN, and TS
concentrations). Since sidewall and tunnel fans did not operate at the same times of the year, the interaction ef-fects of season and fan type could not be evaluated. All relationships are reported as statistically significant at the P < 0.05 level, unless noted otherwise. Wolfram Mathematica (online beta version 2014, Wolfram, Cham-paign, Illinois) was used for all statistical analyses.
3. Results and Discussion
3.1. Ventilation Fan UseThe volume of air exhausted from house #4 by sidewall fans S1, S2, S3, and S4 and tunnel fans T1, T2, T3, and T4 were determined from in house electricity use records over 2012 and 2013 (Figure 3). A greater volume of air was exhausted by the four sidewall (52 and 62%) than then the four tunnel (48 and 38%) fans in the mid-winter flocks of 2012 (24th February to 11th April) and 2013 (5th February to 18th March), respectively
(Figure 3). In contrast, during the warmer summer months (June through August), tunnel fans exhausted a
greater volume of air from house #4 (89 and 84%) than from the sidewall fans (11 and 16%) during 2012 and 2013, respectively (Figure 3).
On an annual basis, the four sidewall fans exhausted 35% and tunnel fans 65% of the total amount of air ex-hausted in 2012. However, in 2013 sidewall fans exex-hausted a greater proportion of air than in 2012, exhausting 43% of the annual volume of air with tunnel fans exhausting 57% (Figure 3). The greater tunnel fan use relative to sidewall fans in 2012 than in 2013, reflects the appreciably warmer June, July and August of 2012 (average high of 34˚C) than 2013 (average high of 29˚C from National Oceanic and Atmospheric Administration
http://www.srh.noaa.gov/). The difference in air volume between fan type and over time of the year when birds are present in the house, influences the amount of dust exhausted and deposited adjacent to house ventilation fans.
3.2. Effect of Season
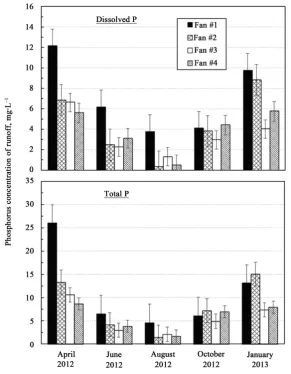
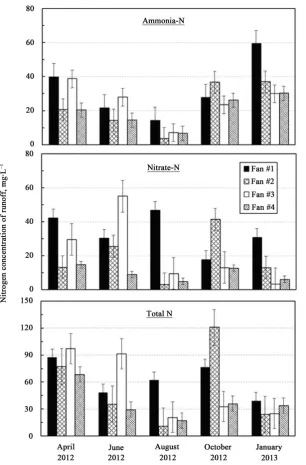
The concentration of P and N forms in runoff varied with time of the year that rainfall was applied for sidewall (Figure 5 and Figure 6) and tunnel fans (Figure 7 andFigure 8). For sidewall fans, P and N concentrations were lower (P < 0.01) in runoff from fans S2, S3, and S4 for the August rainfall simulation (9.0 and 56 mg∙L−1
for TP and TN, respectively) than in runoff for the other four rainfall simulation dates (2.5 and 16.4 mg∙L−1
Figure 5. Average concentration of dissolved and total P in runoff from plots adjacent
to sidewall ventilation fans as a function of season with error bars given.
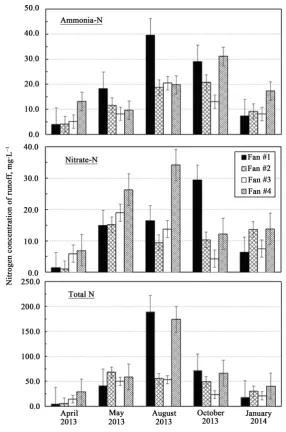
This shift in fan use with season is reflected in greater P and N concentrations in runoff from the tunnel fans in May and August (8.9 and 86.1 mg∙L−1, respectively) compared with runoff from rainfall simulations in Octo-ber, January, and April (2.9 and 31 mg∙L−1, respectively;Figure 7and Figure 8). Clearly, the potential for dust emitted from fans can enrich the P and N concentration of runoff occurring immediately adjacent to the fans. This potential is directly related to fan use, which changes during the year, with seasonal fluctuations in in-house temperature and humidity triggering fan use.
3.3. Effect of Fan Location
The concentration of DP and TP in runoff from sidewall fan S1 tended to be greater than from S2, S3, and S4 for each simulations (Figure 5). Unlike P, N did not vary consistently among fans (Figure 6). Sidewall fan S1 operates longer than the other sidewall fans, irrespective of season, with only fan S1 operating for the first week of a new flock, when birds occupy a quarter of the house. Thus, the amount of dust emitted from fan S1 is ex-pected to be greater than from the other three fans, which related directly to the nutrient runoff trends observed.
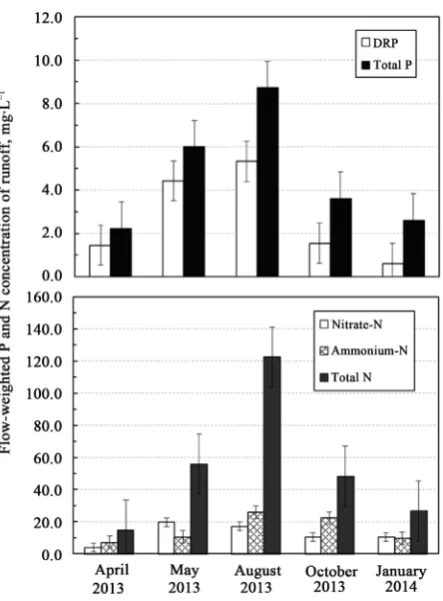
3.4. Flow-Weighted Concentrations
Concentrations of P and N were converted to a flow-weighted basis within rainfall simulation events by calcu-lating loads at each fan, summing the loads, then dividing the total by the total flow for all runoff plots (Figure 9
Figure 6. Average concentration of ammonia-N, nitrate-N, and total N in runoff from
plots adjacent to sidewall ventilation fans as a function of season with error bars given.
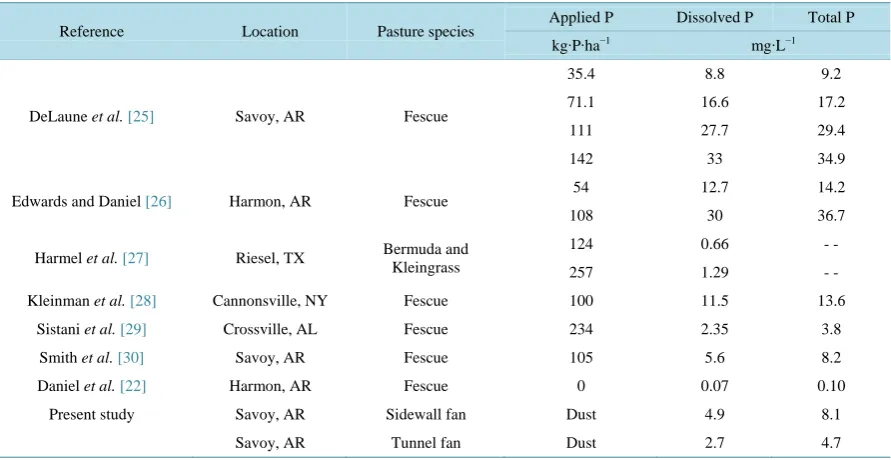
among fans and with nutrient runoff from nearby pastures that had not been fertilized or grazed in 15 years and pasture that had received poultry litter (Table 1). Fluctuations in average flow-weighted concentrations of P and N forms in runoff from plots adjacent to sidewall and tunnel fans were consistent with changes in fan use (Figure 9andFigure 10).
The flow-weighted concentration of DP in runoff from plots adjacent to sidewall (4.9 mg∙L−1
) and tunnel fans (2.7 mg∙L−1) was within the range of values measured in runoff from area pastures that received varying amounts of poultry litter (0.7 to 33 mg∙L−1; Table 1). Total P concentration in runoff from sidewall (8.1 mg∙L−1) and tunnel fans (4.7 mg∙L−1) tended to be at the lower limits of the range measured in fertilized pasture runoff
(3.8 to 37 mg∙L−1; Table 1). As expected, runoff from plots impacted by fan dust were appreciably greater than
Figure 7.Average concentration of dissolved and total P in runoff from plots adjacent
to tunnel ventilation fans as a function of season with error bars given.
Table 1. Phosphorus runoff from plots treated with poultry litter and from unfertilized ungrazed pasture.
Reference Location Pasture species Applied P Dissolved P Total P
kg∙P∙ha−1 mg∙L−1
DeLaune et al.[25] Savoy, AR Fescue
35.4 8.8 9.2
71.1 16.6 17.2
111 27.7 29.4
142 33 34.9
Edwards and Daniel [26] Harmon, AR Fescue 54 12.7 14.2
108 30 36.7
Harmel et al.[27] Riesel, TX Bermuda and
Kleingrass
124 0.66 - -
257 1.29 - -
Kleinman et al.[28] Cannonsville, NY Fescue 100 11.5 13.6
Sistani et al. [29] Crossville, AL Fescue 234 2.35 3.8
Smith et al.[30] Savoy, AR Fescue 105 5.6 8.2
Daniel et al. [22] Harmon, AR Fescue 0 0.07 0.10
Present study Savoy, AR Sidewall fan Dust 4.9 8.1
[image:10.595.93.539.492.722.2]Figure 8.Average concentration of ammonia-N, nitrate-N, and total N in runoff from
plots adjacent to tunnel ventilation fans as a function of season with error bars given.
4. Summary and Conclusions
The calculation of P and N loss in runoff from 3-m2 plots using simulated rainfall (7 cm∙hr−1 for 30 min) does not represent loss on a field basis under natural rainfall; thus loads are not calculated [17]. Use of the plot and simulated rainfall in this research does, however, allow a comparison of nutrient runoff adjacent to ventilation fans of poultry broiler houses under a constant rain fall event. In this research, fan type and time of year are evaluated for their independent effects on simulated rainfall-runoff water quality.
Tunnel fan use is greater during warm weather and each tunnel fan exhausts at a rate that is 2.5 times greater than a sidewall fan, resulting in more dust being exhausted from the house during August, the peak period of tunnel fan use. The current research is conducted to obtain baseline data to evaluate the potential for P and N enrichment of runoff occurring from around ventilation fans of poultry broiler houses. Additional testing will be required to determine if there are statistically significant differences in runoff concentrations among fan location and type during the same growing season.
Figure 9.Flow-weighted concentrations of P and N from runoff plots adjacent to sidewall ventilation fans with error bars given.
[image:12.595.204.426.394.695.2]33 mg∙L−1 and 3.8 to 37 mg∙L−1, respectively. In contrast, concentrations from fan plots ranges from 0.2 to 12
mg∙L−1 for DP and 1.0 to 26 mg∙L−1 for TP. Based on this comparison, runoff concentrations from the fan plots
are similar to that observed in runoff from fields that have received poultry litter.
This study provides baseline data for the potential for P and N runoff adjacent to poultry house ventilation fans. Although the subject facility is not discharging into a waterway, it is important to recognize that runoff concentrations for each fan plot, regardless of the season, are consistently above current regulated limits for wastewater treatment plant discharge into the Illinois River (1.0 mg∙TP∙L−1). If a facility is proximate to a
wa-terway, poultry house fan dust runoff concentrations at the nutrient source can be elevated and pose a threat to the quality of receiving waters.
Acknowledgements
This research was supported by a grant from the USGS 104B program funding.
References
[1] United States Environmental Protection Agency (1996) Environmental Indicators of Water Quality in the United States. EPA 841-R-96-002. U.S. EPA, Office of Water (4503F), U.S. Govt. Printing Office, Washington DC.
http://nepis.epa.gov/Exe/ZyPDF.cgi/2000CZIX.PDF?Dockey=2000CZIX.PDF
[2] Dale, V.H., Kling, C.L., Meyer, J.L., Sanders, J., Stallworth, H., Armitage, T., Wangsness, D., Bianchi, T.S., Blumberg, A., Boynton, W., Conley, D.J., Crumpton, W., David, M.B., Gilbert, D., Howarth, R.W., Lowrance, R., Mankin, K.R., Opaluch, J., Paerl, H.W., Reckhow, K., Sharpley, A.N., Simpson, T.W., Snyder, C. and Wright, D. (2010) Hypoxia in the Northern Gulf of Mexico. Springer Series on Environmental Management. Springer Science, New York.
http://yosemite.epa.gov/sab/sabproduct.nsf/C3D2F27094E03F90852573B800601D93/$File/EPA-SAB-08-003complet e.unsigned.pdf
[3] Schindler, D.W., Hecky, R.E., Findlay, D.L., Stainton, M.P., Parker, B.R., Paterson, M.J., Beaty, K.G., Lyng, M. and Kasian, S.E.M. (2008) Eutrophication of Lakes Cannot Be Controlled by Reducing Nitrogen Input: Results of a 37-Year Whole-Ecosystem Experiment. Proceedings of the National Academy of Sciences of the United States of America, 106, 11254-11258. http://www.pnas.org/content/105/32/11254.full.pdf
http://dx.doi.org/10.1073/pnas.0805108105
[4] Dubrovsky, N.M., Burow, K.R., Clark, G.M., Gronberg, J.M., Hamilton, P.A., Hitt, K.J., Mueller, D.K. and Munn, M.D. (2010) The Quality of Our Nation’s Waters—Nutrients in the Nation’s Streams and Groundwater, 1992-2004: United States Geological Survey Circular 1350. 174 p. http://water.usgs.gov/nawqa/nutrients/pubs/circ1350
[5] National Research Council (2008) Nutrient Control Actions for Improving Water Quality in the Mississippi River Basin and Northern Gulf of Mexico. Committee on the Mississippi River and the Clean Water Act: Scientific, Modeling and Technical Aspects of Nutrient Pollutant Load Allocation and Implementation. National Research Council, Washington, District of Columbia. 75 p. http://www.nap.edu/catalog/12544.html
[6] United States Environmental Protection Agency (2010) Guidance for Federal Land Management in the Chesapeake Bay Watershed. Chapter 2: Agriculture. EPA 841-R-10-002. U.S. EPA, Nonpoint Source Pollution, Office of Wetlands, Oceans, and Watersheds. Washington DC. 247 p. http://www.epa.gov/nps/chesbay502/pdf/chesbay_chap02.pdf
[7] United States Environmental Protection Agency (2011) Findings of Violation and Order of Compliance, in the Matter of Mrs. Lois Alt, Old Fields, West Virginia. Administrative Order CWA-03-2012-0023DN. U.S. EPA Region 3, Phil-adelphia. 12p. http://archive.epa.gov/reg3wapd/archive/web/pdf/wv_loisaltcwa-03-2012-0023dn_508.pdf
[8] United States District Court Northeastern Oklahoma (2009) Case 09-5134 Document 01018317597. http://www.narf.org/nill/bulletins/dct/documents/cherokee_brief_cta.pdf
[9] State of Oklahoma vs. Tyson Foods Inc. (2009) The Court Should Exclude Nutrient Management Plans from Water-sheds Other than the Illinois River Watershed.
https://ecf.oknd.uscourts.gov/cgi-bin/DisplayPDF.pl?dm_id=898371&dm_seq=0
[10] Tyson Foods (2012) Managing Our Environmental Footprint. Sustainability Report: Section 4.5. http://www.tysonsustainability.com/2012/Section-4/4_5.aspx
[11] United States Department of Agriculture, National Agricultural Statistics Service (2015) Broiler Production by State, 2014. http://www.nass.usda.gov/Charts_and_Maps/Poultry/brlmap.php
[12] Burns, R., Li, H., Moody, L., Xin, H., Gates, R., Overhults, D. and Earnest, J. (2008) Quantification of Particulate Emissions from Broiler Houses in the Southeastern United States. Proceedings of the 2008 Livestock Environment VIII Conference, American Society of Agricultural and Biological Engineers, Publication 701P0408.
[13] Herron, S., Sharpley, A.N., Watkins, S. and Daniels, M. (2012) Poultry Litter Management in the Illinois River Wa-tershed of Arkansas and Oklahoma. Cooperative Extension Service, Division of Agriculture, University of Arkansas. Fact Sheet FSA 9535, 4 p. http://www.uaex.edu/publications/pdf/FSA-9535.pdf
[14] Sharpley, A.N., Richards, P., Herron, S. and Baker, D. (2012) Comparison between Litigated and Voluntary Nutrient Management Strategies. Journal of Soil & Water Conservation, 67, 442-450. http://dx.doi.org/10.2489/jswc.67.5.442
[15] Brye, K.R., Mersiovsky, E., Hernandez, L. and Ward, L. (2013) Soils of Arkansas. Arkansas Agricultural Experiment Station, University of Arkansas System Division of Agriculture, Fayetteville.
[16] Soil Survey Staff, Natural Resources Conservation Service, United States Department of Agriculture (2015) Official Soil Series Descriptions. https://soilseries.sc.egov.usda.gov/OSD_Docs/N/NIXA.html
[17] Sharpley, A.N. and Kleinman, P.J.A. (2003) Effect of Rainfall Simulator and Plot Scale on Overland Flow and Phos-phorus Transport. Journal of Environmental Quality, 32, 2172-2179. http://dx.doi.org/10.2134/jeq2003.2172
[18] Southern Extension-Research Activity-17 (2015) National Phosphorus Research Project for Simulated Rainfall—Surface Runoff Studies. Southern Extension-Research Activity-Information Exchange Group 17, Virginia Tech. University, Blacksburg, VA. https://sera17dotorg.files.wordpress.com/2015/02/national-p-protocol.pdf
[19] Spaeth, K., Weltz, M., Pierson, F., Blackburn, W.H., Fox, D., Merz, D., Shaver, P., Brackley, G., DeGarmo, H., Whited, M., Flanagan, M., Hood, K. and Franks, C. (1995) Small Plot Rainfall Simulation: Background and Proce-dures. Technical Note Rangeland Hydrology. US Department of Agriculture, Natural Resources Conservation Service, Washington DC.
http://efotg.sc.egov.usda.gov/references/public/NE/Range_and_Pasture_Technical_Note_6(Small_Plot_Rainfall_Simul ation).pdf
[20] Humphry, J.B., Daniel, T.C., Edwards, D.R. and Sharpley, A.N. (2002) A Portable Rainfall Simulator for Plot-Scale Runoff Studies. Applied Engineering in Agriculture, 18, 199-204. http://dx.doi.org/10.13031/2013.7789
[21] Miller, W.P. (1987) A Solenoid-Operated, Variable Intensity Rainfall Simulator. Soil Science Society of America Journal, 51, 832-834. http://dx.doi.org/10.2136/sssaj1987.03615995005100030048x
[22] Daniel, T.C., Stead, J., DeLaune, P., Sharpley, A.N. and Verkler, T. (2008) Edge-of-Field Water Quality Monitoring from Various Management Practices in the Ozark Highlands. Arkansas Natural Resources Commission, 319 Project 05-1300. Final Report, 189 p.
http://arkansaswater.org/319%20BMP/2007_319/05-1300%20Edge%20of%20Field%20WQ%20Monitoring%20in%2 0Ozark%20Highlands.pdf
[23] Murphy, J. and Riley, J.R. (1962) A Modified Single Solution Method for the Determination of Phosphate in Natural Waters. Analytica Chimica Acta, 27, 31-36. http://dx.doi.org/10.1016/S0003-2670(00)88444-5
[24] Patton, C.J. and Kryskalla, J.R. (2003) Methods of Analysis by the US Geological Survey National Water Quality La-boratory: Evaluation of Alkaline Persulfate Digestion as an Alternative to Kjeldahl Digestion for the Determination of Total and Dissolved Nitrogen and Phosphorus in Water. US Geological Survey, Water Resources Investigations Report 03-4174. US Geological Survey, Branch of Information Services, Federal Center, Denver, 33 p.
http://nwql.usgs.gov/pubs/WRIR/WRIR-03-4174.pdf
[25] DeLaune, P.B., Moore Jr., P.A., Carmen, D., Sharpley, A.N., Haggard, B.E. and Daniel, T.C. (2004) Factors Affecting Phosphorus Loss from Poultry Litter: Development of Phosphorus Source Component. Journal of Environmental Quality, 33, 2183-2191. http://dx.doi.org/10.2134/jeq2004.2183
[26] Edwards, D.R. and Daniel, T.C. (1993) Effects of Poultry Litter Application Rate and Rainfall Intensity on Quality of Runoff from Fescue Grass Plots. Journal of Environmental Quality, 22, 361-365.
http://dx.doi.org/10.2134/jeq1993.00472425002200020017x
[27] Harmel, R.D., Torbert, H.A., Haggard, B.E., Haney, R. and Dozier, M. (2004) Water Quality Impacts of Converting to a Poultry Litter Fertilization Strategy. Journal of Environmental Quality, 33, 2229-2242.
http://dx.doi.org/10.2134/jeq2004.2229
[28] Kleinman, P.J.A., Sharpley, A.N., Bryant, R., Czymmek, K. and Ketterings, Q. (2001) National Phosphorus Runoff Project: New York. USDA-ARS, Pasture Systems and Watershed Management Research Unit, University Park, PA and Department of Crop and Soil Sciences, Cornell University, Ithaca, NY, 7 p.
https://sera17dotorg.files.wordpress.com/2015/02/new-york-nprp-kleinman-2001.pdf
[29] Sistani, K.R., Bolster, C.H., Way, T.R., Torbert, H.A., Pote, D.H. and Watts, D.B. (2010) Influence of Poultry Litter Application Methods on the Longevity of Nutrient and E. coli in Runoff from Fescue Pasture. Water, Air, & Soil Pol-lution, 206, 3-12. http://dx.doi.org/10.1007/s11270-009-0078-9