College of Information Science and Technology, Beijing University of Chemical Technology, Beijing, China
_____________________________________________________________________________________________
ABSTRACT
Based on hazard and operability study (HAZOP) and concept of qualitative simulation, an automatic method for adverse consequence identification of potential maloperation is proposed. The method was shown by a heating furnace process. The results show that automatic control process can be simulated qualitatively; hazard and state evolution of qualitative model can be identified for given maloperation.
Keywords: maloperation, consequence identification, process transition, hazard and operability study, qualitative simulation
_____________________________________________________________________________________________
INTRODUCTION
Chemical processes can operate in different steady states, and the change from one steady state to another is called process transition. Some common transitions that chemical processes undergo are startups, shutdowns, and grade changes. Abnormal situations can occur more frequently during process transitions due to sudden changes involved in process states in this period and probabilities of operator errors [1].
To guarantee safe operation, process hazard analysis (PHA) is very important to proactively identify the potential safety problems and recommend possible solutions [2]. In the chemical process industry, HAZOP is the most widely used and recognized as the preferred PHA approach. HAZOP is widely used to identify potential hazards and operability issues [3-5].
During a transition, there is a great amount of operator involvement in the operation of the plant, which increases the probability of abnormal situations. If operations of operators deviate from normal operating procedure, accidents and other abnormalities might happen [6].
Through literature search, we find that few works specially study PHA for process transition. In literature [7], a procedure to aid hazards identification for process chemicals during shutdown is listed. In literature [8], a proton-exchange-membrane fuel-cell (PEMFC) system is the subject of an operational and process-safety analysis.
In this paper, based on HAZOP and concept of qualitative simulation, an automatic method for maloperation consequence identification is proposed. Qualitative model of production process is expressed by a novel directed graph. Operating procedure is expressed by using defined syntax. The proposed algorithm conducts qualitative simulation of process transition and adverse consequence identification.
EXPERIMENTAL SECTION
2 PROPOSED METHOD
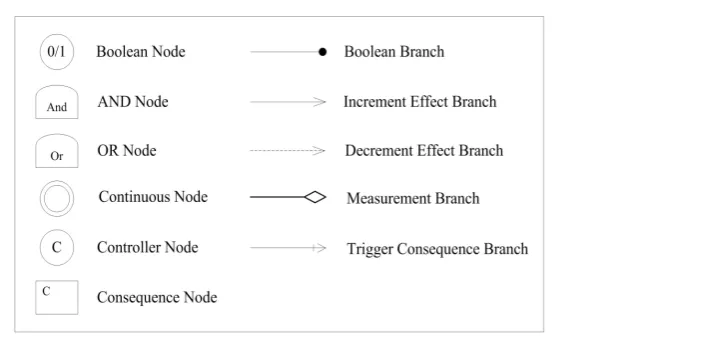
Figure 1 Graphic elements used to construct qualitative model of production process
Every branch can have a condition. is used to mark the starting point of the branch when condition exists. If condition doesn’t exist or condition exists and is satisfied, then branch is enabled.
Boolean Node is used to express open or closed state of switch valve, whether flow or level exists or not, and whether a description is true or not. Boolean Node has parametery0, andy.The value of parametery0is previous value of parametery. The value of parameteryis determined by following way: If input branch, namely branch of pointing Boolean Node, is enabled, y= 1 when parameter yof start node of input branch is not 0; y = 0 when parameteryof start node of input branch is 0.
Boolean logic provides an easy and intuitive way to express causality in production process. AND Node and OR Node have parametery, and the value is calculated according to conventional computation method of Boolean logic. Boolean Branch is designed to point Boolean Node, AND Node, and OR Node.
Continuous Node is used to represent process variable whose value can change continuously, like level and temperature. Continuous Node is expressed by parametersy0,y,△y. The value of parametery0is previous value of parameter y. The value of parameter y is the value of process variable. The parameter△y is variation ofy. The general form for using Continuous Node is shown in Fig. 2. Increment Effect Branch and Decrement Effect Branch are designed to point Continuous Node.
w
j (j
{
1
,
2
,
,
r
}
) is increment or decrement effect weight and is determined by following four types of expression. Type 1:w
j
a
, Type 2:w
j
n
j.
y
k
, Type 3:max 2 1 max . . y f f f y n y n w n j j
j
, and Type 4: 1 2 max
max . . y f f f y n y n w n j j
j .
a
is a fixed value, nj.y represents variation ofyof start node of thej
th input branch,k
is a coefficient, ymax represents maximum variation ofyof current node, which is caused by start node of input branch, and f1,f2,fn represent n constraintfunctions. Every constraint function is expressed according to form
max . . y n y n .
Controller Node is used to qualitatively simulate function of PID controller. In this paper, pure proportion controller is used to control qualitative model. Controller Node is expressed by parametersMode,KP,SP,PV,K, △y. The parameterModerepresents work mode of controller. The parameterKPis proportion coefficient. The parameter SP is set value of controller, and PVis measured value of controlled variable. The parameterKrepresents positive or negative effect of controller. ThatK is 1/-1 indicates positive effect/negative effect. The parameter △yrepresents variation of controller output. Value of PV is value of parameter y of start node of input branch. When Mode = MANU,SP= PV. Value of parameter△yare determined by following way.
AUTO Mode PV PV SP PV K K MANU Mode manually set value y P , 100 ) ( , min max (4)
Consequence Node is used to contain possible adverse consequence led by maloperation. Trigger Consequence Branch is designed to point Consequence Node.
2.2 Operating procedure
In this paper, an operating procedure consists of one or more operating stages, and an operating stage consists of one or more basic actions. Every operating stage achieves an operating goal through finite basic actions. A template representation for operating procedure provides an intuitive way to express basic action [9]. In this paper, name of operating stage is expressed in natural language. A basic action of operator is expressed qualitatively according to a template representation as shown below.
Action Item_Number [Para = Value] / [ActEndCon]
The following actions exist: open, close, run, stop, set, and wait. “Item_Number” represents the item number of equipment or process variable. “ActEndCon” is end condition of the basic action. The basic action will be performed repeatedly if this condition is not satisfied. The content in square brackets is optional.
Before adverse consequences of designated maloperations are identified, these maloperations should be expressed in operating procedure according to guidewords, such as No, Before, After, Early, and Late. For examples, for guideword “No”, delete one or more operating stages or basic actions in operating procedure; for guideword “After”, move one or more operating stages or basic actions backward.
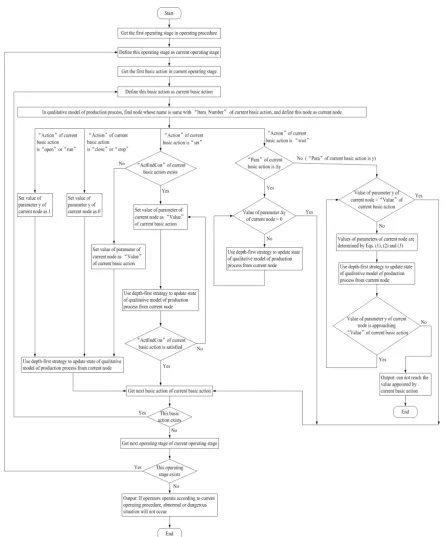
2.3 Algorithm
Figure 3 Algorithm used to identify adverse consequence of maloperation
3 CASE STUDY
Figure 4 Production process of one heating furnace
For production process shown in Fig. 4, the qualitative model has been constructed, as shown in Fig. 5.
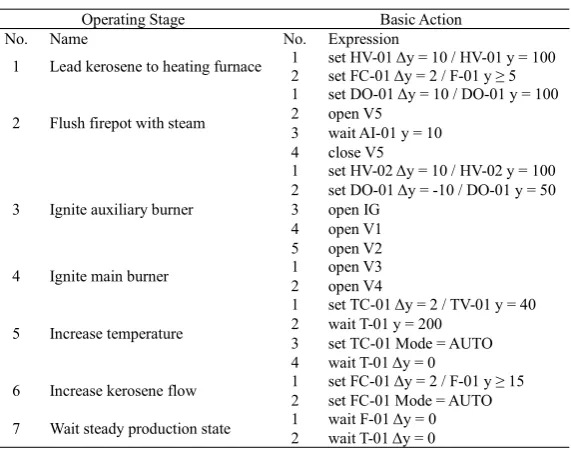
[image:5.595.86.533.313.702.2]Table 1 shows the startup operating procedure for heating furnace.
Table 1 Startup operating procedure for the heating furnace process
Operating Stage Basic Action No. Name No. Expression
1 Lead kerosene to heating furnace 12 set HV-01 Δy = 10 / HV-01 y = 100set FC-01 Δy = 2 / F-01 y ≥ 5
2 Flush firepot with steam
1 set DO-01 Δy = 10 / DO-01 y = 100 2 open V5
3 wait AI-01 y = 10 4 close V5
3 Ignite auxiliary burner
1 set HV-02 Δy = 10 / HV-02 y = 100 2 set DO-01 Δy = -10 / DO-01 y = 50 3 open IG
4 open V1 5 open V2 4 Ignite main burner 12 open V3open V4
5 Increase temperature
1 set TC-01 Δy = 2 / TV-01 y = 40 2 wait T-01 y = 200
3 set TC-01 Mode = AUTO 4 wait T-01 Δy = 0
6 Increase kerosene flow 12 set FC-01 Δy = 2 / F-01 y ≥ 15set FC-01 Mode = AUTO
7 Wait steady production state 12 wait F-01 Δy = 0wait T-01 Δy = 0
In order to save space, only two examples are shown below.
Example 1
[image:6.595.195.424.439.550.2]When normal operating procedure shown in Table 1 is performed, dynamic change of process variable T-01 from operating stage “Increase temperature” is shown in Fig. 6. What should notice is that abscissa axis represents number of times of qualitative model update rather than time. After T-01 reaches 200℃, it decreases with increment of F-01. Then T-01 reaches steady state slowly under the control of TC-01.
Figure 6 Dynamic change of process variable T-01
Example 2
[3] Vaidhyanathan, R., Venkatasubramanian, V.,Computers chem. Engng,1996, 20, 1589-1594. [4] Palmer, C., Chung, P.W.H.,J. Loss Prev.,2008, 21, 537-542.
[5] Mushtaq, F., Chung, P.W.H.,J. Loss Prev.,2000,13, 41-48.
[6] Sundarraman, A., Srinivasan, R.,Comput. Ch. E.,2003, 27, 1455-1472.
[7] Malmén, Y., Nissilä, M., Virolainen, K., Repola, P.,J. Loss Prev.,2010, 23, 249-252. [8] Gerbec, M., Jovan, V., Petrovčič, J.,Int. J. Hyd. E.,2008, 33, 4147-4160.