Comparison of SVC and TCSC Installation in Transmission Line with
Loss Minimization and Cost of Installation via Particle Swarm
Optimization
Siti Amely Jumaat
1, a, Ismail Musirin
2,b1Faculty of Electrical and Electronic Eng, Universiti Tun Hussein Onn Malaysia. 86400 Parit Raja,
Batu Pahat, Johor, Malaysia
2Faculty of Electrical Engineering, Universiti Teknologi MARA Malaysia, 40450 Shah Alam,
Selangor, Malaysia
a[email protected], b[email protected]
Keywords: Static Var Compensator, Thyristor Controlled Series Compensator (TCSC), Transmission Loss, Particle Swarm Optimization, Flexible AC Transmission System, Cost of Installation
Abstract. The paper presents a comparison of performance Static Var Compensator (SVC) and Thyristor Controlled Series Compensator (TCSC) with objective function to minimize the transmission loss, improve the voltage and monitoring the cost of installation. Simulation performed on standard IEEE 30-Bus RTS and indicated that PSO a feasible to achieve the objective function.
Introduction
FACTS device represents a modern technological development in the electrical power system [1]. FACTS devices are revolutionizing the power transmission network, increasing the efficiency and stability of the power system [2]. In comparison with other corrective control strategies i.e. load shedding and generation rescheduling; the utilization of FACTS device is a more economic solution, since it has lower operational cost and no extra cost will involve for the charge in generation and load [3, 4].
This paper presents a computational intelligences technique namely: Particle Swarm Optimization (PSO) and Evolutionary Programming (EP) for optimal location of Static Var Compensator (SVC) and Thyristor Controlled Series Compensator (TCSC) installation in the power system network. The objectives function for this research to minimize the transmission loss with constraint to improve the voltage profile of the system and monitoring the cost of installation. The simulation tests were conducted on IEEE 30-Bus RTS for validation of the proposed techniques.
Static Var Compensator (SVC)
SVC can be used for both inductive and capacitive compensation. In this research, SVC is modeled as an ideal reactive power injection at bus i as shown in Figure 1. The SVC consists of a combination of a fixed capacitors and reactors. Thyristor switched capacitors and thyristor controlled reactors (TCR) in parallel with the power system. From an operational point of view, the SVC behaves like a shunt connected variable reactance, which either generates or absorbs reactive power in order to regulate the voltage magnitude at the point of connection to the AC network. It is used extensively to provide fast reactive power and voltage regulation support. The TCR is reactive impedance, XL, with a bidirectional thyristor valves. The controllable reactance of the TCR part is XV, which is defined by Eq. 1.
(1)
where α is the firing angle of the thyristor. The SVC equivalent susceptance is [5],
(2)
) 2 sin( 2 2 L X X
V
L X C X
) 2 sin( 2
C X L X B
SVC
and the reactive power equation is
[image:2.595.215.368.83.331.2](3)
Figure 1 Model of SVC
i
C
R
Thyristor Controlled Series Compensator (TCSC)
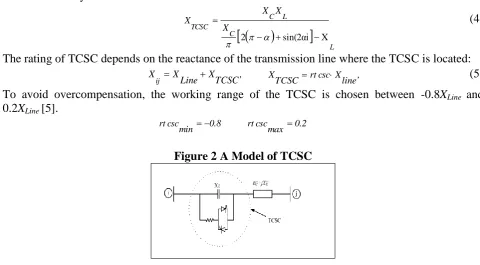
The model of the network with TCSC is shown in Figure 2. The TCSC consists of a capacitor bank and a thyristor controlled inductive branch connected in parallel and series connected to the transmission line. The controllable reactance, XTCSC, is directly used as the control variable that can be determined by:
(4)
The rating of TCSC depends on the reactance of the transmission line where the TCSC is located: (5)
To avoid overcompensation, the working range of the TCSC is chosen between -0.8XLine and 0.2XLine[5].
Figure 2 A Model of TCSC
Particle Swarm Optimization Technique
PSO algorithm was originally developed by Kennedy and Eberhant based on the social behaviors of animal swarms [6-7]. PSO is developed through simulation of bird flocking or fish schooling in two-dimensional space. The position of each particle is represented by its x, y axis position and also its velocity is expressed by v (the velocity of x axis) and vy (the velocity of y axis). Modification of the particle position is realized by the position and velocity information. Bird flocking optimizes a certain objective function. Each particle has known its value as Pbest and its x, y position. This information is an analogy of the personal experience of each particle. In addition, each particle
SVC B 2 i V SVC i
Q
2 sin(2αi
XX
X X X
L C
L C TCSC
, TCSC X Line X X
ij XTCSC rtcscXline,
8 . 0 min csc
rt 0.2
max csc
[image:2.595.54.535.409.674.2]knows the best value in the group is Gbest. This information is an analogy of the knowledge of how other particles around them have performed. Each particle tried to modify its position using the following information: the current position (x, y), the current velocities (vx, vy), the distance between the current position and Pbest, and the distance between the current position and Gbest [8]. From [8], the main merits of PSO are simplicity in concept implementation and computationally efficient. The step by step algorithm for the proposed optimal location and sizing of FACTS device is given below:
i. Set the loads condition, Qload at weak bus before FACTS devices installation (base case value). Set the loss and voltage constraints
ii. Initialize the related parameters, such as the population size, the size of particle, the maximum number of iteration, and the power flow data.
iii. Initialize the population size with consider the variable that should be optimized (the locations, and the sizing of multi-unit FACTS devices). The random numbers, x as a control variables of multi-unit FACTS devices (x1, x2, … x nm) where x1, … x8 are the locations of multi-unit FACTS device and x9, … x16 are the sizing of multi-unit FACTS devices.
(6)
where: n is the population sizing.
iv. Calculate fitness I. Fitness is computed for each particle. Determine the Pbest_oldand Gbest_old value and stored in ascending order for the purpose of minimization of loss. Pbest_old = min(x1,…x16)_old and Fitness 1= Lossmin_old
v. Update the velocity and position of the particle based on the equations (7), (8) and (9). Velocity of each particle can be modified by:
(7)
where: k 1 i
v is velocity of particle i at iterations, w is weight function, c1 and c2 is weight
coefficient, rand1 and rand2 is random number between 0 and 1, k
i
s is current position of
particle i-th up to the current iteration k, Pbest iis the best position of particle i-th up to the current iteration, Gbest i is the best overall position found by the particle up to the current iteration. Weight function is given by Eq. 8:
iter max iter min w max w max w w (8) The new position can be modified in Eq. 9
i. 1 k i v k i s 1 k i
s
(9) where w max is maximum weight equal to 0.9, wmin is minimum weight equal to 0.4, itermax is maximum iteration number, iter is current iteration number
vi. Calculate fitness 2 and determine the Pbest_new and Gbest_new. Assign Pbest_new = min(x1,…x16)_new and fitness 2=Lossmin_new.
vii. Convergence criterion. The convergence criterion determined by Lossmin_new<<Lossmin_old. If not, repeat Steps v to vii until stopping criterion, as such sufficiently excellent Lossmin fitness or a maximum numbers of iteration is met.
viii. Calculate the cost of installation multi-unit of FACTS devices using Eq. 10, 11 and 13 for SVC installation and Eq. 10, 12 and 13 for TCSC installation. The cost of installation has been mathematically formulated and is given by Eq. 10:
11 nm x 2 n x 1 n x m 1 x 12 x x ] at X [ ) k i s i best G ( 2 rand 2 c ) k i s i best P ( 1 rand 1 c v w 1 k i
C= C×A×1000[US$] (10) From the Siemens AG Database, the cost function for SVC and TCSC are given in Eq. 11 and Eq. 12 are given:
CSVC=0.0003A2-0.0305A+127.38 [US$/kVar] (11) CTCSC=0.0015A2-0.7130A+153.75[US$/kVar] (12)
A=|Q2-Q1| (13)
ix. Step 9: End.
Results and Discussion
In order to realize the effectiveness of the proposed PSO techniques the IEEE 30-Bus RTS was tested to find the optimal location and sizing of FACTS device. The SVC and TCSC installation in the system to minimize the loss and improve the voltage of the system have been conducted at several load condition are subjected to Bus 29. Result for transmission loss reduction when bus 29 is subjected to 20MVar is tabulated in Table 1 and Table 2. The results for number, location, and sizing of SVC to minimize transmission loss with 20MVar at Bus 29 using PSO technique are tabulated in Table 1. For instance, the transmission loss has been reduced from 19.4699MW to 17.4928MW when three units of SVC are installed in the system optimized using PSO. In order to achieve this value, the locations of SVC are buses 29, 22 and 29 with corresponding SVC sizing of 57.4949MVar, 13.4347MVar and 24.12MVar.
Table 1 Results of Location and Sizing of SVC when Qd29 = 20MVar Using PSO Technique LOSS (MW) Qty SVC LOCATION (Bus) SVC SIZING (MVar)
19.4699 0 -
17.5578 1 30 23.5453
17.9635 2 27 29 33.4985 23.5477
17.4928 3 29 22 29 57.4949 13.4347 24.1200
17.5121 5 21 24 29 18 11 3.2724 61.1908 20.6143 10.9339 18.8218
The results for number, location, and sizing of TCSC to minimize transmission loss with 20MVar at bus 29 using PSO technique are tabulated in Table 2. The transmission loss has been reduced from 19.4699MW to 18.9329MW with two units of TCSC being installed at the transmission line in the system.
Table 2 Results of Location and Sizing of TCSC when Qd29 = 20MVar Using PSO Technique
LOSS
(MW) Qty TCSC locations (line) TCSC SIZING (p.u)
19.4699 0
19.0105 1 36 -0.3445
18.9329 2 36 11 -0.3706 -0.1538
19.0161 3 30 36 23 -0.1607 -0.3096 -0.2670
19.1639 5 35 36 35 12 25 -0.186 -0.2024 0.0304 -0.1071 -0.1730
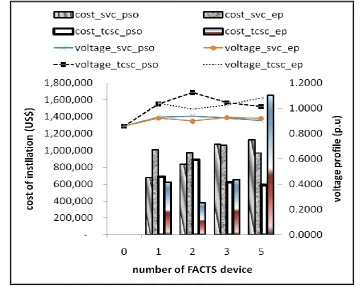
Figure 3 illustrates the results of cost of installation of FACTS device and voltage improvement using PSO and EP techniques when Qd29=20MVar. From the Figure shown that with the installation of TCSC at transmission line the cost is less than SVC installation. However, with the SVC installation at load bus system the voltage profile improvement is better with TCSC installation. With the SVC installation, the voltage profile increases greater than 1.00 p.u..
Conclusion
are SVC and TCSC. As the result, the transmission loss minimization and the voltage profile improvement are performed well when the multi-unit of SVC installation is implemented. Both the PSO and EP techniques performed well in most cases. Experiment results demonstrated that the proposed PSO technique is feasible for loss minimization scheme in other power system network. Results obtained from the study are subsequently used to highlights the security region in a system.
Figure 3 Results of Cost of Installation FACTS Device and Voltage Profile Improvement when Qd29=20MVar
References
[1] E. Acha, et al., FACTS: Modelling and Simulation in Power Networks.West Sussex, U.K. : Wiley, , 2005.
[2] N. G. Hingorani and L. Gyugyi, "Understanding FACTS: Concepts and Technology of Flexible AC Transmission Systems," IEEE Press 2000.
[3] W. Shao and V. Vittal, "LP-based OPF for corrective FACTS control to relieve overloads and voltage violations " IEE Transactions on Power System, vol. 21 no. 4, pp. 1832 - 1839, Dec 2006.
[4] Z. Lu, et al., "Optimal Location of FACTS Devices by A Bacterial Swarming LAgorithm for Reactive Power Planning " in 2007 IEEE Congress on Evolutionary Computation (CEC 2007) 2007, pp. 2344 - 2349.
[5] L.J.Cai and I.Erlich, "Optimal Choice and Allocation of FACTS devices in Deregulated Electricity Market using Genetic Algorithms," IEEE PES Power Systems Conference and Exposition, 2004, , vol. 1, pp. 201 - 207 10-13 Oct 2004
[6] R. Eberhant and J. Kennedy, "A new optimizer using particle swarm theory " presented at the 6 Int. Symposium on Micro Machine and Human Secience 1995.
[7] J. Kennedy and R. Eberhart, "Particle Swarm Optimization," presented at the IEEE International Conference on Neural Networks, Perth, Australia, 1995.