International Journal of Emerging Technology and Advanced Engineering
Website: www.ijetae.com (ISSN 2250-2459,ISO 9001:2008 Certified Journal, Volume 3, Issue 4, April 2013)
260
Optimization of Process Parameter of Wire Electrical Discharge
Machine by Response Surface Methodology on Inconel-600
C.D. Shah
1, J.R.Mevada
2, B.C.Khatri
31, 2
M.E. (CAD/CAM) – IVth semester, L.D.C.E. Ahmedabad, India. 3
Associate Professor in Mechanical Engineering, L.D.C.E. Ahmedabad, India.
Abstract— in the present paper, the study has been made to
optimize the process parameters during machining of Inconnel-600 by wire electrical discharge machining (WEDM) using response surface methodology (RSM). Four input process parameters of WEDM (namely Peak Current (IP), Pulse-On time (TON), Pulse-Off time (TOFF) and Wire Feed rate (WF)) were chosen as variables to study the process performance in terms of Material Removal Rate (MRR). In the present work, the parametric optimization method using Taguchi’s robust design is proposed for wire-cut electric discharge machining of Inconel-600. This material is gained dominance, where high strength and/or hardness is required at elevated temperatures. So, experimentation has been done by using Taguchi’s Mixed L18 (21
x33) orthogonal array. Each experiment was conducted under different conditions of pulse on time, pulse off time, peak current, and wire feed rate. The response of material removal rate is considered for improving the machining efficiency. Optimal combinations of parameters were obtained by this method. The analysis of variance (ANOVA) was carried out to study the effect of process parameters on process performance. In addition Response Surface Models have also been developed for response parameter.
Keywords—WEDM, MRR, RSM, ANOVA, Taguchi L18 OA, Molybdenum wire.
I. INTRODUCTION
Electrical Discharge Machining (EDM) was first introduced in the 1940's as a crude device used to cut broken machining tools from expensive in-process parts. Since that time EDM has become a sophisticated and indispensable technology, revolutionizing the tool, die, and mold making industries, and making significant inroads into the production of highly accurate, intricate and difficult to machine production parts. In electrical discharge machining, it is important to select machining parameters for achieving optimal machining performance. Usually, the desired machining parameters are determined based on experience or handbook values. However, this does not ensure that the selected machining parameters result in optimal or near optimal machining performance for that particular electrical discharge machine and environment.
In earlier work to solve this task, Lin, Wang, Yan, Tarng [1] used the Taguchi method with fuzzy logic as an efficient approach to determine the optimal machining parameters in the electrical discharge machining process. Wire-cut electrical discharge machining of Inconel-600 has been considered in the present set of research work. Inconel, nickel-chromium-iron alloy 600 is a standard engineering material for applications which require resistance to corrosion and heat. The alloy also has excellent mechanical properties and presents the desirable combination of high strength and good workability. The alloy's strength and oxidation resistance at high temperatures make it useful for many applications in the heat treating industry. It is used for retorts, muffles, roller hearths, and other furnace components and for heat treating baskets and trays. In the aeronautical field, alloy 600 is used for a variety of engine and airframe components, which must withstand high temperatures. Examples are lock wire, exhaust liners, and turbine seals. To obtain various structural components of Inconel-600 alloy the wire-cut EDM process plays a predominant role in some manufacturing sectors, because this process has the capacity to cut complex and intricate shapes of components in all electrically conductive materials with better precision and accuracy [2]
International Journal of Emerging Technology and Advanced Engineering
Website: www.ijetae.com (ISSN 2250-2459,ISO 9001:2008 Certified Journal, Volume 3, Issue 4, April 2013)
261
The use of linear graphs and triangular tables suggested by Taguchi makes the assignment of parameters simple. The array forces all experimenters to design almost identical experiments [3]
II. LITERATURE REVIEW
In order to improve the performance measures namely surface roughness, cutting speed, dimensional accuracy and material removal rate of the WEDM process several researches were attempted previously. Kumar Muthu, Babu Suresh, et all demonstrates optimization of Wire Electrical Discharge Machining process parameters of Incoloy800 super alloy with different performance characteristics such as Material Removal Rate (MRR), surface roughness and Kerf based on the Grey relational and Taguchi Method.[4] Iqbal Asif and Ahsan Ali Khan establish the empirical relations regarding machining parameters and the responses in analyzing the machinability of the stainless steel.[5] Kumar Mohan and Biswas Chandan Kumar used Response surface methodology to investigate the relationships between the three controllable variables on the material removal rate(MRR). Experiments are conducted on AISI D2 tool steel with copper electrode and three process variables (factors) as discharge current, pulse duration, and pulse off time. [6] Pragya Shandilya , P. K. Jain, N. K. Jain (2012) present study to optimize the process parameters during machining of SiCp/6061 Al metal matrix composite (MMC) by wire electrical discharge machining (WEDM) using response surface methodology (RSM). [7] Pal and Gauri (2010) confirm that multiple regression-based optimization methods are essentially a part of response surface methodology. [8] H. Singh, R. Garg took experiments for finding the effects of various process parameters of WEDM like pulse on time (TON), pulse off time (TOFF), gap voltage(SV), peak current (IP), wire feed tension (WT) have been investigated to reveal their impact on material removal rate of hot die steel( H-11), using one variable at a time approach. [9]
III. EXPERIMENT WORK
The experiments are performed at L.D.College of Engineering on CNC wire EDM machine, model no DK-7720, manufactured by Jian Nan Saitec NC Co Ltd. The electrode material used is 0.18 mm diameter molybdenum wire and di-electric fluid used is deminerlized water (DM Water).
The size of the work piece considered for
experimentation on the wire-cut EDM is 5 mm x 5 mm x
10 mm. This study investigates the machining
characteristics such as material removal rate (MRR). This is the most common key indicators used by many manufacturers.
Material Removal Rate (MRR)
MRR = Kerf Width (k) X Thickness of workpiece (T) X Cutting length (L)
To select the parameters and its levels for
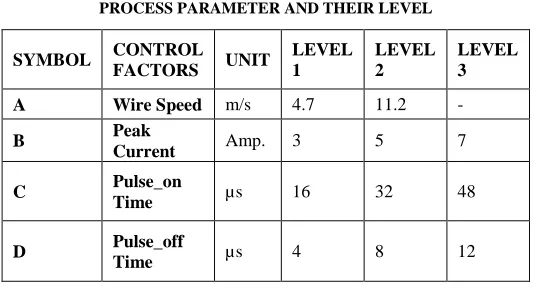
[image:2.612.311.579.320.465.2]experimentations, several exploratory experiments were conduct to determine important control factors. Out of several available controllable input parameters on the wire EDM machine, following parameters were selected with maximum feasible range, as shown in table I.
TABLE I
PROCESS PARAMETER AND THEIR LEVEL
SYMBOL CONTROL
FACTORS UNIT
LEVEL 1
LEVEL 2
LEVEL 3
A Wire Speed m/s 4.7 11.2 -
B Peak
Current Amp. 3 5 7
C Pulse_on
Time µs 16 32 48
D Pulse_off
Time µs 4 8 12
IV. RESULT AND DISCUSSION
A. Analysis of Variance (ANOVA):
In order to study the significance of the process variables towards Material Removal Rate, analysis of variance (ANOVA) was performed. Here in this analysis 95% confidence level is used. ANOVA analysis carried out in Minitab software and the results are shown here. The table II shows the p-value known as probability value is less than 0.05 (alpha value). It shows that all the parameters are
significant. The R2 value from the above analysis is 99.58%
which indicates the model used for the analysis is
appropriate. The difference between the R2 (adjusted) and
International Journal of Emerging Technology and Advanced Engineering
Website: www.ijetae.com (ISSN 2250-2459,ISO 9001:2008 Certified Journal, Volume 3, Issue 4, April 2013)
[image:3.612.43.299.123.322.2]262
TABLE II
SUMMARY OF ANOVA ANALYSIS
ANALYSIS OF VARIANCE FOR SN RATIOS
SOURCE DF
Seq SS
Adj SS
Adj
MS F P
WIRE SPEED
1 0.124 0.124 0.124 0.15 0.702
PEAK CURRENT
2 50.258 50.258 25.129 31.21 0
PULSE ON
2 59.374 59.374 29.687 36.87 0
PULSE OFF
2 53.428 53.428 26.714 33.18 0
RESIDUA L ERROR
10 8.052 8.052 0.805
TOTAL
17 171.23
DF - degrees of freedom, SS - sum of squares, MS - mean squares(Variance), F-ratio of variance of a source to variance of error, P < 0.05 - determines significance of a factor at 95%
confidence level
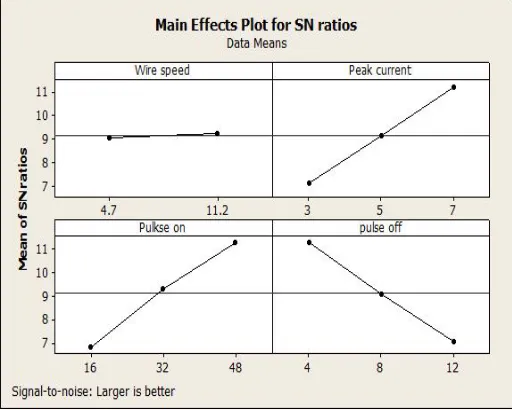
[image:3.612.324.580.124.329.2]Figures 1 and 2 shows that the cutting rate increases with the increase of pulse on time and peak current, and decreases with increase in pulse off time. This is because the discharge energy increases with the pulse on time and peak current leading to a faster cutting rate. As the pulse off time decreases, the number of discharges within a given period becomes more which leads to a higher cutting rate. With increase in spark gap set voltage the average discharge gap gets widened resulting into a lower cutting rate. The effects of wire feed is not very significant. It is also evident that cutting rate is minimum at first level of pulse on time and maximum at first level of pulse off time.
Figure 1:- Main effects of graphical plots for means.
Figure 2:- Main effects of graphical plots for S/N Ratio
[image:3.612.325.588.423.614.2]It can be seen from Figures 3 that the residuals follow an approximately straight line in normal probability plot and approximate symmetric nature of histogram indicates that the residuals are normally distributed. Since residuals exhibit no clear pattern, there is no error due to time or data collection order.
Figure 3 Residual plots for means B. Signal-to-Noise ratios (S/N ratio):
[image:3.612.50.292.514.698.2]International Journal of Emerging Technology and Advanced Engineering
Website: www.ijetae.com (ISSN 2250-2459,ISO 9001:2008 Certified Journal, Volume 3, Issue 4, April 2013)
263
Minitab 16 software help to calculate S/N Ratio based on required response and provide Analysis of variance table and response plot for deciding significant parameter and to find (%) percentage contribution of each parameter. Mean SN ratio plot gives idea about the optimum level for the factor. It is preferred to do S/N analysis as mean sum of square may be too small in case of mean analysis. It is very accurate to judge the optimum parameter based on SN Ratio analysis. Minitab offer both mean analysis as well as S/N Ratio base ANOVA. The S/N ratio represent for MRR is
From these tables, it is clear that pulse on time, pulse off time, peak current significantly affect both the mean and the variation in the MRR values. The response table 5 show the average of each response characteristic (S/N data, means) for each level of each factor. The tables include ranks based on delta statistics, which compare the relative magnitude of effects. The delta statistic is the highest minus the lowest average for each factor. Minitab assigns ranks based on delta values; rank 1 to the highest delta value, rank 2 to the second highest, and so on. The ranks indicate the relative importance of each factor to the response. The ranks and the delta values show that Peak current have the greatest effect on cutting rate and is followed by pulse off time, Pulse on time in that order. As Material Removal Tate (MRR) is the ―higher the better‖ type quality characteristic, it can be seen from Table III that the first level of wire speed(A1), third level of peak current(B3) third level of pulse on time(C3), and first level of pulse off time(D1), provide maximum value of cutting rate. The S/N data analysis (Table IV) also suggests the same levels of the variables (A2, B3, C3 and D1) as the best levels for maximum Material Removal Rater (MRR) in WEDM process.
TABLE III
EXPERIMENTAL DATA COLLECTION TABLE EX
P NO
WIRE SPEED M/S
PEAK CURR ENT AMP
PULS E ON IN µS
PULS E OFF IN µS
MRR MM3/MI
N
S/N RATIO
1 4.7 3 16 4 2.32 7.34
2 4.7 3 32 8 2.20 6.84
3 4.7 3 48 12 2.41 7.66
4 4.7 5 16 4 2.87 9.17
5 4.7 5 32 8
2.67 8.54
6 4.7 5 48 12 2.85 9.09
7 4.7 7 16 8 2.80 8.96
8 4.7 7 32 12 3.06 9.72
9 4.7 7 48 4 5.10 14.15
10 11.2 3 16 12 1.10 0.83
11 11.2 3 32 4 3.18 10.07
12 11.2 3 48 8 3.08 9.79
13 11.2 5 16 8 2.26 7.08
14 11.2 5 32 12 2.34 7.40
15 11.2 5 48 4 4.75 13.53
16 11.2 7 16 12 2.39 7.57
17 11.2 7 32 4 4.65 13.35
International Journal of Emerging Technology and Advanced Engineering
Website: www.ijetae.com (ISSN 2250-2459,ISO 9001:2008 Certified Journal, Volume 3, Issue 4, April 2013)
264
TABLEIV
RESPONSETABLEFORS/NRATIO
RESPONSE TABLE FOR SIGNAL TO NOISE RATIOS
LARGER IS BETTER
LEVEL
WIRE SPEED
PEAK CURRENT
PULSE ON
PULSE OFF
1
9.057 7.094 6.829 11.271
2
9.223 9.139 9.325 9.098
3
11.187 11.266 7.052
DELTA
0.166 4.093 4.437 4.219
RANK
4 3 1 2
C. Response Surface Methodology
Response surface methodology (RSM) is a collection of mathematical and statistical techniques useful for analyzing problems in which several independent variables influence a dependent variable or response, and the goal is to optimize this response. In many experimental conditions, it is possible to represent independent factors in quantitative form as given in Equation. Then these factors can be thought of as having a functional relationship with response as follows:
Y = Φ (x1, x2……….xk)± e r
This represents the relation between response Y and x1,
x2,… ,xk of k quantitative factors. The function Φ is called
response surface or response function. The residual er
measures the experimental errors. For a given set of independent variables, a characteristic surface is responded. When the mathematical form of Φ is not known, it can be approximated satisfactorily within the experimental region by a polynomial. Higher the degree of polynomial better is the correlation but at the same time costs of experimentation become higher.
For the present work, RSM has been applied for developing the mathematical models in the form of multiple regression equations for the quality characteristic of machined parts produced by WEDM process. In applying the response surface methodology, the dependent variable is viewed as a surface to which a mathematical model is fitted. For the development of regression equations related to various quality characteristics of WEDM process, the second order response surface has been assumed as:
D. Selection of Adequate Model for RSM
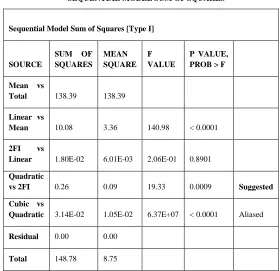
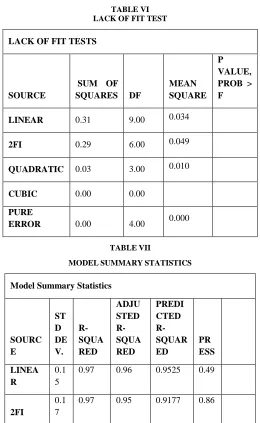
To decide about the adequacy of the model, three different tests viz. sequential model sum of squares, lack of fit tests and model summary statistics were performed for cutting rate, surface roughness, gap current and dimensional deviation characteristics of WEDM process. The Tables V to VII display three different tests to select an adequate model to fit various output characteristics. The sequential model sum of squares test in each table shows how the terms of increasing complexity contribute to the model. It can be observed that for all the responses, the quadratic model is appropriate. The ―lack of fit‖ test compares the residual error to the pure error from the replicated design points. The results indicate that the quadratic model in all the characteristics does not show significant lack of fit, hence the adequacy of quadratic model is confirmed. Another test ―model summary statistics‖ given in the following sections further confirms that the quadratic model is the best to fit as it exhibits low standard deviation, high ―R-Squared‖ values, and a low ―PRESS‖ (Adeq Precision).
TABLE V
SEQUENTIAL MODEL SUM OF SQUARES
Sequential Model Sum of Squares [Type I]
SOURCE
SUM OF SQUARES
MEAN SQUARE
F VALUE
P VALUE, PROB > F
Mean vs
Total 138.39 138.39
Linear vs
Mean 10.08 3.36 140.98 < 0.0001
2FI vs
Linear 1.80E-02 6.01E-03 2.06E-01 0.8901
Quadratic
vs 2FI 0.26 0.09 19.33 0.0009 Suggested
Cubic vs
Quadratic 3.14E-02 1.05E-02 6.37E+07 < 0.0001 Aliased
Residual 0.00 0.00
[image:5.612.303.583.431.702.2]International Journal of Emerging Technology and Advanced Engineering
Website: www.ijetae.com (ISSN 2250-2459,ISO 9001:2008 Certified Journal, Volume 3, Issue 4, April 2013)
[image:6.612.38.298.117.540.2]265
TABLE VI LACK OF FIT TEST
LACK OF FIT TESTS
SOURCE
SUM OF
SQUARES DF
MEAN SQUARE
P VALUE, PROB > F
LINEAR 0.31 9.00 0.034
2FI 0.29 6.00 0.049
QUADRATIC 0.03 3.00 0.010
CUBIC 0.00 0.00
PURE
ERROR 0.00 4.00 0.000
TABLEVII
MODELSUMMARYSTATISTICS
Model Summary Statistics
SOURC E
ST D DE V.
R- SQUA RED
ADJU STED R-SQUA RED
PREDI CTED R-SQUAR ED
PR
ESS
LINEA R
0.1 5
0.97 0.96 0.9525 0.49
2FI
0.1 7
0.97 0.95 0.9177 0.86
QUADR ATIC
0.0 67
0.99 0.99 0.9516 0.50 Sugge sted
CUBIC
0.0 00
1.00 1.00 + Aliase d
E. Mathematical Model for Cutting Rate
The regression coefficients of the second order equation are obtained by using the experimental data (Table III).
The regression equation for the cutting rate as a function of five input process variables was developed using experimental data and is given below. The coefficients (insignificant identified from ANOVA) of some terms of the quadratic equation have been omitted.
MRR = 3.1830 + 0.0145 * Pulse On - 0.2761 * Pulse off - 0.2115 * Peak Current - 3.90625E-07* Pulse On* Pulse off +0.0021 * Pulse On * Peak Current + 0.000253 * Pulse On^2 +0.0077 * Pulse off^2+ 0.0481 * Peak Current^2
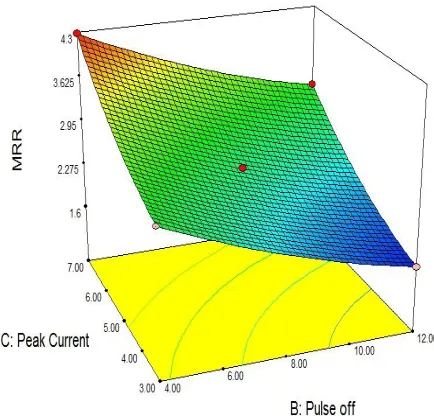
[image:6.612.332.563.449.612.2]The above response surface is plotted to study the effect of process variables on the cutting rate and is shown in Figures 4 to 6. From Figure 6 the cutting rate is found to have an increasing trend with the increase of pulse on time and at the same time it decreases with the increase of pulse off time. This establishes the fact that cutting rate is proportional to the energy consumed during machining and is dependent not only on the energy contained in a pulse determining the crater size, but also on the applied energy rate or power. It is seen from Figure 5 and 6 that cutting rate increases with increase in the peak current values. The higher is the peak current setting, the larger is the discharge energy. This leads to increase in cutting rate. But, the sensitivity of the peak current setting on the cutting performance is stronger than that of the pulse on time. While the peak current setting is too high, wire breakage may occur frequently.
International Journal of Emerging Technology and Advanced Engineering
Website: www.ijetae.com (ISSN 2250-2459,ISO 9001:2008 Certified Journal, Volume 3, Issue 4, April 2013)
266
[image:7.612.329.567.123.402.2]Figure 5:- Combined Response of Pulse ON and Pulse OFF
Figure 6:- Combined Response of Pulse Off and Peak Current F. Residual Analysis
The residual analysis as a primary diagnostic tool is also done. Normal probability plot of residuals has been drawn (Figure 7). All the data points are following the straight line. Thus the data is normally distributed.
Figure 7:- Normal plot of Residual
V. CONCLUSION
From the experiments that were conducted on Inconel-600 material in Wire Cut EDM and the RSM models developed, the following interesting conclusions were drawn.
1. The effects of Pulse On time, Pulse Off time, Peak
Current, Wire Feed rate setting are experimentally investigated in machining of Inconel-600 using CNC Wire-cut EDM process. The level of importance of the machining parameters on the material removal rate is determined by using ANOVA and it is shown that Pulse on, Pulse Off, Pea current are most significant
2. An optimum parametric combination for the
[image:7.612.60.277.308.516.2]International Journal of Emerging Technology and Advanced Engineering
Website: www.ijetae.com (ISSN 2250-2459,ISO 9001:2008 Certified Journal, Volume 3, Issue 4, April 2013)
267
3.The developed mathematical model, i.e Response
surface Model for the performance characteristic such as Material removal rate (MRR) in the CNC Wire-cut EDM process is successfully proposed for the proper selection of the machining parameters.
Acknowledgement
The authors would like to acknowledge the support of
Gujarat Technological University, in particularly
Mechanical Department of L.D. Engineering College, Ahmedabad and all those who contributed direct or indirectly are thanked.
REFERENCES
[1 ] J.L. Lin, K.S. Wang, B.H. Yan, Y.S. Tarng (2000) ―Optimization of the electrical discharge machining process based on the Taguchi method with fuzzy logics ― Journal of Material Processing and Technology, Vol. 102, pp 48-55.
[2 ] Thillaivanan. A, Asokan. P, Srinivasan. K. N, Saravanan. R, (2010), ―Optimization of operating parameters for EDM process based on the Taguchi method and Artificial Neural Network ―, International Journal of Engineering Science and Technology, Vol. 2(12), 6880-6888
[3 ] Phillip J. Ross. Taguchi techniques for quality engineering, McGraw-Hill Book company, New York.
[4 ] Muthu Kumar, Suresh Babu, et all, ― Optimization of the WEDM Parameters on Machining Incoloy800 Super alloy with Multiple Quality Characteristics‖ International journal of Engineering and Science and technology, Vol. 2(6), 2010, 1538-1547.
[5 ] Asif Iqbal and Ahsan Ali Khan, ― Modeling and Analysis of MRR, EWR and Surface Roughness in EDM Milling through Response Surface Methodology‖, American J. of Engineering and Applied Sciences 3 (4): 611-619, 2010
[6 ] Mohan Kumar Pradhan and Chandan Kumar Biswas, ―Modelling of
machining parameters for MRR in EDM using response surface methodology‖, Proceedings of NCMSTA’08 Conference National Conference on Mechanism Science and Technology: from Theory to Application November 13-14, 2008
[7 ] Shandilya Pragya, Jain. P. K, Jain. N. k. (2012), ―Parametric optimization during wire electrical discharge machining using response surface methodology‖ Procedia Engineering, 38, 2371 – 2377
[8 ] Pal Surajit, Gauri Susanta Kumar, (2010), ―Assessing effectiveness of the various performance metrics for multi-response optimization using multiple regression‖, Computers & Industrial Engineering, 59, 976–98
[9 ] H. Singh, R. Garg, ―Effect of process parameters on material removal rate‖, Journal of Achievements in materials and manufacturing, vol 32 (2009), pp. 72-74
[10 ]S.S. Mahapatra & Amar Patnaik, ― Optimisation of wire electrical discharge machining (WEDM) process parameter using Taguchi method‖, International Journal of Advance Manufacturing and Technology, (2007) 34 pp 911-925
[11 ]Rao Pujari Srinivasa, Ramji Koona, Satyanarayana Beela(2011), ―Effect of WEDM conditions on surface roughness: A prapmetric optimisation using taguchi method‖ , International Journal of Engineering Science and Technology, Vol No. 6, Issue No. 1, 041 – 048
[12 ]Garg Rohit, PhD Thesis, ―Effect of process parameters on performance measures of wire electrical discharge machining‖ National Institute of Technology, Kurukshetra, MAY, 2010 [13 ]Basheer, A. C., Dabade, U. A., Joshi, S. S., Bhanuprasad, V. V., &
Gadre, V. M. (2008). Modeling of surface roughness in precision machining of metal matrix composites using ANN. Journal of Materials Processing Technology, 197, 439–444.