Journal of Chemical and Pharmaceutical Research, 2014, 6(6):2675-2679
Research Article
CODEN(USA) : JCPRC5
ISSN : 0975-7384
Remote sensing image segmentation based on ant colony optimized
fuzzy C-means clustering
Jingfeng Yan
School of Information Engineering, Xuchang University, Henan, China
_____________________________________________________________________________________________
ABSTRACT
Middle spatial resolution multi-spectral remote sensing image is a kind of color image with low contrast, fuzzy boundaries and informative features. In view of these features, the fuzzy C-means clustering algorithm is an ideal choice for image segmentation. However, fuzzy C-means clustering algorithm requires a pre-specified number of clusters and costs large computation time, which is easy to fall into local optimal solution. In order to overcome these shortcomings, ant colony algorithm is employed to optimize fuzzy C-means algorithm in remote sensing image segmentation. First, the centers and number of clusters is determined by ant colony optimization algorithm. Then the initialization fuzzy C-means algorithm is used for remote sensing image classification. Experimental results show that the ant colony optimization is an effective method to solve the problem of fuzzy C-means algorithm in remote sensing image segmentation and the visual interpretation of segmentation is much improved by proposed ant colony optimized C-means clustering.
Keywords: remote sensing, image segmentation, fuzzy C-means algorithm, ant colony optimization.
_____________________________________________________________________________________________
INTRODUCTION
With the development of remote sensing technology, remote sensing images plays a significant role in geographical conditions monitoring, i.e. flooding, forest fires, crop healthy, etc. Remote sensing image segmentation is a prerequisite for remote sensing image processing and understanding. Thus improving segmentation accuracy is an important issue to ensure effective follow-up work in remote sensing image processing.
Image segmentation is a technique to divide the image into non-overlapping regions and extract target of interest. Middle spatial resolution multi-spectral remote sensing image is a kind of color image with low contrast, fuzzy boundaries and informative features. The literature reviews that fuzzy C-means algorithm is an idea choice for remote sensing image segmentation [1-3]. However, fuzzy C-means clustering algorithm requires a pre-specified number of clusters and costs large computation time, which is easy to fall into local optimal solution [4]. Thus, many researchers proposed improved fuzzy C-means segmentation algorithms. Ant colony optimization algorithm is originally developed by Dorigo (1991), which is essentially a sophisticated intelligence system with strong robustness, excellent distributed computation and easy to be combined with other methods [5-6]. In recent years, with the rapid development of ant colony algorithm in image processing, ant colony algorithm is used to improve image segmentation results [7-9]. In order to overcome these shortcomings, ant colony algorithm is employed to optimize fuzzy C-means algorithm in remote sensing image segmentation. First, the centers and number of clusters is determined by ant colony optimization algorithm. Then the initialization fuzzy C-means algorithm is used for remote sensing image classification.
algorithm and ant colony optimization, respectively. Section 4 gives the proposed method. Experimental result is shown in section 5. Conclusions are made in section 6.
2 Basic fuzzy C-means algorithm
Fuzzy c-means (FCM) clustering is a method which allows one piece of data to belong to two or more clusters. The basic idea of fuzzy C-means clustering algorithm is as follows.
Let
X
=
{
x
1,
x
2,...,
x
n}
indicates the number of n pixels in the image. Thus, the image segmentation is transformed to the clustering of n samples. LetV
i=
{
i
=
1
,
2
,...,
c
}
is the center of clusters.{
i
c
k
n
}
U
ik=
=
1
,
2
,...,
;
=
1
,
2
,...,
is the membership of the kth sample to the ith class, where0
≤
U
ik≤
1
and
∑
=≤
≤
n k ikn
U
10
. Thus the object function of FCM is as follows:(
)
21 1
,
(1)
c n m
m ik k i
i k
J
U V
U
x
v
= =
=
∑∑
×
−
where
U
=
{ }
U
ik ,V
=
(
v
1,
v
2,...,
v
c)
,m
>
1
,the constrain condition is1
1
=
∑
= c i ikU
∀
k
=
1
,
2
,...,
n
The optimal solution of object function in FCM can be obtained by updating membership matrix U and cluster center V iteratively.
2 1
1
1
,
,
(2)
ij
m c
j i
k j k
U
i
c j
n
u
v
u
v
− ==
≤
≤
−
−
∑
( )
( )
, 1 1,
(3)
n m i k k k i n m ik kU
x
V
i
c
U
==
=
∑
≤
∑
Updating membership matrix U and cluster center V according to equation (2) and (3) until the changed value of
V
iis less than
ε
(
ε
>
0
)
.3 Ant colony optimization algorithm
Ant colony optimization (ACO) algorithm is a novel simulated evolutionary algorithm [10-11]. Image segmentation based on ant colony algorithms can be taken as the process of clustering pixels of different characteristics, which is similar to the process of ants in finding food source. As we know, ants can always find the optimal path to a source of food in nature environments. Thus, the process of image segmentation based on ant colony is as follows: each pixel of the image is taken as an ant and the cluster center is taken as food source. As the visual range of ant is small, so in the beginning, the search is blind. However, the ants will leave pheromone on the path. The other ants determine the direction of search according to the amount of pheromone and leave their own pheromone on the path. After many cycles, the ants will leave more pheromone on the optimal path, which leads more ants pass on it. The searching process is a positive feedback mechanism and the ants will have their own way to find the optimal path.
An ant is a simple computational agent in the ant colony optimization algorithm. In general, the kth ant moves from state x to state y with probability:
( )( )
( )( )
(4)
When all the ants have computed a solution, the trails are updated by
(
1
)
k(5)
xy xy xy
k
τ
← −
ρ τ
+
∑
∆
τ
where
ρ
is the pheromone evaporation coefficient? It is set to 0.1 in our experiment.4 Proposed ACO-FCM algorithm
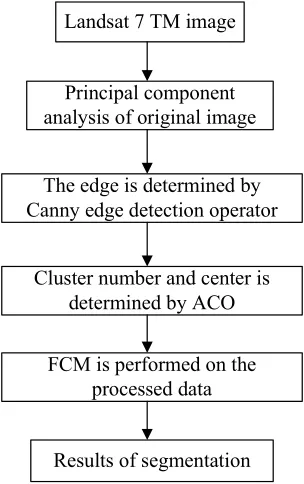
In this paper, according to the advantages of fuzzy C-means clustering and ant colony optimization, an ACO-FCM algorithm is proposed to improve the segmentation accuracy of remote sensing image. The flow chart of ACO-FCM is shown in figure 1.
Landsat 7 TM image
Principal component analysis of original image
The edge is determined by Canny edge detection operator
Cluster number and center is determined by ACO
FCM is performed on the processed data
[image:3.595.230.382.206.448.2]Results of segmentation
Figure 1 the flow chart of ACO-FCM
Landsat 7 TM image includes 7 bands, i.e. blue, green, red, near-infrared, mid-infrared, thermal infrared and mid-infrared band. The spatial resolution of Landsat 7 TM image is 30 meter except the thermal infrared band. Thus only the bands with 30 meter are considered for segmentation. The principal component analysis is performed on the multi-spectral image to reduce the band dimensions. The first principal component which contains more than 80% information of the original image is used for the following process. The canny edge detection is performed on the first principal component. The edge information is obtained as the input of ant colony optimization algorithm. The number and center of clusters determined by ACO is taken as the input of fuzzy C-means clustering. The final result of segmentation is obtained by our proposed ACO-FCM.
RESULTS
Figure 2. Original Landsat TM image shown in band 5, band 4 and band 3
(a) The result of ACO algorithm (b) the result of ACO-FCM Figure 3 The results of proposed ACO-FCM
The experimental results are shown in figure 3. Form figure 3(a), it can be seen that though the edge could be detected easily from the initial results of ACO, many obvious black points exist in the result image. In fact, the black points are the unclassified pixels in ACO. The FCM is performed on the result of ACO, which is shown in figure 3(b). From figure 3(b), it can be seen that the segmented result is obvious. The impervious area could be detected well. The experimental results show that our proposed ACO-FCM performs well for the mid-spatial resolution remote sensing images.
CONCLUSION
Acknowledgement
This work was supported in part by the Foundation of Henan Important Science Research Project under Grant No.122102210488, 132102210095 and Young Core Teachers of Xuchang University and the Foundation of Xuchang Science Research Project under Grant No. 1101029.
REFERENCES
[1]Dulyakarn P and Rangsanseri Y. Fuzzy c-means clustering using spatial information with application to remote sensing, The 22nd Asian Conference on Remote Sensing ,Singapore, 2001, 5-9.
[2]J. Fan, M. Han, and J. Wang, Pattern Recognition, 2009,42(11), 2527-2540.
[3]C.-C. Hung, S. Kulkarni, and B.-C. Kuo, Selected Topics in Signal Processing , 2011,5(3), 543-553.
[4]W. Ma, L. Jiao, M. Gong, and C. Li, International Journal of Machine Learning and Cybernetics, 2013,6(1), 1-9. [5]Shibin Xuan, Yiguang Liu and Zhisheng You. Journal of Information and Computational Science, 2010, 7(13) ,2771-2779
[6]M. Dorigo, G. Di Caro, and L. M. Gambardella, Artificial life, 1999, 5(2), 137-172. [7]Y. Han, and P. Shi, Neuro-computing, 2007, 70(4), 665-671.
[8]N. Montazeri, M. J. S. Zadeh, and M. M. Javidi, J. Appl. Environ. Biol. Sci, 2013, 3(12), 30-33.
[9]Wenping Liu, Tianyi Cui, Chih-Cheng Hung, and Shihong Chen. Journal of Information and Computational Science, 2013, 10(7), 2009–2020.
[10] S. Li, S. Wang, and Q. Zhang, The international society optics and photonics, 2006, 5(2), 55-58.