OPTIMIZATION OF NEW SEMI-AUTOMATIC TIG WELDING PROCESS FOR SURFACE QUALITY THROUGH TAGUCHI METHOD
MOHD KHAIRULAMZARI BIN HAMJAH
A project report submitted in partial Fulfilment the requirement for the award of the
Degree of Master of Mechanical Engineering
Faculty of Mechanical and Manufacturing Engineering University Tun Hussein Onn Malaysia
ABSTRACT
ABSTRAK
Tungsten inert gas (TIG) adalah kaedah kimpalan yang tidak meleburkan
CONTENTS
TITLE i
DECLARATION ii
DEDICATION iii
ACKNOWLEDGEMENT iv
ABSTRACT v
CONTENT vii
LIST OF TABLE x
LIST OF FIGURES xii
LIST OF SYMBOLS AND ABBREVIATIONS xv
LIST OF APPENDICES xvii
CHAPTER 1 INTRODUCTION 1
1.1 Background of Research Project. 1
1.2 Problem Statement 2
1.3 Objective 3
1.4 Scope of Research Work 3
1.5 Hypothesis 4
1.6 Dissertation Content. 4
CHAPTER 2 LITERATURE REVIEW 6
2.1 Tungsten Inert Gas (TIG) 6
2.2 Weld bead geometry 8
2.3 Parameter selection 10
CHAPTER 3 METHODOLOGY 18
3.1 Introduction 18
3.2 Research project methodology. 18
3.3 Robust Design of Taguchi Method in
DOE
21
3.4 Semi-Automatic TIG Machine 23
3.5 Research project sample 24
3.6 Validation of the sample 25
3.7 Materials testing 27
3.7.1 Dye Penetrant Inspection (DPI) 27
3.7.2 Surface Roughness Test 28
3.7.3 Surface Hardness Test 30
3.8 Taguchi data analysis 31
3.9 Data prediction 32
CHAPTER 4 EXPERIMENT SETUP 33
4.1 Experiment detail 33
4.2 Inspection for validation 42
CHAPTER 5 RESULT AND DISCUSSION 47
5.1 Preliminary result 47
5.2 Sample result 52
5.3 Collection data result 53
5.4 Analysis of Varian (ANOVA) 55
5.4.1 Surface Roughness ANOVA 55
5.4.2 Surface Hardness ANOVA 59
5.5 Optimization analysis 62
5.5.1 Surface roughness optimization 62
5.5.2 Surface hardness optimization 64
5.6 Prediction analysis 67
CHAPTER 6 CONCLUSION AND FUTURE DEVELOPMENT 76
6.1 Novelty of the research 76
6.2 Conclusion 78
6.3 Future development 80
REFERENCES 81
LIST OF TABLE
2.1 Pulse Parameter Test 14
2.2 Materials Influence on Inner bead Surface roughness 14 2.3 Results of ANOVA for the weld pool geometry (S.C.
Juang, Y.S. Tang, 2002)
15
2.4 Surface roughness of the different specimens of AA6082.52 and AA6082.50, both in T6 temper condition. (Utne, 2013)
16
2.5 Results obtained from hardness measuring for tested samples.
16
3.1 DOE factor and level 21
3.2 Constant parameter (factor) 22
3.3 Robust Taguchi Design Matrix 22
4.1 Composition for Substrate (base metal) 34
4.2 Composition for Filler Metal ER70S-6 38
5.1 Result Surface Roughness and Surface Hardness 54
5.2 Surface roughness ANOVA for SN ratios (Single Bead) 56
5.3 ANOVA for SN ratios (Padding Bead) 58
5.4 Surface hardness ANOVA for SN Ratio (Single Bead) 59 5.5 Surface hardness ANOVA for SN ratio (Padding Bead) 61 5.6 Response Table for Signal to Noise Ratios Single Bead.
(Smaller is better)
62
5.7 Response Table for Signal to Noise Ratios Padding Bead (smaller is better)
64
5.8 Response Table for Signal to Noise Ratios Single Bead (larger is better)
65
Bead (larger is better)
5.10 Surface Roughness Factor levels for predictions 68 5.11 Surface Hardness Factor levels for predictions 68
5.12 SN ratio Mean value of the experiment 69
5.13 Surface Roughness Comparison 72
LIST OF FIGURES
2.1 Basic diagram of the conventional TIG circuit 7
2.2 Sketch of overlapping model by Yong Cao et al. 8
2.3 Parabolic cross-sectional profile of the bead 9
2.4 Multi-bead profile in the initial model 9
2.5 Overlap volume equal to volume of valley. 9
2.6 Automatic rapid prototyping VP-GTAW 13
2.7 Graph for variations of hardness versus distance for welded samples
17
3.1 Research project flow chart 20
3.2 Semi-automatic TIG machine schematic drawing by AutoCAD
23
3.3 Sample 1A (a) Single and (b) padding weld bead sample
24
3.4 Weld bead height 26
3.5 WG-4 Weld Gauge or Bridge Cam Gauge 26
3.6 DPI spray can, (1&3) Cleaner (2) Penetrant and (4) Developer.
28
3.7 Mitutoyo SJ-400 machine 29
3.8 Wilson Rockwell (HRA) hardness tester machine 30
4.1 Substrate (base sample) of the experiment 35
4.2 Single and padding weld bead diagram 36
4.3 TIG Miller Syncrowave 250 DX OC. AC/DC Squarewave Panel
37
4.4 UNI-ARC MIG 200C panel 38
4.5 Semi-Automatic TIG welding setup. 39
4.7 Substrate (base metal) placement 41
4.8 Arm support with bracket 42
4.9 Weld gauge inspection 43
4.10 DPI inspection on the sample 44
4.11 Mitutoyo SJ-400 sample mounting. 45
4.12 Wilson Rockwell (HRA) Sample mounting 46
5.1 Manual preliminary sample single bead (a) 140A (b) 180A
48
5.2 Pre-run Sample (a) 140A (b) 150 A (c) 170A (d) 180A Semi-automatic Preliminary sample (single bead).
49
5.3 Pre run Sample (A) padding bead and (B) overlap bead sample
50
5.4 Area of the cutting pre-run sample 51
5.5 Cross section profile of weld bead 51
5.6 Sample 1A 52
5.7 Surface roughness Residual plot for SN ratios (Single Bead)
57
5.8 Residual plot for SN Ratios (Padding Bead) 58
5.9 Residual plot for SN Ratios (Single Bead) 60
5.10 Residual plot for SN Ratios (Padding Bead) 61
5.11 Parameter effect for SN Ratios (Single Bead) 63
5.12 Parameter effect for SN Ratios (Padding Bead) 64 5.13 Response Table for SN Ratio Single Bead (larger is
better)
65
5.14 Response Table for SN Ratio Padding Bead (larger is better)
67
5.15 Graph SNRA1 and Mean1 of Surface Roughness (Ra) 70 5.16 Graph SNRA2 and Mean2 of Surface Hardness (HRA) 71
5.17 Graph Surface Roughness Comparison 72
5.18 Graph Surface Hardness Comparison 73
5.19 Optimized Sample 6A 74
5.20 DPI test on sample 6A 75
6.2 Semi-automatic TIG machine patent by (Imaizumi, Kato, & Nakashim, 1998)
LIST OF SYMBOLS AND ABBREVIATIONS
TIG - Tungsten Inert Gas RP - Rapid Prototyping
FRGS Fundamental Research Grant Scheme NDT - Non-destructive test
DOE - Design of Experiment
AISI - American Iron and Steel Institute DPI - Dye Penetrant Inspection
HAZ - Heat Affected Zone ANOVA - Analysis of variance
DC - Direct Current
ACHF Alternating Current of High Frequency GTAW - Gas Tungsten Arc Welding
RSM - Response Surface Methodology
Ra Mean surface roughness
l - Bead length
w/2 - Half of the bead width h - Height of the bead (p) - Step over increment CFH - Cubic foot per hour LPM - Litter per minute DT - Destructive test MIG - Metal Inert Gas
DCSP Direct Current Straight Positive
V Volt
A Ampere
ASTM - American Society for Testing and Materials
Ry maximum height
Rz ten-point mean roughness
Sm mean spacing of profile irregularities S mean spacing of local peaks of the profile tp profile bearing length ratio
EWTh - E-Electrode W-Tungsten Th-Thorium
EWP - P-pure
ER70-S6 - ER-Electrode S-Solid
JIS Japan International Standards AC - Alternating Current
ANNs Artificial Neural Networks DCHF - Direct Current High Frequency
ANSI - American National Standards Institute BS - British standard
F - F-test
HRA Hardness Rockwell (A)
SS Sum of squares
DF Degree of freedom
MS Mean Square
C Contribution
SN - Signal to noise
means - Means
Fe - Ferum
C - Carbon
Mn - Manganese
P - Phosphorus
S - Sulphur
Ar - Argon
LIST OF APPENDICES
APPENDIX TITLE PAGE
A Samples 84
CHAPTER 1
INTRODUCTION
Tungsten inert gas (TIG) is a process used for joining pieces of metal, and probably, the most successful and widely used welding method in industry today. The weld bead can also perform as a deposited layer on top of the substrate (base metal). The surface quality of a weld bead is a crucial issue in welding, and in many cases a weld must fulfil some specific quality requirements. However, it is very difficult to find the best parameter setup to control the TIG process and it might not be possible to achieve the desired weld quality. Therefore this chapter will express the direction of the research project.
1.1 Background of Research Project
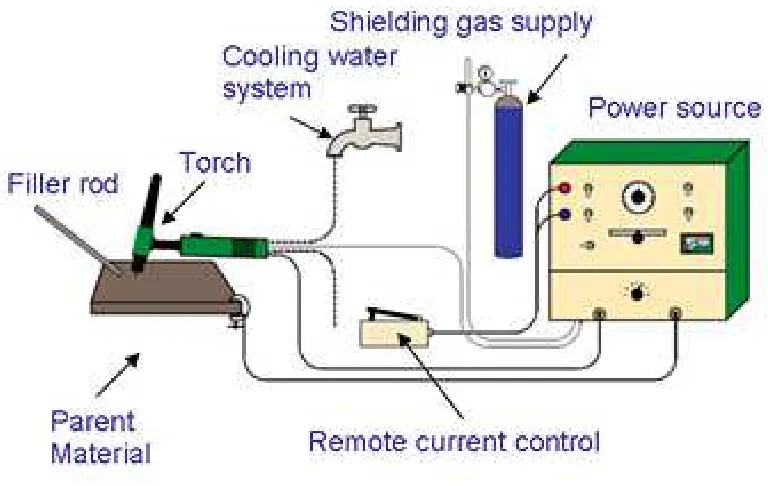
The greatest advantage of the TIG process is that it can weld more types of metal and alloy than any other arc welding process. TIG can also weld dissimilar metals to one another such as copper to brass and stainless to mild steel (TIG Handbook for GTAW). Basically, TIG weld quality is strongly characterized by the weld pool geometry. This is because the weld pool geometry plays an important role in determining the mechanical properties of the weld. Therefore, it is very important to select the welding process parameters for obtaining optimal weld pool geometry (X.M. Zeng, J. Lucas, M.T.C. Fang, 1993) (C.E. Bull, K.A. Stacey, R. Calcraft, 1993) (Y.M. Zhang, R. Kovacevic, L. Li, 1996) (S.C. Juang, Y.S. Tarng, H.R. Lii, 1998) (Y.S. Tarng, H.L. Tsai, S.S. Yeh, 1989). Traditional TIG welding process yield good weld quality and is one of the frequently used welding processes for aluminium and stainless steel.
1.2 Problem Statement
Many researchers are still working on the parameter selection to produce the best weld pool surface by using automatic TIG system. But getting the optimal surface quality of weld bead is something which is still not fully discovered yet. Researchers (Xinhong Xiong, Haiou Zhangb, Guilan Wang, 2009) has mentioned that the accuracy and surface quality of the metallic parts and tools using direct metal prototyping techniques are still low compared to conventionally machined parts. Most of the rapid prototyping (RP) methods still need post processing such as milling and polishing as surface finishing. Based on this reason, this research project will focus on the parameter selection to achieve the goal of increasing the accuracy as well as the surface quality and strengthening the body of the weld bead by using semi-automatic TIG setup. Semi-automatic TIG is very easy to setup and can be customized by using conventional TIG welding equipment.
1.3 Objective
i. To identify the welding process parameter of surface quality through Taguchi method
ii. To analyse surface quality of the weld bead geometry through mechanical and Non-destructive Testing (NDT) method.
1.4 Scope of Research Work
i. Design of Experiment (DOE) using Taguchi Method for optimizing problem will be implemented.
iii. Parameter study will focus on Voltage, Gas flow rate, filler wire diameter, Arc gap (mm), Flow rate (l/min) and wire feed angle as constant parameter. While Welding current (Ampere), Welding speed (travel speed), Wire feed rate will be set as variable parameter.
iv. Samples are test using NDT (Dye Penetrant Inspection).
v. Analysis, surface roughness and hardness test are inspecting onto weld bed (deposited layer)
vi. Software tool Minitab 16 will be used to analyse the optimization and analyses of the variance (ANOVA).
vii. Heat Affected Zone (HAZ) area will not be considered for this research project because the main focus is to analyse the surface quality of the weld bead.
1.5 Hypothesis
It is hypothesized that, travel speed; wire feed rate and ampere as a selection parameter setup will provide optimization value on the surface quality of the weld bead.
1.6 Dissertation Content.
CHAPTER 2
LITERATURE REVIEW
This chapter will explore the literature relevant to the concept of TIG and semi-automatic TIG technology. In literature review, the related ideas and findings from previous researchers will be discussed and special attention on surface quality that converges to the research project will be focussed upon.
2.1 Tungsten Inert Gas (TIG)
for GTAW) (Miller Electric Manufacturing Co., 2013). Figure 2.1 shows the basic diagram of the conventional TIG circuit.
Figure 2.1: Basic diagram of the conventional TIG circuit.
(H Wang, R Kovacevic, 2001). But none these researchers came out with the result to improve the surface roughness of weld bead.
2.2 Weld bead geometry
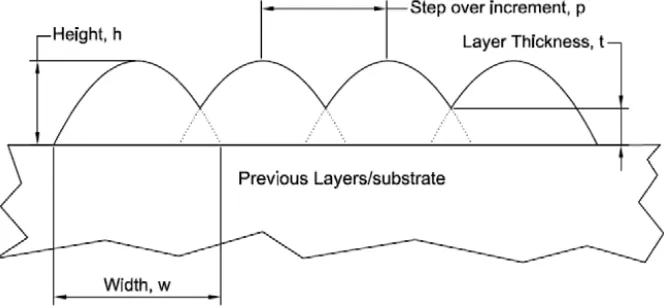
In order to find the parameter optimization, study on the weld bead profile is needed. (Yong Cao, Sheng Zhu, Xiubing Liang, Wanglong Wang, 2011) stated that the sectional geometry of single-pass bead and the overlap of the adjacent beads have critical effects on the dimensional accuracy and quality of metal parts and the conclusion is that the edge detection of bead section with Canny operator is continuous and distinct, and as compared with Gaussian function, logistic function and parabola function, sine function has higher accuracy to fit the measured data, and ‘‘surfacing of equivalent area’’ method shows to be rational and feasible by the experiments. Figure 2.2 shows sketch of overlapping model by Yong Cao et al.
Figure2.2: Sketch of overlapping model by Yong Cao et al.
step over increment (p). In this model, it was assumed that: a) every bead has same cross-sectional profile. b) The parabolic bead profile is unchanged during the overlapping process. S. Suryakumar et al has come out with the improved model, as the step over increment decreases, the overlapping volume increases with a commensurate decrease in the volume of the valley. Therefore, the radius of the fillet increases with the decrease in the step over increment. At some point when these volumes become equal, the fillet will degenerate into a straight line Figure 2.5.
[image:23.595.153.483.415.742.2]Figure 2.3: Parabolic cross-sectional profile of the bead
Figure 2.4: Multi-bead profile in the initial model
[image:23.595.153.485.427.581.2]2.3 Parameter selection
The shape and dimensions of the weld bead are very important in the use of the rapid prototyping system based on a welding technique, because these factors determine the limits of the wall thickness that can be built and influence the quality of the surface finish. Numerous experiments were undertaken to build single beads for a range of welding conditions. The parameters that were varied include the welding current, the welding arc voltage, the welding speed, and the wire-feed speed. The welding current and arc voltage are monitored. Subsequently, the sizes (height and width) are measured of the built weld bead. The four main welding parameters are the welding current, arc voltage, welding speed, and wire-feed speed. When one of the parameters increases, the others are kept constant. (Huijun Wang, Radovan Kovacevic). They also conclude that there are three important keys to the success of the process, namely the preheating of the substrate (base metal), the arc-length monitoring and controlling, and the heat-input controlling. This process allows the components to be made directly and successfully with aluminium alloy. Several parts are made with perfectly acceptable quality for the surface finishing, mechanical characteristics, and dimensions. The influence of welding parameter such as current ratio and pulse frequency on the weld pool shape shows that for a stainless steel the choice of the peak current, background current and pulsed frequency affects considerably the weld pool shape. (A. Tradia, F.Roger, E. Guyot, 2010)
done without additional cost. There are a variety of techniques implementing this method. (Y.S. Tarng, H.L. Tsai, S.S. Yeh, 1989), are using neural network to construct the relationships between welding process parameters and weld pool geometry in tungsten inert gas (TIG) welding. An optimization algorithm called simulated annealing (SA) is then applied to the network for searching the process parameters with optimal weld pool geometry and the quality of aluminium welds based on the weld pool geometry is classified and verified by a fuzzy clustering technique. (Palani.P.K, Saju.M, 2013), has done their study by using Response Surface Methodology (RSM). RSM is a collection of statistical and mathematical techniques useful for developing, improving, and optimizing processes. With this technique, the effect of two or more factors on quality criteria can be investigated and optimum values are obtained. In RSM design there should be at least three levels for each factor. RSM also quantifies relationships among one or more measured responses and the vital input factors. The version 14 of the MINITAB software was used to develop the experimental plan for RSM.
Pridmore, 1989) so that high quality products can be produced quickly and at a lower cost. However, the original Taguchi method has been designed to optimize a single quality characteristic. To consider several quality characteristics together in the selection of process parameters, the Taguchi method must be modified to integrate several loss functions corresponding to different quality characteristics. Therefore, the modified Taguchi method is adopted in this paper to analyse the effect of each welding process parameter, and then to determine the process parameters with the optimal weld pool geometry.
The aim of this research is to get as minimum as possible result on surface roughness. In order to find optimization parameter setup in TIG welding many researchers have done their research by using automatic machine setup. Pervious researcher (Huijun Wang, Wenhui Jiang, Jiahu Quyang, Radovan Kovacevic, 2004) has stated the surface roughness of a deposited wall of a 4043 Al-alloy is found to relate to the direction along which the measurements are taken with respect to the welding. Four directions of surface roughness are examined for each sample: both parallel and perpendicular to the welding direction on the top surface, and the horizontal and vertical directions on both the outside and inside of the walls. It is found that the roughness in the vertical direction on the sidewall is distinctly greater than the horizontal direction. At the top surface, the roughness perpendicular to the welding direction is much greater than the roughness parallel to the welding direction. If a heat input is not controlled, the surface undulations of a deposited wall are found to be directly related to the thickness of the wall. From their study, the average of the surface roughness Ra is 4.67–5.44m. As for verticality of the deposited wall, at present the accuracy is about 5%, and it is expected that it will be reduced eventually to 2% by monitoring welding variables so as to reduce the amplitude of surface ripples Figure 2.6 shown automatic rapid prototyping VP-GTAW on their experiment setup.
Figure 2.6: Automatic rapid prototyping VP-GTAW (Huijun Wang, Wenhui Jiang, Jiahu Quyang, Radovan Kovacevic, 2004)
[image:27.595.149.481.73.309.2]Table 2.1: Pulse Parameter Test (J. Tapp, I.M. Richhrdson and N.J. Woodward)
Weld No High Current
Low
current Movement Roughness Ra (µm) Mean
1 74 25 continuous 1.90
1.84 1.87
2 150 25 continuous 2.18
2.41 2.29
3 120 10 step 3.95
3.92 3.94
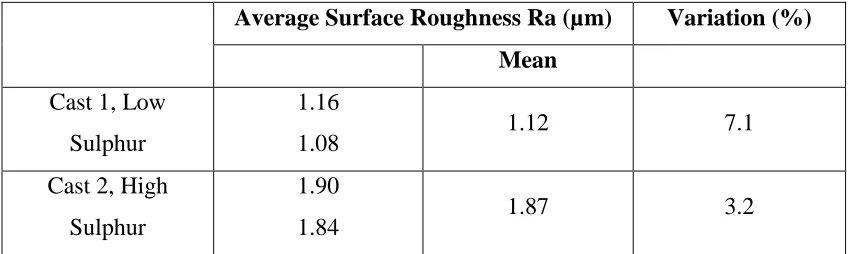
Table 2.2 Materials Influence on Inner bead Surface roughness. (J. Tapp, I.M. Richhrdson and N.J. Woodward)
Average Surface Roughness Ra (µm) Variation (%)
Mean
Cast 1, Low Sulphur
1.16
1.08 1.12 7.1
Cast 2, High Sulphur
1.90
1.84 1.87 3.2
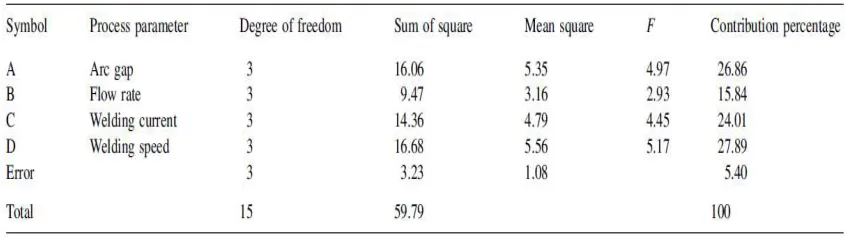
[image:28.595.107.531.337.464.2]Table 2.3: Results of ANOVA for the weld pool geometry (S.C. Juang, Y.S. Tang, 2002)
(J. Raveendra, R. S. Parmar, 1987) have built mathematical models using the fractional factorial technique to predict the weld bead geometry and shape relations (penetration, width to penetration ratio, percentage dilution and reinforcement height). The base metal was a 3 13-mm thick low carbon structural steel plate. The parameters of the FCAW process considered in this work were: arc voltage, welding current, welding speed, gun angle and nozzle-to-plate distance. They have developed models which can be used either to predict the bead geometry or to determine a combination or a range of parameters to obtain the desired bead geometry dimensions within the factors domain. Furthermore, these models can also be used in a production system for automatic control of welding conditions. Some work has been carried out on the influence pf welding conditions on surface notably by (W, 1996) (Schloz. W, Flint. S, 1995), who has investigated difference weldnig processes and evaluated the effects on tweld bead roughnes. The study showed that GTAW and plasma arc welding produce the smotest weld beads. Improvement to the parameter it is possible to significantly reduce weld bead roughness.
Table 2.4: Surface roughness of the different specimens of AA6082.52 and AA6082.50, both in T6 temper condition. (Utne, 2013)
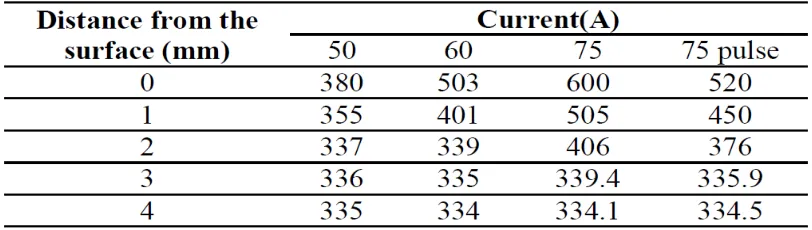
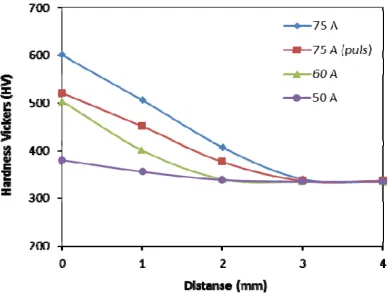
[image:30.595.116.522.650.765.2](Gholamreza Razavi, Gholamreza Zirepour, Mohsen Saboktakin, Hossein Monajati, 2011) has used Laser Beam Welding, Electron Beam Welding, and Plasma Arc Welding to improve surface properties and perform surface hardening.Although welding is recognized as a process for connecting parts, but it is regarded as one of the most important and widely used coating processes through mass-coating on the surface of industrial parts. They found that with a 50A continuous current, the hardness variations are reduced from the sample surface towards center with a mild gradient; but considerable increase in surface hardness has not been obtained compared to base metal. This trend has a steep gradient with a 60A current and the sample has a mean hardness. With a 75A continuous current, the trend of hardness variation has a steep gradient and the maximum surface hardness has been obtained in this state. With a 75A pulsed current, the hardness variations have a mild and slow gradient and the sample has a relatively high hardness. Table 2.5 and Figure 2.7 shows hardness result obtain from (Gholamreza Razavi, Gholamreza Zirepour, Mohsen Saboktakin, Hossein Monajati, 2011).
Figure 2.7: Graph for variations of hardness versus distance for welded samples (Gholamreza Razavi, Gholamreza Zirepour, Mohsen Saboktakin, Hossein Monajati,
2011)
2.5 Conclusion
CHAPTER 3
METHODOLOGY
3.1 Introduction.
This chapter has described the method and procedure to obtain the data and how the data was analysed in this project work. This section is to justify the means in which the research project was obtained and to help in giving it purpose and strength as it will then be truthful and analytical correct. All of these will help in the processing of the data and the formulation of conclusions.
3.2 Research project methodology.
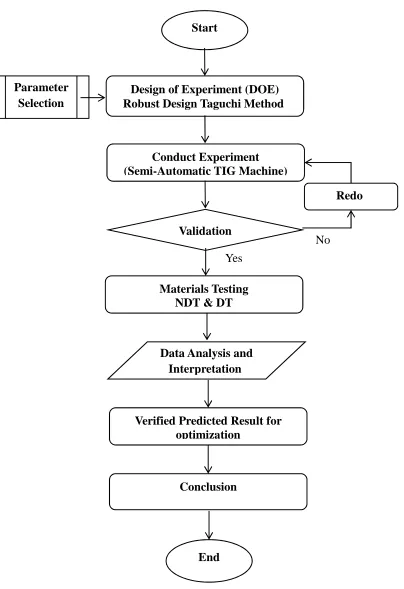
Figure 3.1: Research project flow chart Design of Experiment (DOE)
Robust Design Taguchi Method Start
Conduct Experiment (Semi-Automatic TIG Machine)
Validation
Verified Predicted Result for optimization
Conclusion Data Analysis and
Interpretation Parameter
Selection
Redo
No Yes
Materials Testing NDT & DT
3.3 Robust Design of Taguchi Method in DOE
A Taguchi Design or an orthogonal array is a method of Design of Experiments (DOE) that usually requires only a fraction of the full factorial combinations. An orthogonal array means the design is balanced so that factor levels are weighted equally. Because of this, each factor can be evaluated independently of all the other factors, so the effect of one factor does not influence the estimation of another factor. In robust parameter design, first choose control factors and their levels and choose an orthogonal array appropriate for these control factors. The control factors comprise the inner array. At the same time, determine a set of noise factors, along with an experimental design for this set of factors. The noise factors comprise the outer array. The experiment is carried out by running the complete set of noise factor settings at each combination of control factor settings (at each run). The response data from each run of the noise factors in the outer array are usually aligned in a row, next to the factors settings for that run of the control factors in the inner array.
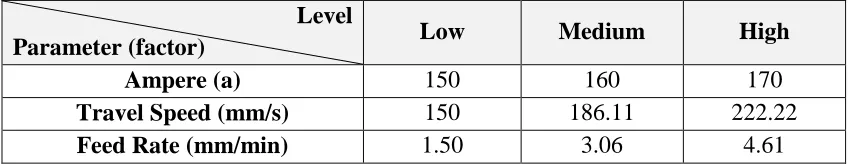
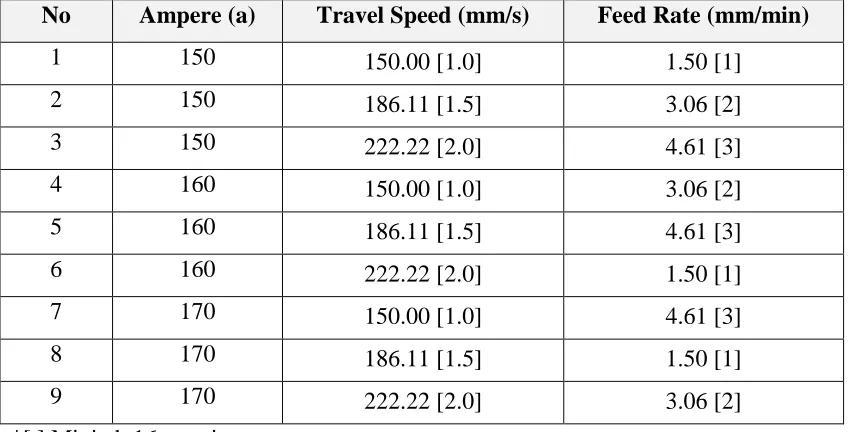
[image:35.595.107.534.685.767.2]In this research project, three (3) parameters that will affect the results were chosen namely Ampere (a) Travel Speed (mm/s) and Feed Rate (mm/min). These parameters we set as a factor with level of three (3). Table 3.1 below shows the DOE factor and level of the research project. The other parameters are set to be a constant factor in Table 3.2. Once the factor and level has been decided, Taguchi Robust Design Matrixes for 3**4 L9 orthogonal arrays are then generated. Table 3.3 shows Robust Design Matrix with three (3) factor, three (3) level and nine (9) runs. The advantage of the Taguchi Method includes helping to study the effect of many factors (variables) on the desired quality most economically. By studying the effect of individual factors on the results, the best factor combination can be determined.
Table 3.1: DOE factor and level
Level
Parameter (factor) Low Medium High
Ampere (a) 150 160 170
Travel Speed (mm/s) 150 186.11 222.22
Table 3.2: Constant parameter (factor)
Parameter (factor) Low
voltage 415 V
Arc gap 3 mm
Torch angle 80 o
Wire feed angle 30 o
Wire feed size 0.8 mm
Electrode size 2.4 mm
Cup size 6
Colet size 2.4
Argon flow 17 CFH (8 l/min) 20 Psi
Polarity Electrode negative (DCSP)
Post flow time 9 sec
Table 3.3: Robust Taguchi Design Matrix
No Ampere (a) Travel Speed (mm/s) Feed Rate (mm/min)
1 150 150.00 [1.0] 1.50 [1]
2 150 186.11 [1.5] 3.06 [2]
3 150 222.22 [2.0] 4.61 [3]
4 160 150.00 [1.0] 3.06 [2]
5 160 186.11 [1.5] 4.61 [3]
6 160 222.22 [2.0] 1.50 [1]
7 170 150.00 [1.0] 4.61 [3]
8 170 186.11 [1.5] 1.50 [1]
9 170 222.22 [2.0] 3.06 [2]
[image:36.595.108.533.402.618.2]3.4 Semi-Automatic TIG Machine
[image:37.595.117.527.421.736.2]To perform the experiment, Semi-automatic TIG machine were customized. All the equipment was fitted by using conventional TIG equipment. TIG torch was attached to the travel car to make sure the torch is fixed at a setup angle. Wire feed was supplied from the torch of the MIG machine and feeder unit. The wire feeder also fits into an arm support on the travel car. The Travel car will travel on the track and only can perform in straight direction. Control of the Ampere (A), Travel speed and wire feed are done manually for each sample run. Angle of the TIG torch and wire feeder nozzle was set to be a constant variable. In this research project, the Semi-automatic TIG was customized to make sure all the parameters are working in the firm position without any errors. The accuracy of the setup plays a very important point because all data recorded must be valid for analysis. Figure 3.2 shows the drawing of Semi-automatic TIG machine using AutoCAD drawing software.
Figure 3.2: Semi-automatic TIG machine schematic drawing by AutoCAD
Travel car
TIG Torch
MIG Torch MIG Wire feeder
Machine
TIG Machine
Arm Support
3.5 Research project sample
[image:38.595.121.519.422.661.2]Samples will be produced in single bead and padding bead. Figure 3.3 (a) single bead (b) padding weld bead show a photo of the Sample 1A. Each run was replicated for three (3) samples and represented as A, B and C. Before the samples were produced, substrates (base metals) were done with the process of surface grinding. This process is to flatten the substrate (base metal) and remove any dirt and oxides on top of the surface before weld. After the surfaces are cleaned, single bead are produced on top of the surface. To perform padding bead (b), single bead must be done first. After the first weld bead, the sample will be cooled. After which the second run of the weld bead are done on top of the first weld bead. The weld bead starts at the same starting point of the first weld bead. For each replication, the observatory data has been recorded for three (3) times. Illustrations diagram of the samples are shown in the Figure 4.3 in the next chapter.
Figure 3.3: Sample 1A (a) Single and (b) padding weld bead sample
b
REFERENCES
A. Bendell, j. Disney, W.A. Pridmore. (1989). Taguchi Methods : Application in World Industry. UK: IFS Publication.
A. Tradia, F.Roger, E. Guyot. (2010). Optimal parameter for pulsed gas tungsten arc welding in partially and fully penetrated weld pools. International Journal of Thermal Sciences, 49, 1197-1208.
American Welding Society, A. W. (1998). ANSI/AWS D1. 1-98, Reference Manual. American Welding Society. Retrieved from http://www.aws.org.
C.E. Bull, K.A. Stacey, R. Calcraft. (1993). On line weld monitoring using ultrasonic. Nondestructive Testing. 35 (2) 57–64.
Cary, H. (1989). Modern Welding Technology. Englewood NJ: Prentice-Hall. Dongjie Li, Shanping Lu, Wenchao Dong, Dianzhiong Li, Yiyi Li. (2012). 6 Study
of the law between the weld pool shape variations with the welding
parameters under two TIG processes. Materials Procssing Technology, 128-136.
Examination Book of Specifications. (2008). American Welding Society.
Gholamreza Razavi, Gholamreza Zirepour, Mohsen Saboktakin, Hossein Monajati. (2011). Investigation of Enhancing Surface Hardness in Ti-6Al-4V Alloy by. International Conference on Advanced Materials Engineering. Singapore: IACSIT Press.
H Wang, R Kovacevic. (2001). Rapid Prototyping Based On Variable Polarity Gas Tungsten Arc Welding For a 5356 Aluminium Alloy. Proc Instn Mech Engrs Vol 215 Part B, 1519-1527.
H. K. Narang, U. P. Singh, M. M. Mahapatra and P. K. Jha. (2011). Prediction of the Weld Pool Geometry of TIG Arc Welding by Using Fuzzy Logic Controller. International Journal of Engineering, Science and Technology, 3(9), 77-85.
Huijun Wang, Wenhui Jiang, Jiahu Quyang, Radovan Kovacevic. (2004). Rapid prototyping of 4043 Al-Alloy by VP-GTAW. Materials Processing Technology, 148, 93-102.
Imaizumi, H., Kato, T., & Nakashim, H. (1998). Patent No. 5789717. Japan/Tokyo. J. Tapp, I.M. Richhrdson and N.J. Woodward. (n.d.). Factors Influencing Inner Bead
Surface Roughness in GTA Welded Stainless Steel Pipelines. Jeffus, L. F. (2004). Welding, 5e: Principles and Applications.
Miller Electric Manufacturing Co. (2013). Retrieved May 30, 2013, from Miller Electric Manufacturing Co. Web Site:
http://www.millerwelds.com/resources/TIGhandbook/
Minitab Inc. (2014). Retrieved January 21, 2014, from Minitab Inc. Web Site: http://www.minitab.com/en-US/products/minitab/free-trial.aspx
Misumi Corporation. (2014). Retrieved January 20, 2014, from Misumi Corporation Web Site: http://us.misumi-ec.com/pdf/press/us_12e_pr1257.pdf
Montgomery, C. (1991.). Design and Analysis of Experiments. Singapore: Wiley. Palani.P.K, Saju.M. (2013). Modelling and Optimization of process Parameter for
TIG Welding of Aluminium-65032 Using Response Surface Methodology. International Journal of engineering research and Applications, 230-236.
Peace, G. (1993). Taguchi Methods: A Hand-on Approach. MA: Addison Wesley. S. Suryakumar, K.P. Karunakaran, Alain Bernard, U. Chandrasekhar, N
Raghavender, Deepak Sharma. (2011). Wled bead modeling and process optimization in Hybrid layerd Manufacturing. Computer Aided Design, 43, 331-334.
S. Suryakumar, K.P. Karunakaran, Alain Bernard, U. Chandrasekhar, N
Raghavender, Deepak Sharma. (2011). Wled bead modeling and process optimization in Hybrid layerd Manufacturing. Computer Aided Design, 43, 331-334.
S.C. Juang, Y.S. Tang. (2002). Process parameter selection for optimizing the weld pool geometry in the Tungsten Inert Gas welding of stainless steel. Journal of Materials Processing Technology(122), 33-37.
S.C. Juang, Y.S. Tarng, H.R. Lii. (1998). A comparison between the
backpropagation and counter-propagation networks in the modeling of the TIG welding process. 75 54–62.
Ugur Esme, Melih Bayramoglu, Yugut Kazancoglu, Sueda Ozgun. (2009).
Optimization of Weld Bead Geometry in Tig Welding Process Using Grey Relation Analysis and Taguchi Method. Materials and technology, 143-149. Utne, S. C. (2013). Fatigue of Welded AA6082 Alloys - Effects of PWHT and Shot
Peening. Trondheim, Norway: Norwegian University of Science and Technology.
X.M. Zeng, J. Lucas, M.T.C. Fang. (1993). Use of neural networks for parameter prediction and quality inspection in tungsten inert gas welding. 15 (2) 87–95. Xinhong Xiong, Haiou Zhangb, Guilan Wang. (2009). Metal direct prototyping by
using hybrid plasma deposition and milling. Materials Processing Technology, 209, 124-130.
Y.M. Zhang, R. Kovacevic, L. Li. (1996). 36 (7) 799–816.
Y.S. Tarng, H.L. Tsai, S.S. Yeh. (1989). Modeling, optimization and classification of weld quality in TIG welding. International Journal of Machine Tools & Manufacture, 39 (9)1427–1438, 1427-1438.