International Journal of Emerging Technology and Advanced Engineering
Website: www.ijetae.com (ISSN 2250-2459,ISO 9001:2008 Certified Journal, Volume 2, Issue 12, December 2012)
289
Analysis and Detection of Dyscalculia at Early Age Using
Computer Assisted Friendly Tests [CrAFT]
Dr. Seema Purohit
1, Sampada Margaj
21Dept. of Mathematics, Kirti College, and NMITD, Mumbai, India. 2
Dept. of Computer Science, Kirti College, Mumbai, India.
Abstract — The term "learning disability" describes a
neurobiological disorder in which a person's brain works differently. These differences interfere with a person's ability to think and remember. Learning disabilities can affect a person's ability to speak, listen, read, write, spell, reason, recall, organize information, and do mathematics. Researcher has tried to study the three types of learning disabilities: Dyslexia, Dysgraphia and Dyscalculia.
Out of which only Dyscalculia is discussed in this paper. The computer assisted system has been developed for identifying the Dyscalculia child at an early stage. Researcher developed the questionnaire mainly based on the areas where a dyscalculic faces difficulties. Once the data collected from a set of students, based on the responses the Computerised system identifies a dyscalculia child.
The approach minimises the effect of educational experience and educational achievement and focuses on basic capacity or inability to understand numbers.
Keywords— CrAFT, Dyscalculia, Dysgraphia, Dyslexia,
Learning Disability, Questionnaire.
I. INTRODUCTION
A child is born normally with specific capacities of doing various tasks – be it with writing skills, linguistic ability or mathematical aptitude. But some children face difficulty in learning these skills. Learning disabilities, in some cases, affect many parts of a person's life: school or work, daily routines, family life. Three types of learning disabilities - Dyslexia, Dysgraphia and Dyscalculia - are normally found in children. If parents, teachers, and other professionals discover a child's learning disability early and provide the right kind of help, it can give the child a chance to develop skills needed to lead a successful and productive life. In the current study, the researcher has made an attempt to study these learning disabilities and provides a solution to detect Dyscalculia child.
A. Types of Learning Disability
1) Dyslexia: A language based disability, in which a person has trouble understanding words, sentences, or paragraphs.
2) Dyscalculia: A mathematical disability in which a person has a difficult time solving arithmetic problems and grasping math concepts.
3) Dysgraphia: a writing disability in which a person finds it hard to form letters or write within a defined space.
B. Significance of the study
The sooner it is detected, the faster these children can receive special attention and treatment. Earlier on, these disabilities were not often recognized. Many children struggle; only a few learn to adjust to their weaknesses. Those, who aren't able to adjust, suffer frustration and endure a series of life-long failures. This sometimes leads to school dropout, delinquency, and unemployment. Early treatment and special education can metamorphose these children.
C. Why focusing on Dyscalculia
It is important for school personnel and parents to work together to identify math problems when they arise and to address them both at school and home.
Identifying and addressing math difficulties in the early grades can potentially prevent more serious problems in later grades.
D. Dyscalculia
International Journal of Emerging Technology and Advanced Engineering
Website: www.ijetae.com (ISSN 2250-2459,ISO 9001:2008 Certified Journal, Volume 2, Issue 12, December 2012)
290
1) List of symptoms [1]:
Inconsistent computation results in addition,
subtraction, multiplication and division.
Poor mental math ability. May have fear of money
and cash transactions.
Poor with money and credit. Check books are
unbalanced and disordered, financial world.
Short term, not long term, financial thinking.
When writing, reading and recalling numbers, these
common mistakes are made: number additions, substitutions, transpositions, omissions, and reversals.
May be unable to comprehend or "picture"
mechanical processes. Lacks "big picture/ whole picture" thinking.
Poor memory for the "layout" of things. Gets lost or
disoriented easily. May have a poor sense of direction, lose things often, and seem absent minded.
Experiences directional confusion.
Difficulty keeping score during games or difficulty
remembering how to keep score in games, like bowling, etc. Often loses track of whose turn it is during games, like cards and board games.
Difficulty with time management. Inability to recall
schedules, and sequences of past or future events.
2) Types of mathematical problem
Shape recognition: The ability to recognize and copy shapes is a basic skill which develops fairly early.
Children may see a square as four separate lines.
Size discrimination: A problem is indicated in this area when children fail to identify the ―biggest tree‖, the ―longest‖ pencil, the ―shortest boy‖. A child who cannot identify the largest box may later be unable to identify the larger of two nos.
Sets and Numbers:Most learning disabled children do not understand concept of set and thus find it difficult to categorize objects according to a particular common quality. The number property of sets is often confused with the objects contained inside the set. Counting: A child may have difficulty with counting
because he has not understood the concept of one-to-one correspondence, e.g. three pencils can be given out to three persons. He cannot associate quantity with numerals, e.g. the symbol 7 corresponds to ******* Stars. He may have difficulties with ordinal numbers, and will be unable to indicate the third position in a row, the seventh day in a week.
Auditory-Visual Association: Child is unable to associate the written with the visual symbols. Often children cannot associate the number name seventeen with the numerals ‗17‘. They may be unable to recall numbers during number dictation or identify numerals verbally.
Place value: These children read the digit 63 as 6 and 3 or reverse it as 36.
Computing Skills: A child is having difficulty in computing skills e.g. multiplication is an extension of addition, subtraction is the inverse operation of addition.
Measurement, Money and Time: Many of the learning disabled children find it difficult to handle concepts of measurements and money in adult life. In money they may get anxious when asked to deal with coins and change rupees into smaller denominations. They may find it difficult to tell the time, poor sequence of time. Language: Learning disability affected children who
have receptive language problems, will find it difficult to understand quantitative concepts such as before, after, lesser than, greater than. The equal sign is often perceived as two subtraction signs. Some quantitative terms which children often find confusing: add, algorithm, area, angle, average, cardinal number, circle, circumference, counting, decimal, degree, denominator, diameter, divide, dividend, divisor, equal, estimate, fraction, less than, increase, error, minus, multiply, number, numerator, per cent, place value, plus, product, rectangle, set symbol, subtract, triangle, zero etc.
Problem Solving: Learning disabled children find it difficult to solve word problems, lack of analysis and reasoning skills. In the absence of concrete manipulative objects the child is unable to tackle these problems. Another difficulty is not knowing which operation or process to use-does the problem requires addition or subtraction.
II. RESEARCH HYPOTHESIS
H0:Mean score of normal student is same as mean score
of dyscalculia student i.e.
µ =
H1:Mean score of normal student is more than mean
score of dyscalculia student i.e. µ >
III. RESEARCH METHODOLOGY
Purpose: Design to detect dyscalculic child at early
International Journal of Emerging Technology and Advanced Engineering
Website: www.ijetae.com (ISSN 2250-2459,ISO 9001:2008 Certified Journal, Volume 2, Issue 12, December 2012)
291
Sampling Technique: Survey
Sample size: 30
Population: All individuals of primary school.
Time: 30mins
Description:
CrAFT is mainly used for Analysis purpose. For this purpose a questionnaire was designed to suit the simplicity and need for LD. Once we collect the Questionnaire from the set of students. Depending upon the responses which we collect, CrAFT evaluates the children‘s and detects Dyscalculic one.
The first step is to distribute the questionnaire among the set of students which you want to evaluate. And the further processing is done by the CrAFT.
An easy way to comply with the conference paper formatting requirements is to use this document as a template and simply type your text into it.
IV. RESEARCH DESIGN
A. Questionnaire prepared for CrAFT
The questionnaire includes the following tests:
1)Shape Recognition Test: This test contains recognizing and copying shapes. E.g. select the triangles from the given group of shapes. Children may see a square as four separate lines. It is to test whether child is able to recognize the simple geometrical shapes.
2)Size discrimination: It is design to test child’s ability
to identify the ―biggest tree‖, the ―longest‖ pencil, the
―shortest boy‖. A child who cannot identify the largest box may later be unable to identify the larger of two nos.
3)Sets and Numbers: Most learning disabled children do not understand the concept of a set and find it difficult to categorize objects according to a particular common quality. The number property of sets is often confused with the objects contained inside the set. This test checks the child‘s ability to categorize objects according to a particular common quality. 4)Counting: This test checks whether the child knows
the concept of one-to-one correspondence, E.g. three pencils can be given out to three persons and associate quantity with numerals, e.g. the symbol 7 corresponds to ******* stars.
5)Auditory-Visual Association: This test checks the Childs association of the written with the visual symbols. Often children cannot associate the number name seventeen with the numerals ―17‖. They may be unable to recall numbers during number dictation or identify numerals verbally.
6)Place value: This test includes the questions which tests the child ability to for place value. Child may find it difficult to understand that the same digit (e.g. 7) may indicate different values according to how it is placed (e.g. 47, 17, 67).
7)Arithmetic Test: This is test checks child‘s basic computing skills addition, subtraction.
Above tests are mainly based on the areas where dyscalculic has difficulty. We have selected the tests that have been most effective in discriminating Dyscalculia from other children.
Once we collect the Questionnaire from the set of students. Depending upon the responses which we collect, CrAFT evaluates the children‘s and detects the Dyscalculic one.
B. Assumption used while evaluating responses
The assumptions used are as under:
1) Shape Recognition:
- Q.1 - If ans < 5: FALSE ELSE TRUE - Q.2 - If ans < 5: FALSE ELSE TRUE - Q.3 - If ans < 5: FALSE ELSE TRUE - Q.4a - If ans < 4: FALSE ELSE TRUE - Q.4b - If ans < 4: FALSE ELSE TRUE
2) Size discrimination:
- Q.1 – If ans = D: 1 ELSE 0 - Q.1 – If ans = B: 1 ELSE 0 - Q.3 – If ans = A: 1 ELSE 0
3) Set & Nos:
- Q.1 – If ans AC: 1 ELSE 0 - Q.2 – If ans = C-B-A-D: 1 ELSE 0 - Q.3 – If ans = B: 1 ELSE 0 - Q.4 – If ans = C: 1 ELSE 0 - Q.5 – If ans = 4: 1 ELSE 0
- Q.6 – If ans = 5: TRUE ELSE FALSE - Q.7 – If ans = CORRECT: 1 ELSE 0
4) Arithmetic:
- Q.1 – If ans > 6: TRUE ELSE FALSE - Q.2 – If ans > 6: TRUE ELSE FALSE - Q.3 – If ans > 12: TRUE ELSE FALSE - Q.4 – If ans > 4: TRUE ELSE FALSE - Q.5 – If ans = 2: 1 ELSE 0
- Q.7 – If ans =12: 1 ELSE 0 - Q.8 – If ans = 0: 1 ELSE 0
5) Counting:
- Q.1 – If ans > 5: TRUE ELSE FALSE - Q.2 – If ans = 4: TRUE ELSE FALSE - Q.3 – If ans < 6: FALSE ELSE TRUE - Q.4 – If ans < 6: FALSE ELSE TRUE
International Journal of Emerging Technology and Advanced Engineering
Website: www.ijetae.com (ISSN 2250-2459,ISO 9001:2008 Certified Journal, Volume 2, Issue 12, December 2012)
292
C. How the scoring was done
[image:4.612.51.288.164.334.2]CrAFT calculates the total score based on the following threshold value assign to the each subtest:
TABLE I Sh ap e Rec o g n it io n Si ze D is cri mi n at io n Set & N u m b er s A ri th m et ic U n d ers ta n d in g 1 A ri th m et ic U n d ers ta n d in g 2 Co u n ti n g Threshold
Value 66% 66% 50% 60% 60% 66%
SubTest1 66%
Sub Test2 66%
V. RESEARCH FINDINGS
A. Section 1: Shape Recognition
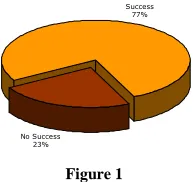
First two questions were to recognise shape (triangle & circle). 12 students went wrong in identifying triangle; whereas 4 students could not recognise circle correctly. Only 1 student was not able to identify both shapes.
[image:4.612.121.218.496.587.2]The next question had two parts - identify the shape and highlight name of the shape. 26 students identified all 4 shapes correctly and highlighted the name as well correctly. Similarly when students were asked to identify circles and write it in words, 25 students identified all circles correctly; 1 of them however went wrong while writing it in words. Shape Recognition Success 77% No Success 23% Figure 1
So if the criterion was of 4 correct answers, 23 have fared well in ‗shape recognition‘ section.
B. Section 2: Size Discrimination
There were 3 questions - biggest mango, shortest girl and tallest tree. 28 students started well with biggest mango; 26 students indicated tallest tree as well; but only 21 students were correct to identify shortest girl. 2 students failed to answer all these 3 questions.
Size Discrimination Success 87% No Success 13% Figure 2
Overall 26 out of 30 students were able to satisfy the criteria of 2 correct answers in this section.
C. Section 3: Set and Numbers
First students were asked to count no. of objects in the sets and identify which 2 sets are of same size. Only 9 students were able to do so correctly.
Next when they were asked to arrange the sets in increasing order of size, only 11 students did it correctly. 4 of them had actually done well in earlier question.
When the students were asked to identify minimum and maximum numbers from given set of numbers, 24 did it correctly and 2 students went wrong with both of them.
When students were to write 5 given numbers in words, 8 students did mistake with 1 or more answers.
The students then were asked to write next number for given 4 numbers and only 18 students answered all of them correctly.
Another question involved connecting numbers 1 to 47 so that a picture of lioness is formed. Only 17 students were able to form lioness by connecting all numbers
correctly. Size Discrimination
Success 70%
No Success 30%
Figure 3
Overall 21 students crossed to threshold of 4 or more correct answers in ‗Set & Numbers‘ section.
D. Arithmetic Understanding
International Journal of Emerging Technology and Advanced Engineering
Website: www.ijetae.com (ISSN 2250-2459,ISO 9001:2008 Certified Journal, Volume 2, Issue 12, December 2012)
293
Second sub-section was to do addition/subtractions with help of pictures. 14 students answered all 3 questions correctly; 13 other answered 2 of them correctly. Thus these 27 students qualified in the criteria, which was to answers 2 questions correctly.
E. Counting
To judge ability of counting, we had designed different types of tests.
First set of questions was to count given items and write the count correctly in words. Only 4 students failed to do it. In another set of questions students were asked to count given items and write the count correctly in figures. Here too 4 students failed to do it correctly.
There was a picture of a boy catching fish and students were asked to colour all the fish in the picture. Only 13 students were able to colour all 6 fish.
Last question was of describe yourself; where students were required to count their body parts such as node, eyes and ears. 24 students did it correctly; 6 students failed to do
so. Counting
Success 80%
No Success 20%
Figure 4
Hence overall for the criterion of 4 correct answers for 6 questions, 24 students fared well in this section.
VI. HYPOTHESIS TESTING FINDINGS
A. Section 1: Shape Recognition
H0: On an average, a normal student will answer 4 or
more questions correctly i.e. µ = 4
H1: On an average, a Dyscalculia student will answer not
more than 4 questions correctly i.e. µ < 4
For Shape Recognition test, µ = 4 and, Sample mean = 3.966666667
= Sample Std. Dev. = 1.29942516
Hence, test statistic is -
t = = = -0.025652369
Decision is to reject null hypothesis if -
Calculated value of t-statistic > Table value of t-statistic Table value of t-statistic = -1.645 at 95% confidence interval
Figure 5
Hence we reject the null hypothesis i.e. ―on an average, a Dyscalculia student will answer not more than 4 questions correctly.‖
B. Section 2: Size Discrimination
H0: On an average, a normal student will answer 2 or
more questions correctly i.e. µ = 2
H1: On an average, a Dyscalculia student will answer not
more than 2 questions correctly i.e. µ < 2 For Shape Recognition test, µ = 2 and, Sample mean = 4.3
= Sample Std. Dev. = 1.68461599
Hence, test statistic is -
t =
=
= 0.55543734Decision is to reject null hypothesis if -
Calculated value of t-statistic > Table value of t-statistic Table value of t-statistic = -1.645 at 95% confidence interval
Figure 6
Hence we reject the null hypothesis i.e. ―on an average, a Dyscalculia student will answer not more than 2 questions correctly.‖
C. Section 3: Set and Numbers
H0: On an average, a normal student will answer 4 or
more questions correctly i.e. µ = 4
H1: On an average, a Dyscalculia student will answer not
International Journal of Emerging Technology and Advanced Engineering
Website: www.ijetae.com (ISSN 2250-2459,ISO 9001:2008 Certified Journal, Volume 2, Issue 12, December 2012)
294
For Shape Recognition test, µ = 4 and, Sample mean = 4.3
= Sample Std. Dev. = 1.68461599
Hence, test statistic is -
t =
=
= 0.178082128Decision is to reject null hypothesis if -
Calculated value of t-statistic > Table value of t-statistic Table value of t-statistic = -1.645 at 95% confidence interval
Figure 7
Hence we reject the null hypothesis i.e. ―on an average, a Dyscalculia student will answer not more than 4 questions correctly.‖
D. Arithmetic Understanding
1) Sub-test 1:
H0: On an average, a normal student will answer 3 or
more questions correctly i.e. µ = 3
H1: On an average, a Dyscalculia student will answer
not more than 3 questions correctly i.e. µ < 3 For Shape Recognition test, µ = 3 and, Sample mean = 3.133333333
= Sample Std. Dev. = 1.357821108
Hence, test statistic is -
t =
=
= 0.098196539Decision is to reject null hypothesis if -
Calculated value of t-statistic > Table value of t-statistic Table value of t-statistic = -1.645 at 95% confidence interval
Figure 8
Hence we reject the null hypothesis i.e. ―on an average, a Dyscalculia student will answer not more than 3 questions correctly.‖
2) Sub-test 1:
H0: On an average, a normal student will answer 3 or
more questions correctly i.e. µ = 3
H1: On an average, a Dyscalculia student will answer
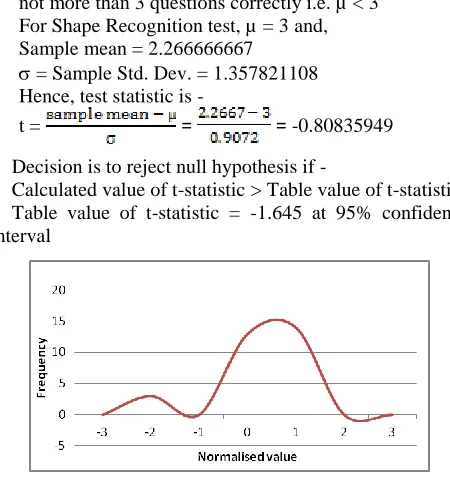
not more than 3 questions correctly i.e. µ < 3 For Shape Recognition test, µ = 3 and, Sample mean = 2.266666667
= Sample Std. Dev. = 1.357821108
Hence, test statistic is -
t =
=
=
-0.80835949Decision is to reject null hypothesis if -
Calculated value of t-statistic > Table value of t-statistic Table value of t-statistic = -1.645 at 95% confidence interval
Figure 9
Hence we reject the null hypothesis i.e. ―on an average, a Dyscalculia student will answer not more than 3 questions correctly.‖
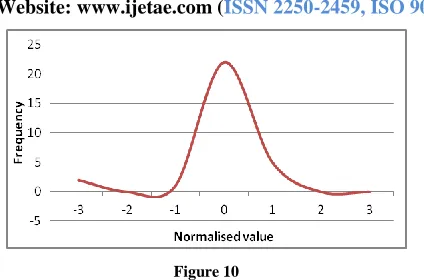
E. Counting
H0: On an average, a normal student will answer 4 or
more questions correctly i.e. µ = 4
H1: On an average, a Dyscalculia student will answer
not more than 4 questions correctly i.e. µ < 4 For Shape Recognition test, µ = 4 and, Sample mean = 4.466666667
= Sample Std. Dev. = 1.431982791
Hence, test statistic is -
t = = = 0.32588846
Decision is to reject null hypothesis if -
[image:6.612.329.554.216.459.2]International Journal of Emerging Technology and Advanced Engineering
Website: www.ijetae.com (ISSN 2250-2459,ISO 9001:2008 Certified Journal, Volume 2, Issue 12, December 2012)
295
Figure 10
Hence we reject the null hypothesis i.e. ―on an average, a Dyscalculia student will answer not more than 4 questions correctly.‖
VII. CONCLUSION
We grouped the sections into 2 types: Visual Understanding of Mathematical and Ability to calculate. A student was expected to fare well in both groups; else was considered ‗Dyscalculia Affected‘.
The test results were as under -
No. of sections answered correctly
16
7
1 1 2 1 1 1
0 4 8 12 16 20
6
S
ec
tio
ns
5
S
ec
tio
ns
4
S
ec
tio
ns
4
S
ec
tio
ns
3
S
ec
tio
ns
2
S
ec
tio
ns
1
S
ec
tio
ns
0
S
ec
tio
ns
[image:7.612.57.563.62.726.2]Success No Successs
Figure 11
[image:7.612.65.277.108.248.2]
TABLE II
Visual Understanding of Mathematics Good Not Good Total
Ability to Calculate
Good 24 1 25
Not Good 3 2 5
Total 27 3 30
The 24 students who have fared good in both categories can be called equally competent as normal children in mathematical understanding.
The 6 students however have fared based in either one or both categories. Test recommends these 6 children to be sent for further counselling.
REFERENCES
[1] ―Children and Learning difficulties‖ by Onita Nakra
[2] ―Learning Disabilities: Understanding Concepts, Characteristics and Issues‖ by Cherry K. and Houck
[3] ―Developmental neglect Dyslexia in a Hebrew reading child‖ by Naama Friedmann and Kartz.
[4] ―Case study on improving high school students with learning difficulties in Mathematics‖ by Wang, Huimini Due,Yanyun Liu. [5] http://www.cldinternational.org
[6] http://www.dlf.org.uk [7] http://www.ld.org
[8] http://www.dyscalculia.org.uk [9] http://www.ldworldwide.org
[10] http://www.childdevelopmentinfo.com/learning/learning_disabilities .fhtml
[11] http://www.mathematicalbrain.com