Journal of Chemical and Pharmaceutical Research, 2015, 7(10):630-639
Research Article
ISSN : 0975-7384
CODEN(USA) : JCPRC5
Exploring use of quality by design (QbD) principles for development of
modified release omeprazole pellets
Niyaz S. Mansuri
1,2*, Punit B. Parejiya
3and Moinuddin M. Soniwala
41
School of Pharmacy, RK University, Rajkot, Gujarat, India
2Famy Care R&D Center, Ahmedabad, Gujarat, India
3Department of Pharmaceutics, K. B. Institute of Pharmaceutical Education and Research, Gandhinagar, Gujarat,
India
4
Department of Pharmaceutics, B. K. Modi Pharmacy College, Rajkot, Gujarat, India
_____________________________________________________________________________________________
ABSTRACT
The present study was aimed to develop modified release pellet of Omeprazole (OMP) applying various tools of Quality by Design (QbD). Sugar spheres were drug layered, barrier coated, extended coated and enteric coated in a fluid bed coater to achieve drug release extension. Based on previous knowledge and initial experimental data, failure mode and effect analysis (FMEA) method were further applied in the risk analysis for the parameters of pellets formulation. Central composite design (CCD) was employed to optimize OMP pellets selecting independent variables (% TEC in ER coat, % Enteric coat, % Extended coat) and responses (% drug release at 2, 4 and 8 hrs. Statistical analysis exhibited that the most significant factor affecting Y1 was X2. Factor X3 had significant negative
effect on drug release at 4 hrs and 8 hrs which can be mathematically proved by regression equation of Y2 and Y3.
Results of physicochemical characterization of OMP pellets revealed compendia compliance. Results of short term stability study indicated stable characteristics of developed formulation.
Keywords: Omeprazole, Quality by Design, Risk assessment, Pellets
_____________________________________________________________________________________________
INTRODUCTION
In an endeavor to combat various pathological states, drugs have been administered through various possible routes. Oral intake, amongst these routes, has unambiguously been the most sought after by the patients and manufacturers alike [1]. Development of an effective oral drug delivery system (DDS), however, invariably involves rational blending of diverse functional and non-functional polymers and excipients. Optimizing the formulation composition and the manufacturing process of such a drug delivery product to furnish the desired quality traits is, therefore, a Herculean task [1].
Omeprazole (OMP) is a lipophilic drug, which behaves as a weak base and it is moderately soluble in alcohol and slightly soluble in water (pKa1=4.2 and pKa2=9.0) [4]. It is known to be very sensitive towards acids and therefore requires an effective enteric coating for oral applications [5].
Multiple-unit sustained-release dosage forms, such as pellets, are believed to have many therapeutic advantages in comparison with the single-unit dosage forms. They can distribute in the gastrointestinal tract (GIT) homogeneously thus maximizing drug absorption and reducing peak plasma fluctuations, minimizing the risk of local GI tract irritation and dose dumping [6]. Thus, in the present study modified release pellets of OMP were developed employing various principles of QbD.
EXPERIMENTAL SECTION
Materials
Omeprazole was obtained from Cadila Pharmaceuticals Limited (Gujarat, India). Klucel LF was obtained from Ashlan (Wilmington, USA). Hypromellose phthalate (HP 55) was received from Shinetshu (Japan). Triethyl citrate was offered by cognis (Germany). Sodium lauryl sulphate (Stepanol, USA), Crosspovidone (BASF, India), Talc (Luzenac) and empty hard gelatin capsule size 1 (ACG) were used as received.
Determination of OMP
[image:2.595.141.454.377.707.2]Concentrations of OMP in dissolution medium were quantified HPLC assisted by UV detector. A Novapak C18 (250 x 4.6mm, 5µ) column and a mobile phase comprising of phosphate buffer (pH 7.4) and acetonitrile in the ratio of 60:40, v/v were used. The flow rate was maintained at 1.2 ml/min.
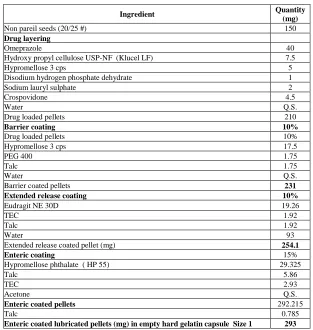
Table 1. Formulation of modified release OMP pellets
Ingredient Quantity (mg)
Non pareil seeds (20/25 #) 150
Drug layering
Omeprazole 40
Hydroxy propyl cellulose USP-NF (Klucel LF) 7.5
Hypromellose 3 cps 5
Disodium hydrogen phosphate dehydrate 1
Sodium lauryl sulphate 2
Crospovidone 4.5
Water Q.S.
Drug loaded pellets 210
Barrier coating 10%
Drug loaded pellets 10%
Hypromellose 3 cps 17.5
PEG 400 1.75
Talc 1.75
Water Q.S.
Barrier coated pellets 231
Extended release coating 10%
Eudragit NE 30D 19.26
TEC 1.92
Talc 1.92
Water 93
Extended release coated pellet (mg) 254.1
Enteric coating 15%
Hypromellose phthalate ( HP 55) 29.325
Talc 5.86
TEC 2.93
Acetone Q.S.
Enteric coated pellets 292.215
Talc 0.785
Preparation of drug-loaded pellets
Sugar spheres were drug layered, barrier coated, extended coated and enteric coated in a fluid bed coater using ingredients shown in Table 1. Drug layering dispersion was prepared by dissolving a binder (Klucel LF, Hypromellose 3 cps) and a wetting agent (SLS) in water, followed by addition of crospovidone and drug. The drug dispersion was sieved through a 60# screen (250 µm) to remove any aggregates. The extended release coat dispersion shown in Table 1 was prepared and passed through a 60# screen and applied to the drug loaded beads. The seal-coated beads were then enteric coated, using Hypromellose phthalate (HP 55) and triethyl citrate (TEC) as the plasticizer. The enteric coating composition was prepared and applied on seal coated beads. The dispersion was passed through a 60# screen prior to application. Due to the small size of the beads, the spray rate, air flow, and product temperature were carefully monitored to ensure individual particle coating and to minimize potential agglomeration or electrostatic charge. The process parameters were as follows: rotational speed of plate: Inlet temperature (˚C): 40-60; Bed temperature (˚C): 30-40; Exhaust temperature (˚C): 30-40; Atomization air pressure (kg/cm2): 1-3; Total pressure (kg/cm2): 2-6; Peristaltic Pump rpm: 1-20.
Application of QbD principles: Risk assessment
Fish-bone diagram was constructed to identify the potential risks and corresponding causes. Based on previous knowledge and initial experimental data, failure mode and effect analysis (FMEA) method were further applied in the risk analysis for the parameters of pellets formulation. Each variable (potential failure mode) was scored in terms of severity (S), detectability (D) and probability (P). More broadly, Severity is measure of the possible consequences of a failure mode affecting on the safety and efficacy of the final product. Detectability defined that a failure mode can be detected. The final parameter probability is considered as the occurrence probability or the likelihood of a failure. For each risk, S, D, P scores were multiplied together to produce a “Risk Priority Number” (RPN), RPN = S * D * P, which represents the overall magnitude of the risk. We ranked S, (1: No impact – have no influence on product quality, 2: Low impact – have little influence on product quality, 3: Moderate impact – have moderate influence on product quality, 4: High impact – have severe influence on product quality), D (1: Failure can be detected ever time., 3: Failure can be detected in some cases., 5: Failure cannot be detected) and P (1: Rare – failure is rare to happen., 3: Occasional – failure happens sometimes., 5: Frequent – failure is common to happen.). Maximum RPN of 100 and minimum RPN of 1 are possible. Any formulation variable or process parameter with an higher RPN was regarded as a potential critical factor, that is, potential risks are evaluated by subsequent process characterization studies since it possibly has a potential impact on CQAs and in consequence on product safety and efficacy, while factors with a lower RPN were eliminated from further study [7, 8].
Application of central composite design (CCD) [9]
After opting for the most important factors influencing the performance of the produced OMP pellets, a three-factor, three-level CCD was developed to explore the optimum levels of these variables. This methodology consisted of three groups of design points, including three-level factorial design points, axial or star points, and centre points. Therefore, three selected independent variables (% TEC in ER coat, % Enteric coat, % Extended coat) were studied at five different levels coded as -α, -1, 0, +1, and +α. The value for alpha (1.68) was intended to fulfill the
rotatability in the design. Percentage drug release at 2 hrs, 4 hrs and 8 hrs were selected as dependent variables. According to the CCD matrix generated by Design-Expert software (Trial Version 7.1.6, Stat-Ease Inc., MN), a layout of 17 experiments was constructed.
Validation of CCD
The applied CCD was further validated by standard error graph. Standard error graph is a contour plot showing the standard error of prediction for areas in the design space. These values are reflective of the design only, not of the response data. For acceptable criterion this graphs to have relatively low standard error (approximately 1.0 or lower) across the region of interest [10].
Confirmation tests of model
Characterization of OMP pellets [12, 13]: Physicochemical characterization
(a) Loading of pellets into capsules
The pellets which are optimized after the trials were checked for the bulk density and were loaded into hard gelatin capsules size 1 with automatic capsule filling machine (Rimek formulations).
(b) Weight variation test
Ten capsules were individually weighed and the contents were removed. The emptied capsules were individually weighed and the net weight of the contents was calculated by subtraction and the percent weight variation was calculated by using the following formula.
Weight variation should not be more than 7.5 %.
(c) Lock length
Ten individual capsules were taken from formulation trial batch and lock length was measured manually by using vernier calipers and average of ten capsules was noted.
(d) Friability and Sphericity:
A friability tester (CS-2, Tianjin, China) was used to tumble 10 g of pellets for 100 rpm. After friability testing, the pellets were sieved through a sieve. The weight of loss (F %) after testing was calculated as follows:
Where, Wo is the initial weight of pellets before friability testing and W is the weight of pellets retained after friability testing. The testing was carried out in triplicate.
The one-plane-critical-stability (OPCS) was used to estimate the sphericity of the pellets [14]. The value of the OPCS was the angle between a horizontal plane and a tilted plane of maximum stability of the pellets staying on that plane. Each testing was carried out in triplicate.
In vitro drug release study
The OMP pellets were subjected to in vitro drug release for 12 hrs in a calibrated USP dissolution test apparatus (Electrolab, Model TDT 06-T, Mumbai, India) equipped with paddle employing 900 mL dissolution media. The dissolution media was changed after 2 h from 0.1N HCl (pH 1.2) to phosphate buffer (pH 6.8). The paddles were rotated at 50 rpm and the dissolution medium was maintained at a temperature of 37 ± 0.5°C throughout the experiment. Five ml aliquots were withdrawn and analyzed by HPLC method as mentioned above. Five ml of fresh dissolution medium was added after each withdrawal to maintain the volume of dissolution media. The study was carried out in triplicate.
Drug release kinetics
To investigate the kinetics of drug release from OMP pellets, the data of in vitro drug release were fitted to different models. In house developed FORTRAN language based program was used to fit zero order, first order, Higuchi, Hixson-Crowell, Korsmeyer-Peppas, and Weibull models. Appropriate drug release kinetic model was selected based on least SSR, least Fisher’s ratio (F) and maximum R2 [15].
Stability Studies
RESULTS AND DISCUSSION
QTPP of OMP pellets and CQA identification
[image:5.595.202.395.186.314.2]QTPP for OMP pellets are listed in Table 2. According to scientific prior knowledge and preliminary studies, % drug release at 2 hrs, % drug release at 4 hrs and % drug release at 8 hrs were selected as CQA [17].
Table 2. QTPP for OMP pellets
Attribute QTPP
Final Dosage form Capsule Type of core content Pellets Route of administration Oral
Appearance Spherical shape
Strength 40 mg
In vitro release % drug release at 2 hrs: 0-5% % drug release at 4 hrs: 20-22% % drug release at 8 hrs: 80-85%
Friability <1.0%
Impurity Below safety threshold
Assay Acceptable limit
Content uniformity Acceptable limit
Risk assessment
An Ishikawa diagram was plotted, in accordance with ICH Q8 R2 guideline, to identify an initial list of potential high risk factors that influenced the quality of the OMP pellets (Figure 1). It could be seen that four main causes (formulation, process, environmental and personnel factors) were identified.
Figure.1: Ishikawa diagram depicting factors that may have impact on the critical quality attribute (CQA) of the OMP pellets
Figure 2 presents the results of risk analysis, which were achieved based on prior knowledge and preliminary study. It could be seen that three potential high risk variables (RPN>35) were identified. Then preliminary experiment was carried out to select the auxiliary excipients and non significant process parameters (data not shown). Further to understand the main, interactive and polynomial effect of these causative factors on selected CQAs, CCD was employed.
[image:5.595.111.490.373.566.2]Figure.2: RPN score after FMEA risk assessment
Validation of CCD
[image:6.595.91.506.400.712.2]Application of CCD
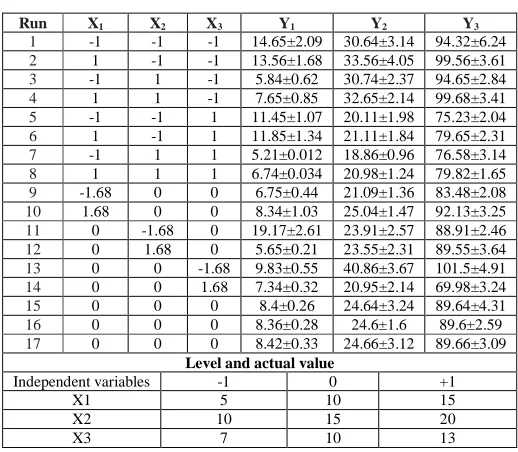
[image:7.595.168.427.151.377.2]The experimental run with factors and corresponding responses were presented in Table 3.
Table 3. Experimental runs obtained from CCD and responses
Run X1 X2 X3 Y1 Y2 Y3
1 -1 -1 -1 14.65±2.09 30.64±3.14 94.32±6.24
2 1 -1 -1 13.56±1.68 33.56±4.05 99.56±3.61
3 -1 1 -1 5.84±0.62 30.74±2.37 94.65±2.84
4 1 1 -1 7.65±0.85 32.65±2.14 99.68±3.41
5 -1 -1 1 11.45±1.07 20.11±1.98 75.23±2.04
6 1 -1 1 11.85±1.34 21.11±1.84 79.65±2.31
7 -1 1 1 5.21±0.012 18.86±0.96 76.58±3.14
8 1 1 1 6.74±0.034 20.98±1.24 79.82±1.65
9 -1.68 0 0 6.75±0.44 21.09±1.36 83.48±2.08
10 1.68 0 0 8.34±1.03 25.04±1.47 92.13±3.25
11 0 -1.68 0 19.17±2.61 23.91±2.57 88.91±2.46
12 0 1.68 0 5.65±0.21 23.55±2.31 89.55±3.64
13 0 0 -1.68 9.83±0.55 40.86±3.67 101.5±4.91
14 0 0 1.68 7.34±0.32 20.95±2.14 69.98±3.24
15 0 0 0 8.4±0.26 24.64±3.24 89.64±4.31
16 0 0 0 8.36±0.28 24.6±1.6 89.6±2.59
17 0 0 0 8.42±0.33 24.66±3.12 89.66±3.09
Level and actual value
Independent variables -1 0 +1
X1 5 10 15
X2 10 15 20
X3 7 10 13
Y1 varied from 5.21±0.012 to 19.17±2.61. Y2 varied from 18.86±0.96 to 40.86±3.67. Y3 varied from 75.23±2.04 to
101.5±4.91. The model explaining the effects of various factors on Y1 was as follows:
Y1= 8.39 +0.45X1 -3.73 X2 -0.84X3 +0.613 X1X2+0.261 X1 X3 +0.311 X2X3-0.286X12+1.299 X22+0.081X32
-0.111X1X2X3
Similarly, Y2 and Y3 can be equated in the form of following equations.
Y2= 24.63 + 1.07X1 -0.20 X2 -5.86X3 +0.014X1X2 – 0.21 X1 X3 – 0.071X2X3-0.53X12-.30X22+2.24X32+0.27X1X2X3
Y3= 89.64 + 2.38X1 + 0.22X2 -9.51X3 -0.17X1X2 – 0.33X1 X3 +0.13X2X3-0.65X12-0.15X22-1.38X32-0.12X1X2X3
Statistical analysis exhibited that the most significant factor affecting Y1 was X2. Though, the factors X1 and X3 also
had positive effect on Y1. The effect of X2 on Y1 was on negative, which further indicates that as the level of enteric
coating is increased, initial release for 2 hrs is decreased.
Factor X3 had significant negative effect on drug release at 4 hrs which can be mathematically proved by regression
equation of Y2. As layer on extended coating is increased on pellets, drug diffusion from inner core is retarded.
Similarly it had effect on drug release at 8 hrs with greater magnitude, which also proved extension of drug release at later stages by applying more coating layer.
Table 4. Regression coefficients and p value for % drug release at 2, 4 and 8 hrs
Parameter % Drug release at 2 hrs (Y1) % Drug release at 4 hrs (Y2) % Drug release at 8 hrs (Y3)
Co efficient p Co efficient p Co efficient p
X1 0.45 0.0454 1.07 < 0.0001 2.38 < 0.0001
X2 -3.73 < 0.0001 -0.20 0.0120 0.22 0.0376
X3 -0.84 0.0034 -5.86 < 0.0001 -9.51 < 0.0001
X1X2 0.613 0.0405 0.014 0.8611 -0.17 0.1640
X1X3 0.261 0.3102 -0.21 0.0296 -0.33 0.0247
X2X3 0.311 0.2348 -0.071 0.3804 0.13 0.2681
X12 -0.286 0.1996 -0.53 0.0002 -0.65 0.0004
X22 1.299 0.0006 -0.30 0.0034 -0.15 0.1563
X32 0.0815 0.6958 2.24 < 0.0001 -1.38 < 0.0001
X1X2X3 -0.111 0.6536 0.27 0.0123 -0.12 0.3110
Y1= 8.39 +0.45X1 -3.73 X2 -0.84X3 +0.613 X1X2 +1.299 X22
Y2= 24.63 + 1.07X1 -0.20 X2 -5.86X3 – 0.21 X1 X3-0.53X12-0.30X22+2.24X32+0.27X1X2X3
Y3= 89.64 + 2.38X1 + 0.22X2 -9.51X3– 0.33X1 X3-0.65X12-1.38X32
So, from the reduced models of Y1, Y2 and Y3, it can be anticipated that selections of independent variables (X1, X2
and X3) are judicious, as main effect terms are present in all models. The interactive term (X1X2) had a significant
effect on initial drug release while that of X1X3 had on drug release at intermediate and later stages. Polynomial
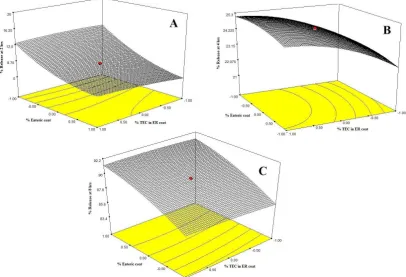
terms also had remarkable effect on drug release. Response surface plots relating the effect of factors X1 and X2 on
[image:8.595.95.501.379.656.2]selected CQAs (Y1, Y2 and Y3) are presented in figure.4.
Figure.4: Response surface plots showing effect of % TEC in ER (X1) and % Enteric coat on % drug release at 2 hrs (Y1), % drug release at 4 hrs (Y2) and % drug release at 8 hrs (Y3)
for batch F18 were 9.36, 21.57, 81.23 and 9.55±1.53, 20.57±12.19, 79.86±3.64 h, respectively, whereas that of batch F19 were 4.59, 19.53, 78.80 and 4.73±0.52, 20.11±1.38, 81.32±2.06 respectively. The results confirmed predictive potential of the evolved models. Based on the results of in vitro drug release, batch F19 was considered as an optimized batch satisfying predetermined criteria in terms of % drug release at 2, 4 and 8 hrs. Figure 5 depicts overlaid contour plot which shows dark region of interest. F19 batch belongs to this design space.
Figure.5: Overlaid contour plot
Physiochemical characterization
The values of bulk density and tapped density of OMP pellets were 0.632 and 0.665 g/ml respectively. The lock length value of capsule was 18.64 mm. The weight variation in final optimized formulation was 1.05±0.022%. The sphericity value of developed OMP pellets were nearer to the 1.
Drug release kinetics
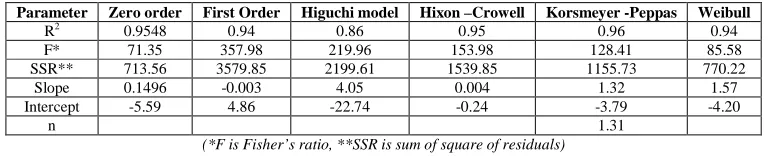
In vitro drug release profile of batch F19 is presented in figure. 6. In vitro dissolution data of the optimized
[image:10.595.106.490.210.288.2]formulation F18 was fitted to various mathematical models (zero order, first order, Higuchi, Hixson-Crowell, Korsmeyer-Peppas, and Weibull) in order to describe the kinetics of drug release. An optimized formulation (F19) did not followed any model out of tried models perfectly as there were remarkable difference in SSR, F and R2 values. The least SSR (713.56) and F (71.35) values obtained from zero order model which were significantly high to conclude the drug release kinetics (Table 5).
Table 5. Drug release kinetics data of batch F19
Parameter Zero order First Order Higuchi model Hixon –Crowell Korsmeyer -Peppas Weibull
R2 0.9548 0.94 0.86 0.95 0.96 0.94
F* 71.35 357.98 219.96 153.98 128.41 85.58
SSR** 713.56 3579.85 2199.61 1539.85 1155.73 770.22
Slope 0.1496 -0.003 4.05 0.004 1.32 1.57
Intercept -5.59 4.86 -22.74 -0.24 -3.79 -4.20
n 1.31
(*F is Fisher’s ratio, **SSR is sum of square of residuals)
Stability study
An optimized formulation (F19) showed stable characteristics after stipulated time of stability testing. The results of the stability study are depicted in Table 6.
Table 6. Evaluation parameters for optimized batch subjected to stability study
Parameters F19
Initial 1 month 2 months 3 months
Drug content (%) 99.33±0.041 98.71±0.036 100.43±0.018 99.22±0.047 Friability 0.76±0.0015 0.81±0.0034 0.85±0.0043 0.89±0.0019
Physical degradation No No No No
% Drug release after 8 hrs 81.32±2.06 83.64±3.11 79.34±1.98 80.42±3.11
CONCLUSION
The present study revealed that the usefulness of the application of QbD principles to gain a fundamental understanding of formulation and processing factors affecting the OMP pellets. According EMEA analysis, % TEC in ER coat, % Enteric coat, % Extended coat were identified as high risk factors. These three factors were further used for CCD to develop DS. Reduced model equations stated the significance of main, interactive and polynomial effect on selected CQAs. So, in a nutshell, this study demonstrated that OMP pellets were successfully designed using QbD principles, and it can be used as successful dosage regimen in treatment of GIT diseases.
REFERENCES
[1] B Singh; Kapil R; Nandi M; Ahuja N, Expet Opin Drug Deliv, 2011, 8, 1341-1360. [2] S Roy, Int J Pharm Bio Res, 2012, 3, 100-108.
[3] XY Lawrence, Pharma res, 2008, 25, 781-791.
[4] VJ Tondo Filho; Andreazza IF; Sato MEO; Murakami FS, Braz J Pharm Sci, 2014, 50, 505-511. [5] B Wallmark, Scand J Gastroenterol, 1986, 21, 11-16.
[6] L-D Hu; Liu Y; Tang X; Zhang Q, Eur J Pharm Biopharm, 2006, 64, 185-192. [7] Y Liu; Liu S; Dai Q, Chem Pharmaceut Bull, 2009, 57, 55-60.
[8] RA Lionberger; Lee SL; Lee L; Raw A; Lawrence XY, The AAPS journal, 2008, 10, 268-276. [9] W Wu; Cui G; Lu B, CHIN PHARM J BEIJING, 2000, 35, 530-532.
[10] PB Parejiya; Barot BS; Patel HK; Shelat PK; Shukla A, Drug Dev Ind Pharm, 2013, 39, 1851-1863. [11] AS Rathore; Saleki-Gerhardt A; Montgomery SH; Tyler SM, Int BioPharm, 2009, 21, 213-218. [12] S Petchimuthu; Narayanan N; Uthirapathy S, Int J Pharm Ana Res, 2014, 3, 348-362.
[13] I Pharmacopoeia, India, 2010, 2, 786.
[image:10.595.153.445.345.423.2]