1072
EARLY DETECTION OF ALTERNARIA BLIGHT DISEASE IN
BITTER GOURD LEAVES USING IMAGE PROCESSING
1
SAM ABRAHAM, 2 T. S BALASUBRAMANIAN, 3 D. DHANASEKARAN
1
Department of Computer Science & Engineering, Saveetha School of Engineering, Saveetha University, India, Email:[email protected]
2
Ex-Dean (Research), Saveetha School of Engineering, Saveetha University, India. Email: [email protected]
3
Principal, Saveetha School of Engineering, Saveetha University, India. Email: [email protected]
ABSTRACT
Detection of Alternaria blight disease in bitter gourd leaf can be done early by applying Image Processing Techniques. The growth of the plant is categorized into five stages. Images are acquired separately for healthy, diseased and test leaves. Histogram analysis is done at each stages for the identification of healthy and diseased leaves. The images are pre-processed and the colour characteristics are analysed using RGB, HSV and HSI model. The values of healthy and diseased leaves at each stages are stored. These values are used for checking with value of test leaves for the early detection of disease in the leaves of bitter gourd plant. This extensive experiment helps the early detection of the disease. Neural network pattern recognition tool is used to find the accuracy of results obtained for healthy and disease leaves at each stages.
Keywords: RGB, HSV, HSI, Neural network
1. INTRODUCTION
Bitter gourd (Momordica Charantia as botanical name in the family of Cucurbitaceae) is a widely popular vegetable grown extensively in several parts of India, countries like China, Africa, Caribbean and Southeast Asian regions. Bitter gourd is a herbaceous climbing annual plant with ridged stems that grows up to 5 metre long. January to March and September to December are the seasons for sowing of bitter gourd seeds. The main varieties of bitter gourd grown in India are ArkaHarit, Pusa Do
Mausmi,VK-1,Priyanka, Priya, Coimbatore
Long, PhuleUjawala,Phule Green Gold,Preethi, Phule Priyanka and Pride of Gujarat [1][2]. Priyanka is the widely cultivated variety in Southern part of Kerala. The average fruit yield varies from 8 to 10 t/ha (tonne per hectare).
Bitter gourd leaves contain many bioactive constituents full of medicinal properties. Bitter gourd leaves are a good source of Vitamin A [3][4]. The leaves are used for treatment of wide variety of ailments such as diabetes, dysentery, rheumatism, gout, viral diseases, respiratory ailments etc. Most plant diseases are caused by fungi, bacteria, and viruses. Fungi are identified
primarily from their morphology with emphasis placed on their reproductive structures.There are various types of diseases which affect the leaves of bitter gourd plant. Fusarium wilt, Collar rot, Powdery mildew, Downey mildew, Alternaria blight, Anthracnose and Mosaic are common diseases found in southern parts of India [6]. According to the survey conducted and opinion of experts from Agricultural
University, Kerala. Alternaria blight is most common disease in leaves of Bitter gourd plant found in southern part of Kerala. Growth of the Bitter gourd plant is divided into five stages which are Germination, Branching, Flowering, Fruiting and Maturing (seedling) stages [7][8].
1073 expensive very unprecise and cumbersome.
Suitable evaluation and diagnosis of
crop disease in the field is very critical for the increased production. Providing fast, cheap and accurate image-processing-based solutions can be of great realistic significance to detect the symptoms of diseases early on plant leaves.
2. PROBLEM STATEMENT
Alternaria blight disease is most
commonly seen in the Southern region of India. Disease starts from the margin of the leaf and produce concentric rings, yellow spots appear on leaves which turn brown and finally turn black on aging [5]. Disease may appear either in the front, back or both sides of the leaves as shown in Fig.1 and Fig.2.
[image:2.612.331.533.77.473.2]
Fig. 1. Front View
Fig. 2. Back View
In order to minimize the disease induced damage in crops during growth, harvest and postharvest processing, as well as to maximize
productivity and ensure agricultural
sustainability, early detection of disease in leaves of bitter gourd is imperative.
3. METHODOLOGY FOR EARLY
DETECTION OF ALTERNARIA
BLIGHT DISEASE IN BITTER
GOURD LEAFS
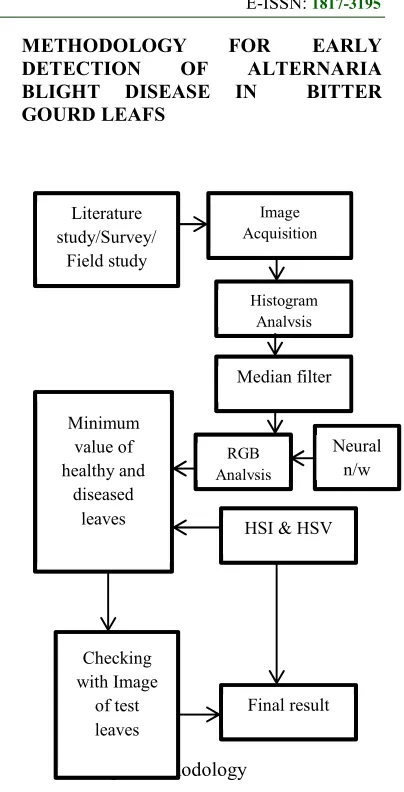
Fig3. Methodology
3.1. Literature Study / Field Survey
There are various methods adopted for disease detection in plant leaves like leaves vein
extraction, colour transformation, texture
features like area, shape, edge, size
classifications, root image, RGB extraction, leaf disease detection ,image acquisition, colour
texture analysis , colour analysis and
segmentation etc. There are many gaps in the current available research work in the detection of diseases in plant leaves. Research paper dealing with early detection of disease in bitter gourd leaves are currently not available. As an extension ,this research work aim is to detect the disease early in bitter gourd leaves using histogram analysis, neural network and various colour models.
A field survey was conducted among farmers to find out the most common type of disease
Literature study/Survey/
Field study
Image Acquisition
Histogram Analysis
Median filter
RGB Analysis Minimum
value of healthy and
diseased leaves
HSI & HSV
Checking with Image
of test leaves
Final result Neural
1074 affecting the leaves of the bitter gourd plant. Survey also revealed the facts of seasons of cultivation, symptoms of Alternaria blight disease. The opinion and observation results
from experts/professors of Agricultural
University of Kerala are also considered. It is understood that there are chances of various diseases attacking the same leaf. For the purpose of study only Alternaria blight disease is considered. The images are captured from various farms to get more number of samples for the same disease. The images are captured live without plucking the leaves from the plant, so that the plant will continue its growth.
3.2. Image Acquisition
Images of the leaves are captured using 20.1 megapixel digital camera with 640 x 480
resolutions in JPEG Format. Unwanted
background images are eliminated in Photoshop version 7.
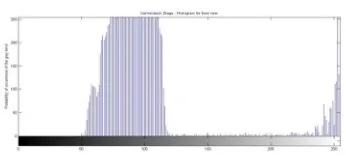
3.3. Histogram Analysis
Histogram technique gives a useful
summary of the distribution of gray level in an image, by plotting the probability of occurrence of the gray level. Histogram based analysis is done at each stage for the identification of healthy and diseased leaf.
3.4. Median Filter
Median filter is effective in the presence of Impulse noise (salt and pepper noise). In this filter pixel value is replaced by median value. The median is calculated by sorting all the pixels in ascending order and then replace the pixel being calculated with the middle pixel value.
3.5. RGB Model
Digital images are made of pixels, and pixels are made of combinations of primary colours. The value range of RGB (Red, Green, Blue) is from 0 to 255 [11][12][16] [17][18][19][20]. The minimum and maximum values of healthy and diseased leaves are taken from the matrix.
3.6 .Neural Network
Images of healthy and diseased leaves of all stages are used for the back propagation
neural network confusion matrix based analysis. The average of RGB values of healthy and diseased leaves at each stages and consolidated minimum values of RGB at each stages are loaded and trained.
3.7 .HSV (Hue, Saturation, Value)
RGB component is converted to
HSV.HSV colour space is formulated along its grey axis. Value range varies from 0 to 1 [9]. The maximum values of V (value) for healthy and diseased leaf are constant for all images and minimum value varies for each Image. The variations in the minimum value are considered for disease detection.
3.8 .HSI (Hue, Saturation, Intensity)
RGB component is converted to HSI [9].The maximum values of intensity of healthy and diseased leaf are constant for all images and minimum value varies for each Image. The variations in the minimum value are considered for disease detection.
3.9. Test Leaf
Random images of leaf (front and back) are taken from all stages. The extracted minimum values are compared with minimum value obtained.
3.10. Final Result
The obtained result is loaded in Microsoft excel and the percentage of attack at each leaf (front and back) is calculated using IF statement.
4. HISTOGRAM ANALYSIS
1075 The histogram for front view of healthy leaves at germination stage are shown in Fig 4.The gray scale values of the histogram for front view of healthy bitter gourd leaf are between 50 and 250.However, the initial gray scale value is close to 50 and the final gray scale value is close to 250.The maximum probability of occurrence of the gray level is between 50 and 250.
Fig. 4. Shows the front view of healthy leaves at germination stage
The maximum probability of occurrence of healthy and diseased leaf at germination, branching, flowering, fruiting and maturing stages are shown in Table .1.
4.1 Median Filter
Fig 5. The above figure shows a) original image b) Image with noise c) Image after using median filter.
5. NEURAL NETWORKANALYSIS
The neural network is to map and input into a desired output [10][14][15]. The neural network pattern recognition tool are used to obtain input, create and train a network. To evaluate its performance using mean square error and confusion matrices. RGB values of images of healthy and diseased leaves at each stages are taken, its average value and consolidated minimum values of RGB at each stages are loaded and trained.
The neural network training performance plot and confusion matrix of healthy and diseased at germination stage (front and back) are shown in Fig 6. In the neural network training performance
plot, neural training is completed at 28th iteration.
The best validation performance is 2.999 at 22nd
[image:4.612.323.533.367.492.2]iteration. In training confusion matrix, the percentage of correct classification is 99.3 % and the percentage of incorrect classification is 0.7 %. In validation confusion matrix, the percentage of correct classification is 100% and the percentage of incorrect classification is 0%. In test confusion matrix, the percentage of correct classification is 100% and the percentage of incorrect classification is 0 %. The overall confusion matrix, the percentage of correct classification is 99.5 % and the percentage of incorrect classification is 0.5 %.
Fig 6. The neural network training performance plot and confusion matrix of healthy and diseased ( front and back side) at germination stage.
The percentage of correct and incorrect classification of healthy and diseased leaf of germination, branching, flowering, fruiting and maturing stage are shown in table 2.
6. RGB, HSI AND HSV MODEL
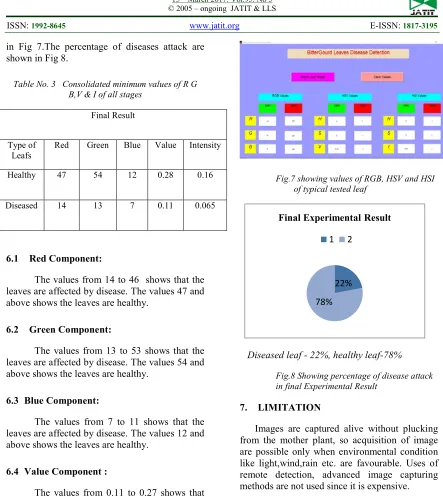
[image:4.612.95.295.479.547.2]1076 in Fig 7.The percentage of diseases attack are shown in Fig 8.
Table No. 3 Consolidated minimum values of R G B,V & I of all stages
Final Result
Type of Leafs
Red Green Blue Value Intensity
Healthy 47 54 12 0.28 0.16
Diseased 14 13 7 0.11 0.065
6.1 Red Component:
The values from 14 to 46 shows that the leaves are affected by disease. The values 47 and above shows the leaves are healthy.
6.2 Green Component:
The values from 13 to 53 shows that the leaves are affected by disease. The values 54 and above shows the leaves are healthy.
6.3 Blue Component:
The values from 7 to 11 shows that the leaves are affected by disease. The values 12 and above shows the leaves are healthy.
6.4 Value Component :
The values from 0.11 to 0.27 shows that the leaves are affected by disease. The values 0.28 and above shows the leaves are healthy.
6.5 Intensity Component:
The values from 0.065 to 0.15 shows that the leaves are affected by disease. The values 0.16 and above shows the leaves are healthy.
Fig.7 showing values of RGB, HSV and HSI of typical tested leaf
[image:5.612.84.527.53.550.2]
Diseased leaf - 22%, healthy leaf-78%
Fig.8 Showing percentage of disease attack in final Experimental Result
7. LIMITATION
Images are captured alive without plucking from the mother plant, so acquisition of image are possible only when environmental condition like light,wind,rain etc. are favourable. Uses of remote detection, advanced image capturing methods are not used since it is expensive.
8. FUTURE WORK
Remote methods for identification of diseases at different growth stages can be applied to cover large area. The research work can also be extended to study other diseases of bitter gourd plant.
9. FINDING
The disease attack is the lowest in the Germination stage. The disease attack is the highest in the flowering stage. There is no use of preventing the disease at Flowering stage as it will affect the fruiting stage and also it will affect
22%
78%
Final Experimental Result
1077 the total yield of the plant. The findings reveals that necessary precautions are to be taken at
Branching stage of the bitter gourd plant
.
10. CONCLUSION
Histogram based image analysis helps to conform healthy and diseased leaf at each stage. Consolidated minimum value is obtained for healthy and diseased leaves at all stages. Accuracy of these minimum values are checked by neural network pattern recognition tool. Random image of leaves are acquired from all stages and compared with minimum values. Results shows that twenty two percentage are affected by Alternaria blight disease. As an outcome of research work Prevent the unnecessary use of pesticides over crop fields which are a contribution to healthy environment. Same methods can be extended to other plants and herbs also.
Food losses due to crop infections are persistent issues in agriculture for centuries across the globe. In order to minimize the disease induced damage in crops during growth, harvest and post-harvest processing, as well as to maximize productivity and ensure agricultural sustainability, advanced disease detection and prevention in crops are imperative.
REFERENCES:
[1] Balachandran,P.V.:‘Package of practice Reco- mmendatios’,(Kerala Agricultural
University Press, 2011,14th edn), pp.173-17.
[2] Sam Abraham, Balasubramanian, T.S., Dhan-
asekaran.:’Literature review for the
detection of disease in bitter gourd leaves’,IJAIEM , 3, (11), 2014,pp.50-53. [3] Sam Abraham, Balasubramanian, T.S.,Dha-
nasekaran.:’Early Detection of Disease in Bitter gourd Leafs at Germination
stages’,IJAER,10,
(17),2015,pp.37447-37452.
[4] Sam Abraham, Balasubramanian, T.S., Dhan- asekaran,D.:’Detection of Disease in Bitter gourd leafs at early stage’,IJAER,10,(9), 2015, pp 40315 - 40321.
[5] ‘Production Technologies and Marketing Strategies of vegetable crops of Central
India’, http://www.jnkvv-vegsoft.com/
english/select dise- ase.php?
vegid=7,accessed Nov 2016.
[6] ‘National Horticulture Board’, http:// www. nh-
b.gov.in/http://nhb.gov.in/PDFViwer.aspx?e
nc=3ZOO8K5CzcdC/ Yq6HcdIxJS7iX
fQFcTc0/H nx UEl8qk=,accessed Nov 2016. [7] Sam Abraham, Balasubramanian, T.S.,
Dhana- sekaran.:’Early detection of disease
in bitter gourd leafs at flowering
Stage’,IJAIEM, 3,(11),2015 pp. 50-53.
[8] LiliMa,Jun long Fang,Yuehua Chen,
Shujpeng Gong.:’ Color Analysis of leaf images of Defici- encies and Excess Nitrogen content in soybean leaves’. Proc. Int. Conf. E product service and E-Entertainment, 2010, pp. 1- 3.
[9] Rafael Gonazalez,C.,and Richard Woods, E.:‘ Digital Image Processing’, (Manipal
press,2011,3rd edn), pp.403-411.
[10] Sivanandam, S.N.,Sumathi,S.,S.N Deepa, S.N.:’Introduction to neural networks using
MATLAB 6.0’ (Tata McGrawHill
press,12th edn , 2006, pp.185-193.
[11] Vijayakumar,J.,Arumugan,S.:’Foot Rot Dis- ease Identification for Vallaikorti Variety of
Betelvineplant Using digital image
processing’, ICTACT Image and
VideoProcessing,03, (02), 2012,pp.495 -501. [12] Vijayakumar, J., Arumugam, S.:, ‘Powdery mildew disease identification in karpoori variety of betel vine plants using histogram based techni- ques’, Advances in Image and Video Processing, 02,( 05),2014, pp.63-75. [13] Samanta,D.,Ghosh, A.:‘Histogram approach
for detection of maize leaf damage’, International Journal of Computer Science
and Telecommunic- ations,3,(2),2013,
pp.26-28.
[14] Balamurugan, P., Rajesh, R.:‘Neural network based system for the classification of leaf rot disea- se in cocos nucifera tree leaves’, European Journal of Scientific Research,88, (1),2012, pp.137-145.
[15] Bindu, T., Toran, V.: ‘Identification and classification of normal and infected apples using neural network’, International Journal of Science and Research,2, (6),2013, pp.160-163.
1078 [17] Vijayakumar, J.,Arumugam, S.: ‘Certain
investigations on foot rot disease for betelvine plants using digital imaging
technique’, proceedings of the fifth
International Conference on Emerging Trends in Communication and Computing Applications,2013, pp.79.
[18] Vijayakumar, J., Arumugam, S.: ‘Odium piperis fungus identification for piper betel plants using digital image processing’,
Journal of Theoretical and Applied
Information Technology,60,(2),2014,
pp.423-427.
[19] Pokharkar, SR &Thool, VR 2012, ‘Early pest identification in greenhouse crops using image processing techniques’, International Journal of Computer Science and Network, vol.1, no.3, pp.1-6.
[20] Qinghai, H , Benxue, M , Zhang, Q & Jing, Z 2013, ‘Cotton pests and diseases detection
based on image processing’, Telkomnika
Indonesian Journal of Electrical
1079
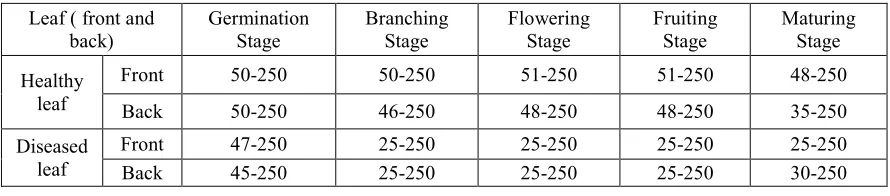
Table 1. The Maximum Probability Of Occurrence Of Healthy And Diseased Leaf At Germination, Branching, Flowering, Fruiting And Maturing Stage.
Leaf ( front and back) Germination Stage Branching Stage Flowering Stage Fruiting Stage Maturing Stage Healthy leaf
Front 50-250 50-250 51-250 51-250 48-250
Back 50-250 46-250 48-250 48-250 35-250
Diseased leaf
Front 47-250 25-250 25-250 25-250 25-250
Back 45-250 25-250 25-250 25-250 30-250
Table 2. The percentage of correct and incorrect classification of healthy and diseased leafs of Germination, Branching, Flowering, Fruiting and Maturing Stage.
Details
Training confusion matrix
Validation confusion
matrix Test confusion matrix All confusion matrix
P er ce n ta g e o f co rr ec t cl as si fi ca ti o n P er ce n ta g e o f in co rr ec t cl as si fi ca ti o n P er ce n ta g e o f co rr ec t cl as si fi ca ti o n P er ce n ta g e o f in co rr ec t cl as si fi ca ti o n P er ce n ta g e o f co rr ec t cl as si fi ca ti o n P er ce n ta g e o f in co rr ec t cl as si fi ca ti o n P er ce n ta g e o f co rr ec t cl as si fi ca ti o n P er ce n ta g e o f in co rr ec t cl as si fi ca ti o n Germination stage (Healthy / Diseased) front and back
99.3 0.7 100 0 100 0 99.5 0.5
Branching stage (Healthy / Diseased) front and back
100 0 100 0 100 0 100 0
Flowering stage (Healthy / Diseased) front and back
100 0 100 0 100 0 100 0
Fruiting stage (Healthy / Diseased) front and back
100 0 100 0 100 0 100 0
Maturing stage (Healthy / Diseased) front and back