International Journal of Emerging Technology and Advanced Engineering
Website: www.ijetae.com (ISSN 2250-2459, ISO 9001:2008 Certified Journal, Volume 3, Issue 12, December 2013)
Estimation of Opacity and Weighting Function in the Range of
58 Degree North Through 45 Degree South
S. Mondal
1, A. K. Pradhan
2, P. K Karmakar
31
Department of Electronics and Communication Engineering, Dumkal Institute of Engineering & Technology, Murshidabad-742406,West Bengal, India
2Department of Electronic Science, AcharyaPrafulla ChandraCollege, New Barrackpore, North 24 Parganas,
Kolkata- 700 131, West Bengal, India
3
Institute of Radiophysics and Electronics, University of Calcutta, Kolkata-700 009, India
Abstract— The radiosonde data available from British
Atmospheric Data Centre (BADC) for the different latitudinal occupancy of 58 degree north through 45 degree south over the globe were analyzed to observe the variation of opacity and water vapor weighting function. Temperature, water vapor density along with pressure of the atmosphere are the influencing factors in determining the opacity and water vapor weighting function over the chosen range of latitudes. It is observed that minimum value of opacity is occurred in winter season at the places of northern latitude and southern latitude. It is also observed that the resolutions of retrieval of atmospheric parameter are better in winter season than in rainy season at the places of northern and southern latitudinal occupancy.
Keywords— Latutude, Opacity, Radiosonde, Weighting
function, Water vapor density
I. INTRODUCTION
Remote sensing is the science or technology for acquiring information like identifying, classifying and determining objects of the earth’s surface and environment from air or space by means of electromagnetic waves. The physical information may be obtained through the analyses of data from the objects collected by using remotely located sensors which are practically not in physical contact with the objects. Precisely, remote sensing may be termed as a tool for retrieving the physical properties of the objects of the atmosphere through the measurement of their electromagnetic emission or absorption or scattering characteristic.
Radio wave propagation above 10 GHz is highly influenced by the prevalent atmospheric condition, in particular water vapor concentration and rain. But in the present context, we have extended the emphasis on frequency dependent water vapor attenuation. But we are to take care of the estimate of sensitivity, for a particular operational frequency, to the changes of a given atmospheric variable like temperature, water vapor density, and liquid water content.
This will indicate the ability to a better proximity, to retrieve that particular parameter from passive radiometric observation. This sensitivity parameter is called ―weighting function‖ of the particular atmospheric parameter. The analyses of water vapour weighting function at different latitudes over the globe are presented here because looking to weighting function demands a great importance for profiling water vapour at the particular place of choice. Estimating the profile of a parameter that may vary over a wide range of values is clearly a more demanding task than estimating the profile of a parameter whose profile is narrowly bounded. For example, for a fixed location, the total integrated water vapour content may vary by a factor of 30 during a given year (Westwater 1978).
The selection of frequency of operation demands the following important criteria: a) the radiometric temperature at selected frequencies should be strongly sensitive to water vapor density and only weakly sensitive to other atmospheric variables and b) the water vapor weighting function at the selected frequencies should have height profiles sufficiently different to minimize redundancy (Karmakar et al. 2011).
Ulaby et al. (1986) defined the water vapor weighting
function , for zenith looking observation, as
K/km.g.m-3 [1]
Here, accounts for water vapour absorption
coefficient. The water vapour absorption coefficient dominates the situation at or near the peak of the microwave spectrum It is also described that for typical
atmosphere, at GHz, is larger
than by a factor of
International Journal of Emerging Technology and Advanced Engineering
Website: www.ijetae.com (ISSN 2250-2459, ISO 9001:2008 Certified Journal, Volume 3, Issue 12, December 2013)
160 Hence the water vapor weighting function at 22.234 GHz is primarily dominated by water vapor only. The inclusion of temperature in determining water vapor weighting function is noticeable as evident from equation (1).
At a given frequency, the atmospheric absorption coefficient is a function of three basic parameters namely temperature, pressure and water vapor density. The water vapor absorption is essentially directly proportional to water vapor density and likewise the oxygen absorption is directly proportional to pressure. Since, water vapor density and pressure decreases exponentially with increasing altitude, the major contribution in finding the zenith opacity (dB) is provided by the layers closest to the surface (Ulaby et al.1981). Hence, it is expected that the zenith opacity will vary linearly with the surface water vapor density which is supported experimentally by (Waters 1976).
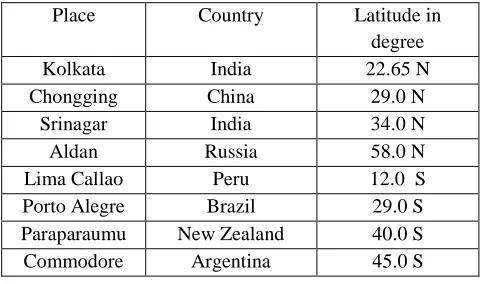
[image:2.612.334.561.396.645.2]Keeping all these in mind, the present authors attempted to find out the opacity and water vapor weighting function at 22.234 GHz and 23.834 GHz over the globe in the range of 58 degree North through 45 degree South. For this purpose, eight places have been chosen out of which four is from the northern latitude and the other four from southern latitude (Karmakar et al. 2011). The latitudinal occupancy is presented in TABLE I. The radiosonde data over the above said places were made available by the British Atmospheric Data Centre (BADC), U.K.
TABLE I
LATITUDINAL OCCUPANCY OF EIGHT PLACES
Place Country Latitude in
degree
Kolkata India 22.65 N
Chongging China 29.0 N
Srinagar India 34.0 N
Aldan Russia 58.0 N
Lima Callao Peru 12.0 S
Porto Alegre Brazil 29.0 S
Paraparaumu New Zealand 40.0 S
Commodore Argentina 45.0 S
II. ANALYSES AND RESULT
Radiosonde data is consisting of vertical profiles of
temperature in degree centigrade, pressure
(mb), and dew point temperature ( ) in degree
centigrade over the places of choice.
Using these data for the year 2005, the water vapour
pressure (mb) and saturation water vapor pressure
(mb) were computed, over different places of choice as mentioned in table – 1, using the relations, as described by Moran and Rosen (1981) and Sen et al. (1989).
The monthly median values of height profiles of atmospheric parameters like pressure, temperature, dew point temperature and water vapour density for the month January-February (first set) and July-August (second set) were considered to find the water vapour attenuation, as input data in the updated millimetre wave propagation model prescribed by Liebe (1985). The two sets of data were chosen because during January through February, the winter season prevails in the northern latitudes and rainy season in July through August. But, on the other hand, the situation is reverse in southern latitudes.
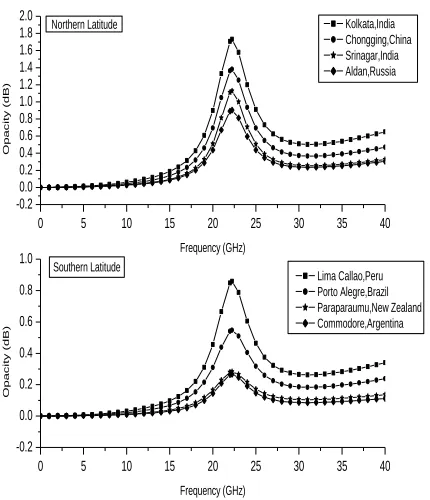
Figure1 and 2 shows the comparison of variation of opacity with frequency at northern and southern latitudes for the month January-February and July-August respectively.
0 5 10 15 20 25 30 35 40
-0.2 0.0 0.2 0.4 0.6 0.8 1.0 1.2
Southern Latitude Lima Callao,Peru Porto Alegre,Brazil Paraparaumu,New Zealand Commodore,Argentina
O
p
a
ci
ty
(
d
B
)
Frequency (GHz)
0 5 10 15 20 25 30 35 40
-0.2 0.0 0.2 0.4 0.6 0.8
Northern Latitude Kolkata,India Chongging,China Srinagar,India Aldan,russia
O
p
a
ci
ty
(
d
B
)
[image:2.612.48.288.475.617.2]Frequency (GHz)
International Journal of Emerging Technology and Advanced Engineering
Website: www.ijetae.com (ISSN 2250-2459, ISO 9001:2008 Certified Journal, Volume 3, Issue 12, December 2013)
Figure 1 shows that at Aldan, Russia the attenuation peak is mostly absent during January through February. This proves that during these months, water vapor is not abundant in the winter season. This little variation suggests that 22.234 GHz is suitable that for the measurement of integrated vapour content, but for profiling it is suggested to take the single frequency as 23.834 GHz at Aldan, Russia because of its pressure independent nature. On the other hand, the maximum attenuation amounting to 0.3 - 0.6 dB occurs at other three northern latitudes amongst which Kolkata bears the maximum. It is also clear from the Figure 1 that at 22.234 GHz, the attenuation amounting to 0.3-1.0 dB occurs at the places of southern latitude amongst which Porto Alegre, Brazil bears the maximum and Commodore, Argentina bears the minimum. But, the situation is reverse at Aldan, Russia during the rainy season during July through August. There, 0.9 dB attenuation prevails due to ambient water vapor and at the other three places, attenuation amounting to 1.1 – 1.7 dB.
0 5 10 15 20 25 30 35 40
-0.2 0.0 0.2 0.4 0.6 0.8 1.0
Southern Latitude
Lima Callao,Peru Porto Alegre,Brazil Paraparaumu,New Zealand Commodore,Argentina
O
p
a
ci
ty
(
d
B
)
Frequency (GHz)
0 5 10 15 20 25 30 35 40
-0.2 0.0 0.2 0.4 0.6 0.8 1.0 1.2 1.4 1.6 1.8 2.0
Northern Latitude Kolkata,India Chongging,China Srinagar,India Aldan,Russia
O
p
a
ci
ty
(
d
B
)
[image:3.612.62.277.368.618.2]Frequency (GHz)
Figure 2. Variation of opacity with frequency at different locations for July-August.
Referring to Figure 2, we see that during July through August, maximum attenuation occurs at Kolkata, India which is around 1.7 dB but amongst the southern latitudes, Peru bears the maximum which is around 0.85 dB
TABLE II shows the value of the opacity at 22.234 GHz and 23.834 GHz along with the value of surface water vapor density for the different locations of northern and southern latitudes for January-February and July-August. It is shown there that the value of opacity is larger at 22.234 GHz than that at 23.834 GHz at all the places of northern and southern latitudes during January-February and July-August. This table also shows that at 22.234 GHz and 23.834 GHz, Kolkata bears the maximum opacity than any other places of the northern latitudes for both the two seasons. But in case of southern latitude region, during January-February, Porto Alegre of Brazil bears the maximum opacity whereas during July-August, Lima Callao of Peru bears the maximum opacity. Another important observation is that at any place of northern latitude, the opacity is large during July-August (rainy season) than during January-February (winter season). But the situation is reverse for the places of southern latitude during July-August and January-February. It is also clear (refer to TABLE II) that with increasing latitudinal occupancy, the opacity mostly decreases. This also confirms the idea of least abundances of water vapor in the Polar Regions (Philippe et al. 2010).
Now with the derived values of absorption coefficients and water vapor density at different heights over several places of choice, the present authors are intended to find out water vapor weighting functions (refer to
equation 2) for both the seasons.
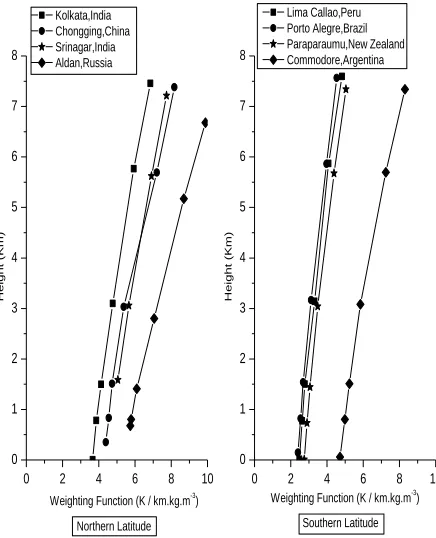
Figure 3 and 4 shows the variation of Height with Weighting Function calculated at 22.234 GHz during January-February and July-August respectively, for the chosen locations of northern and southern latitudes.
International Journal of Emerging Technology and Advanced Engineering
Website: www.ijetae.com (ISSN 2250-2459, ISO 9001:2008 Certified Journal, Volume 3, Issue 12, December 2013)
162 TABLE III and TABLE IV shows the value of weighting function at surface, at around 7-7.5 km and the maximum value of weighting function at the corresponding height for the places of northern and southern latitude for the frequency 22.234 GHz during January through February and during July through August respectively. Similarly, TABLE V and TABLE VI show the same for frequency 23.834 GHz during January through February and during July through August respectively. The value within bracket represents the corresponding height in km.
0 2 4 6 8 10
0 1 2 3 4 5 6 7 8
Kolkata,India Chongging,China Srinagar,India Aldan,Russia
H
e
ig
h
t
(K
m
)
Weighting Function (K / km.kg.m-3)
0 2 4 6 8 10
0 1 2 3 4 5 6 7 8
Southern Latitude Northern Latitude
Lima Callao,Peru Porto Alegre,Brazil Paraparaumu,New Zealand Commodore,Argentina
H
e
ig
h
t
(K
m
)
[image:4.612.337.559.150.420.2]Weighting Function (K / km.kg.m-3)
Figure 3.Variation of Water Vapor weighting function (22.234 GHz) with height at different location for January-February.
0 1 2 3 4 5 6
-1 0 1 2 3 4 5 6 7 8
Lima Callao,Peru
Porto Alegre,Brazil Paraparaumu,New Zealand Commodore,Argentina
H
e
ig
h
t
(k
m
)
Weighting Function (K / km.kg.m-3 )
0 2 4 6 8 10
-1 0 1 2 3 4 5 6 7 8
Southern Latitude Northern Latitude
Kolkata,India Chongging,China Srinagar,India Aldan,Russia
H
e
ig
h
t
(k
m
)
Weighting Function (K / km.kg.m-3
)
Figure 4.Variation of Water Vapor weighting function (22.234 GHz) with height at different location for July-August.
[image:4.612.64.282.266.535.2]International Journal of Emerging Technology and Advanced Engineering
Website: www.ijetae.com (ISSN 2250-2459, ISO 9001:2008 Certified Journal, Volume 3, Issue 12, December 2013)
It is also clear there that at the places of northern and southern latitudes, the curves are steeper from the surface up to a height of 3 km and are curving in nature from a height of 3 km to the top of the height (7-7.5 km) at each location of northern and southern latitude during both the season. This indicates that, from the surface to a height of 3 km, the sensitivity of the variation of atmospheric parameter is not so significant but from the height of 3 km to the top of the height, the sensitivity of the variation of atmospheric parameter is more significant. So it can be concluded that, at 23.834 GHz the vertical resolution of the retrieval of water vapour will be better above a height of 3 km.
3.0 3.5 4.0 4.5 5.0 5.5
0 2 4 6 8
Kolkata,India Chongging,China Srinagar,India Aldan,Russia
H
e
ig
h
t
(
K
m
)
Weighting Function (K / km.kg.m-3)
2.0 2.5 3.0 3.5 4.0 4.5 5.0 0
2 4 6 8
Southern Latitude Northern Latitude
Lima Callao,Peru Porto Alegre,Brazil Paraparaumu,New Zealand Commodore,Argentina
H
e
ig
h
t
(
K
m
)
[image:5.612.336.561.153.420.2]Weighting Function (K / km.kg.m-3)
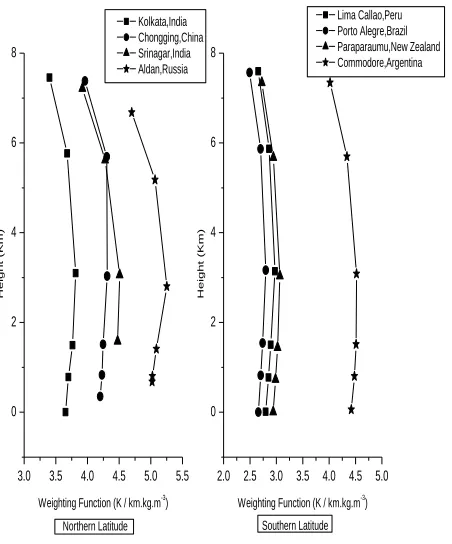
Figure 5. Variation of Water Vapor weighting function (23.834 GHz) with height at different location for January-February.
1.0 1.5 2.0 2.5 3.0 3.5
0 2 4 6 8
Southern Latitude Northern Latitude
Kolkata,India Chongging,China Srinagar,India Aldan,Russia
H
e
ig
h
t
(
K
m
)
Weighting Function ( K / km.kg.m-3 )
2.5 3.0 3.5 4.0 4.5 5.0
0 2 4 6 8
Lima Callao,Peru Porto Alegre,Brazil Paraparaumu,New Zealand Commodore,Argentina
H
e
ig
h
t
(
K
m
)
Weighting Function ( K / km.kg.m-3 )
Figure 6. Variation of Water Vapor weighting function (23.834 GHz) with height at different location for July-August.
It is also evident (refer to the Figure 5 and 6) that at the chosen places of northern latitude, weighting functions are less steeper during January-February than during July-August. So, the sensitivity of the height profile of water vapour is more significant during January-February than July-August. On the other hand, at the chosen places of southern latitude, the sensitivity of the variation of chosen atmospheric parameter is more significant during July-August than January-February. So the vertical resolution of the retrieval of atmospheric parameter will be better during July-August (winter season) than during January-February (rainy season) at the places of southern latitude.
[image:5.612.62.288.299.571.2]International Journal of Emerging Technology and Advanced Engineering
Website: www.ijetae.com (ISSN 2250-2459, ISO 9001:2008 Certified Journal, Volume 3, Issue 12, December 2013)
164 TABLE II
VALUE OF OPACITY AND SURFACE WATER VAPOUR DENSITY OVER EIGHT PLACES AT 22.234 GHZ AND 23.834 GHZ
Place Opacity(db) during January-February
Opacity(db) during July-August
Surface water vapour density during
January-February
Surface water vapour density during
July-August 22.234
GHz
23.834 GHz
22.234 GHz
23.834 GHz
Kolkata, India 0.6086 0.4566 1.7303 1.2606 13.7525 25.0274
Chongging, China 0.4225 0.301 1.3806 0.9866 4.9251 17.398
Srinagar, India 0.3777 0.2623 1.1288 0.7501 5.7001 17.0439
Aldan, russia 0.0583 0.0418 0.9047 0.6298 0.4395 10.7249
Lima Callao, Peru 0.9917 0.7191 0.8591 0.6344 14.901 10.9981
Porto Alegre, Brazil 1.0228 0.7708 0.5467 0.4225 16.7105 12.6489
Paraparaumu, Newzealand 0.8846 0.6642 0.2823 0.2232 12.2924 6.8187
Commodore, Argentina 0.3708 0.2695 0.2666 0.1999 6.7391 4.5543
TABLE III
VALUE OF WEIGHTING FUNCTION AT SURFACE, AT TOP HEIGHT AND THE MAXIMUM VALUE OF WEIGHTING FUNCTION AT THE CORRESPONDING HEIGHT FOR THE PLACES OF CHOICE DURING JANUARY-FEBRUARY AT 22.234 GHZ. THE VALUE WITHIN BRACKET REPRESENTS HEIGHT IN KM.
Places month frequency value of weighting
function (at surface height)
value of weighting function (at top height)
Maximum value of weighting function (at height)
Kolkata, India
January-February 22.234 GHz
3.6633(0.004) 6.8473(7.455) 6.8473(7.455)
Chongging, China 4.3885(0.351) 8.1719(7.38) 8.1719(7.38)
Srinagar, India 5.06(1.585) 7.7388(7.215) 7.7388(7.215)
Aldan, russia 5.7398(0.679) 9.8832(6.68) 9.8832(6.68)
Lima Callao, Peru 2.4766(0.012) 4.8284(7.595) 4.8284(7.595)
Porto Alegre, Brazil 2.3949(0.003) 4.5395(7.565) 4.5395(7.565)
Paraparaumu, Newzealand 2.7466(0.007) 5.0436(7.34) 5.0436(7.34)
Commodore, Argentina 4.7221(0.058) 8.304(7.34) 8.304(7.34)
TABLE IV
VALUE WEIGHTING FUNCTION AT SURFACE, AT TOP HEIGHT AND THE MAXIMUM VALUE OF WEIGHTING FUNCTION AT THE CORRESPONDING HEIGHT FOR THE PLACES OF CHOICE DURING JULY-AUGUST AT 22.234 GHZ. THE VALUE WITHIN BRACKET REPRESENTS HEIGHT IN KM.
Places month frequency value of weighting
function (at surface height)
value of weighting function (at top
height)
Maximum value of weighting function (at
height) Kolkata, India
July-August 22.234 GHz
1.191(0.004) 2.3145(7.485) 2.3145(7.485)
Chongging, China 1.7858(0.351) 3.3714(7.63) 3.3714(7.63)
Srinagar, India 2.477(1.585) 4.2445(7.59) 4.2445(7.59)
Aldan, russia 2.8524(0.679) 4.9899(7.33) 4.9899(7.33)
Lima Callao, Peru 2.8223(0.012) 5.3718(7.62) 5.3718(7.62)
Porto Alegre, Brazil 3.8358(0.003) 7.226(7.555) 7.226(7.555)
Paraparaumu, Newzealand 4.9407(0.007) 8.6966(7.305) 8.6966(7.305)
International Journal of Emerging Technology and Advanced Engineering
Website: www.ijetae.com (ISSN 2250-2459, ISO 9001:2008 Certified Journal, Volume 3, Issue 12, December 2013)
TABLE V
VALUE WEIGHTING FUNCTION AT SURFACE, AT TOP HEIGHT AND THE MAXIMUM VALUE OF WEIGHTING FUNCTION AT THE CORRESPONDING HEIGHT FOR THE PLACES OF CHOICE DURING JANUARY-FEBRUARY AT 23.834 GHZ. THE VALUE WITHIN BRACKET REPRESENTS HEIGHT IN KM.
Places month frequency value of weighting
function (at surface height)
value of weighting function (at top
height)
Maximum value of weighting function (at
height) Kolkata, India
January-February 23.834 GHz
3.6545(0.004) 3.4006(7.455) 3.8132(3.0995)
Chongging, China 4.2012(0.351) 3.9601(7.38) 4.311(3.0335)
Srinagar, India 4.4759(1.585) 3.9203(7.215) 4.5084(3.058)
Aldan, russia 5.0206(0.679) 4.6999(6.68) 5.2524(2.8035)
Lima Callao, Peru 2.7973(0.012) 2.6559(7.595) 2.9745(3.1395)
Porto Alegre, Brazil 2.6589(0.003) 2.4929(7.565) 2.8001(3.1655)
Paraparaumu, Newzealand 2.9394(0.007) 2.7244(7.34) 3.0664(3.0385)
Commodore, Argentina 4.4208(0.058) 4.0187(7.34) 4.5206(3.082)
TABLE VI
VALUE WEIGHTING FUNCTION AT SURFACE, AT TOP HEIGHT AND THE MAXIMUM VALUE OF WEIGHTING FUNCTION AT THE CORRESPONDING HEIGHT FOR THE PLACES OF CHOICE DURING JULY-AUGUST AT 23.834 GHZ. THE VALUE WITHIN BRACKET REPRESENTS HEIGHT IN KM.
Places month frequency value of weighting function (at surface
height)
value of weighting function (at top
height)
Maximum value of weighting function (at
height) Kolkata, India
July-August 23.834 GHz
1.6454(0.004) 1.5553(7.485) 1.7191(3.0145)
Chongging, China 2.2156(0.351) 2.0577(7.63) 2.2821(3.093)
Srinagar, India 2.855(1.585) 2.5973(7.59) 2.8977(3.09)
Aldan, russia 3.1024(0.679) 2.845(7.33) 3.1864(3.011)
Lima Callao, Peru 3.033(0.012) 2.8597(7.62) 3.2358(3.187)
Porto Alegre, Brazil 3.7415(0.003) 3.504(7.555) 3.98(3.182)
Paraparaumu, Newzealand 4.5194(0.007) 4.1179(7.305) 4.7126(3.13)
Commodore, Argentina 4.5997(0.058) 4.1386(7.025) 4.761(2.9165)
III. DISCUSSION AND CONCLUSION
Height profiles of water vapour weighting function along with opacity for two frequencies are discussed so far at resonant frequency 22.234 GHz and line shoulder frequency 23.834 GHz. The window frequency lying at 31.4 GHz are to be used for the cloud liquid water attenuation (when clouds are present). Here, we observe that due to the weakness of the line at 22.234 GHz relative to other microwave frequency, the weighting function at 22.234 GHz do not vary rapidly with height. Subsequently, radiometric measurement of height profile of water vapour exploiting 22.234 GHz cannot produce reasonable accuracy. But on the other hand, the choice of this resonant frequency along with 23.834 GHz is a suitable choice for the radiometric measurement of integrated water vapour.
The response of variation of the weighting function at 23.834 GHz is not suitable up to 3km but after that up to 7-7.5 km it is indicative that the choice of this frequency for
This controversial result up to 3 km for 23.834 GHz creeps in due to the presence of inversion of atmospheric temperature which is a very common factor in the tropical countries.
It may be mentioned here while analyzing the data obtained from BADC, UK, the attenuation co-efficient and the corresponding water vapor weighting functions were evaluated at an interval of 0.5-1 km as the data demands. No interpolation is made in this regard.
REFERENCES
[1] Karmakar, P. K., Maiti, M., Mondal, S., and Angelis, C. F. 2011. Determination of window frequency in the millimeter wave band in the range of 58o north through 45o south over the globe. Advances in
Space Research, 48, 146–151.
International Journal of Emerging Technology and Advanced Engineering
Website: www.ijetae.com (ISSN 2250-2459, ISO 9001:2008 Certified Journal, Volume 3, Issue 12, December 2013)
166 [3] Karmakar, P. K., Maiti, M., Calheiros, A. J. P., Angelis, C. F.,
Machado, L. A. T., and Costa, S. S. D. 2011. Ground-based single-frequency microwave radiometric measurement of water vapour. International Journal of Remote Sensing, 32(23), 1–11.
[4] Li, L., Vivekanandan, J., Chan, C. H., and Tsang, L. 1997. Microwave radiometric technique to retrieve vapor, liquid and ice. IEEE Transactions on Geoscience and Remote Sensing, 35, 224-236.
[5] Liebe, H. J. 1985.An updated model for millimeter wave propagation in moist air. Radio Science, 20, 1069–1089.
[6] Moran, J.M., and Rosen, B.R. 1981. Estimation of propagation delay through troposphere and microwave radiometer data. Radio Science, 16, 235–244.
[7] Mattioli, V., Westwater, E. R., Cimini. D., Gasiewski, A. J., Klein, M., and Leuski, V. Y. 2008. Microwave and millimeter-wave radiometric and radiosonde observations in an arctic environment. Journal of Atmospheric and Oceanic Technology, 25(10), 1768– 1777.
[8] Philippe, R., Benjamin, G., Solène, D., Jean-Pierre, C., Thomas, R., Andreas, M., and Harald, C. 2010. A 183-GHz Radiometer Dedicated To Sound Tropospheric Water Vapor Over Concordia Station, Antarctica. IEEE Transactions on Geoscience and Remote Sensing, 48, 3.
[9] Resch, G.M. 1983. Another look at the optimum frequencies for a water vapour radiometer. TDA progress report, 42–76. Available from http://ipnpr.jpl.nasa.gov/progress_ report/42-76/76A.PDF [accessed 13 May 2011].
[10] Sen, A.K., Karmakar, P.K., Das, T.K., Devgupta, A.K., Chakraborty, P.K., and Devbarman, S. 1989. Significant heights for water vapour content in the atmosphere. International Journal of Remote Sensing, [11] Ulaby, F.T., Moore, R.K., Fung, A.K.1981. Microwave Remote
Sensing: Active and Passive, vol. 1.
[12] Ulaby, F.T., Moore, R.K., and Fung, A.K. 1986. Microwave Remote Sensing: Active and Passive, Vol. 1: Fundamentals and Radiometry. [13] Waters, J.W.1976.Absorption and emission by atmospheric gases. In
Methods of experimental physics, M.L.Meeks.