Full Length Research Article
UNIT DISPLACEMENT OF SHEEP PRODUCTION IN MEXICO BY EFFECT OF IMPORTS
Bobadilla-Soto Encarnación Ernesto, Salas-Razo Guillermo, Padillas-Flores Juan Pablo
and
*Perea-Peña Mauricio
Institute of Agricultural and Forestry Research, University of Michoacana de San Nicolás de Hidalgo, Mexico
ARTICLE INFO ABSTRACT
The aim of this study was to evaluate the displacement of Mexican sheep production units as a result of imports. The country as a whole was taken as the unit of analysis, the information is mainly obtained from SAGARPA (for its acronym in spanish) and sectorial agencies, FAO, Ministry of Economy and the Bank of Mexico, the study was conducted from 1970 to 2011. Data was deflated with National Consumer Price Index for the second half of December 2010. The increases/decreases, average growth rate, inventory, production and imports were determined. To calculate the units of sheep production displaced or not developed by the effect of imports and the blueprint details sheep products where the USP units stratified into four strata by the number of sheep. The average growth rate sheep inventory was 0.71% ending in 2011 with 8.2 million of heads, the production went from 20 800 t in 1970 and 2011 with 56,500 t, the sheep meat imports increased from 161 to 10613 t in the period from 1970 to 2011 with a 10.49 % average growth rate. The displaced units for 2011 as a result of imports were 579,000. The economic policy pursued by the Mexican state has no incentive to domestic production or consumption, but imports of sheep or meat to supply domestic demand.
Copyright © 2015 Bobadilla-Soto Encarnación Ernesto et al.This is an open access article distributed under the Creative Commons Attribution License, which permits unrestricted use, distribution, and reproduction in any medium, provided the original work is properly cited.
INTRODUCTION
Mexico is now one of the countries with the most extensive network of free trade agreements in the world,with more than tentreaties with 32 countries on three continents, anda potential market of over 900 million people (Bobadilla-Soto et al., 2012). The processes of regionalization of tradewere led by the European Unionsince its inception in 1957, now consisting of 27 countries. Mexico in the 1960s, through the Treaty of Montevideo and the Central American Common Market, gained way tothe Latin American Free Trade Association (LAFTA), with the entry of the General Agreement on Tariffs and Trade (GATT) in 1986 now the World Trade Organization (WTO) and the signing of various trade agreements, noted for its great impacton the Free Trade Agreement's (NAFTA) in 1994, the Treaty with the European
Union in 2000. With NAFTA be coming effective, it has generated considerable discussion. The agricultural chapter has meant one of the most contentious issues in
negotiations, differences in capitalization levels, technology and structure, remains unresolved and factors that decrease the
*Corresponding author: Perea-Peña Mauricio
Institute of Agricultural and Forestry Research, University of Michoacana de San Nicolás de Hidalgo, Mexico
competitiveness of the sector. One of the notable changes in trade openness has been a brake on wages from trade liberalization and rising on the profitability of the capital (Puyana and Romero, 2004) as well as the dismantling of the national production as a result of found economic policies (Calva, 1994). In Mexico highlights a change in the configuration of foreign trade increased participation of Asian countries in the volume of imports, strengthening trade relations with the United States of America (USA) and the reduced presence of Mexican products in the European Union. Different were the political and economic events that have affected the food industry and trade in general. There are obvious changes in the marketing of products and the increase in Mexican exports as a whole, but the trade balance remains in most cases negative (Bobadilla-Soto et al., 2012). Sheep farming in Mexico is done across the country, which gives a clear idea of the importance of this activity. Basically sheep production could be divided in to two predominant production systems, extensive and intensive, although lately a combination of both has been successful (Arteaga, 2008). The problems afflicting sheep production is complex, it’s hard to understand why if there is good price for all derivatives of sheep, there is an unmet demand and potential markets, it’s a noble activity, generating jobs.
ISSN: 2230-9926
International Journal of Development Research
Vol. 5, Issue, 02, pp. 3607-3612, February,2015
DEVELOPMENT RESEARCH
Article History:
Received 30th November, 2014
Received in revised form 24th December, 2014 Accepted 14th January, 2015
Published online 27th February, 2015
Key words:
It may be noted that the problems facing the national sheep breeding for many years, poor production efficiency herd stands; a brief analysis of the figures shows that if the population is 6.4 million of animals and 2.1 are killed, this would indicate that only 32.8 percent of the population are sacrificed, while other countries exceed 50 percent (Lucas and Arbiza, 2006). In the extensive system, which is the predominant system in Mexico, nourishment is basically by grazing animals in natural rangelands; capital investment in food, health and infrastructure is low and labor is generally dine by the family. Meanwhile, in the intensive system, an intense use of the productions medium is given, with a significant capital investment in infrastructure and equipment; the value of land is high and labor is employed. Nourishment is defined by taking place through full or partial enclosure, using inputs of high nutritional value (grains and oilseeds), which significantly raises the costs of production (Arteaga, 2008). There are marked differences between the data reported among national and international official institutions, producer associations and individuals, making it difficult to compare and interpret. Statistics and data production exports and imports suggestand give evidence of the behavior of the variables involvedin it, however, from the above; the aim of this study was to evaluate the displacement of Mexican sheep production units by the effect of imports.
MATERIALS AND METHODS
In making the national analysis, it was considered as the unit of analysis the country as a whole. Statistical information contained in this study, belongs to the official publications of the Secretariat of Agriculture, Livestock, Rural Development, Fisheries and Food (SAGARPA for its acronym in spanish) and its line agencies, the user imports information was obtained from the United Nations Food and Agriculture Organization (FAO) and the Ministry of Economy. The data analyzed was inventory, meat production, imports of meat and sheep standing between the years of 1970-2011. Data are deflated using the National Consumer Price Index (NCPI) in the second half of December 2010. Mexican pesos became American dollar (1 dollar USA = 13.4866 Mexican pesos). Increases / decreases, the Average Annual Growth Rate (AAGR) was determined. The data was fitted by the method of least squares to obtain the inventory (Martínez, 1982), production and imports trend, Microsoft Office Excel 2007 was used ©. To calculate the units of sheep production (USP) displacedor not developed by the effect of importsand with data from the product blue print sheep system where the USP stratified into four strataby the number of sheep: Stratum I 1-20 (36.6%); Stratum II 21-100(55.3%); Stratum III 101-500 (7.3%); Stratum IV of 500 (0.8%) sheep; the following formula was used:
USPd = (noi+ tci)* E
Where:
USPd = displaced sheep production units
noi = number of sheep imported
tci = tones of imported sheep meat. Tons became sheep
numbers by dividing tons by the average weight that yields achannel (19 kg) in Mexico according to SAGARPA.
E = percentage of stratum which each one provides.
RESULTS AND DISCUSSION
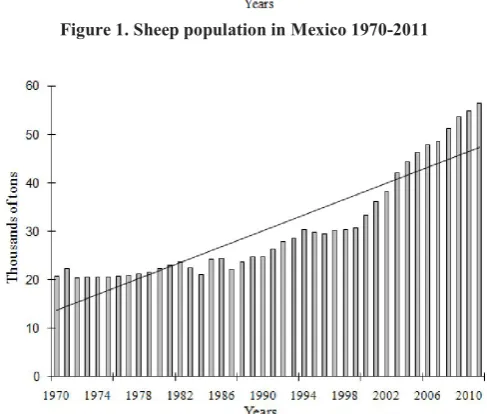
[image:2.595.312.555.305.545.2] [image:2.595.311.555.417.624.2]The sheep population went from 6.1 million in 1970 to 8,200,000 in 2011 with a AAGR of 0.71%, the increase over 40 years was 2.1 million head, in Figure 1 the behavior of the population is shown, being 1985 the year with the lowest population of 5.7 million (Figure 1). The production of sheep meat went from 20780 t to 56546 t in the period from 1970 to 2011 with a AAGR of 2.41 %, the increase was 35766 t (Figure 2). A study from 1980 to 2010 the production AAGR foot channel was positive, the production was covered on average 50 % of the national demand, for the three analyzed decades the growth rate was higher for meat production than on foot, due to the increased weight of animals and was reflected in increased channel performance, this was due to genetic improvement and the management of technologies in sheep production (Nuncio et al., 2012), this is reflected in Figure 2 where there is more growth from 2000 to 2011 with a 4.5 % AAGR.
Figure 1. Sheep population in Mexico 1970-2011
Figure 2. Sheep meat production in Mexico, 1970-2011
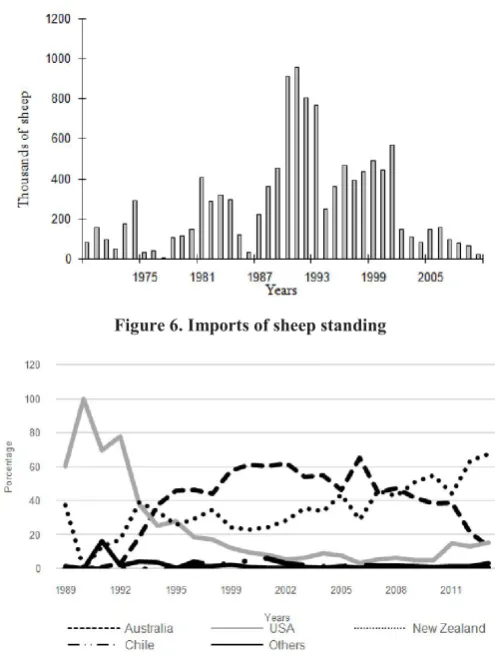
USA dollars /kg was 3.50, 3.17, 2.59, 2.30 and 1.92 (Figure 4). The current orientation of Mexican sheep production is primarily towards the production of meat, gaining high prices in foot and channel compared to other livestock species (the value of sheep meat production in 2003 was USA $ 127,977,285) (Cuellar, 2003), which matches the results of this study. With FAO data, imports of sheep standing from 1970-2011 show no trend since it has shown fluctuation (Figure 5), being 1992 the year where there are more imports with 958,000 animals imported (Figure 6). The strongest inter annual variations occurred in the years 1974, 1979, 1982, 1988, 1991 and 2006 with an increase of 254, 2057, 179, 590, 101 and 73 % according to its preceding year, the years with the highest decrease were 1976, 1978, 1987, 1995, 2003 and 2011, with a percentage of 89, 88, 73, 68, 75 and 67 according to its previous year.
Figure 3. Sheep and other animal species pricing to constant weights
Figure 4. Prices of meat carcass to constant weights
[image:3.595.45.282.254.403.2]Figure 5. Imports of sheep meat
Figure 6. Imports of sheep standing
Figure 7. Participation of countries where sheep for breeding stock are imported
The sheep meat imports increased from 161 to 10,613 t in the period from 1970 to 2011 with an average annual growth rate of 10.49 %, being 2004 when most meat was introduced to the country with 56367 tons (Figure 5). Imports of sheep standing at the beginning were more important than beef in 1970, 80 thousand heads and 161 tons of meat were introduced, being 1992 when more animals were imported with a total of 958,000 and in 2004 the sheep meat peaked with 56 thousand tons, this indicates that first sheep wasimported in foot, changing the trend toward foreign purchases of sheep meat at the end of this study is more important. Sheep scrap from USA, they are also used in preparing barbecue, with its market value almost half the price of meat of domestic sheep, however, is becoming less used that type of animal or mixed with the Mexican cattle, arguing the toughness of the meat of the sheep, and the type of fat you have (harder and yellow), which hinder the marketing of barbecue (Cuellar, 2003), with the introduction of sheep waste brings that domestic prices collapse. Using data from the Ministry of Economy where we have data from 2003 to 2012 will have the following tariff:
Table 1. Import tariff items
Tarriff Description
02042101 Carcasses andhalf-carcasses (meat of sheep, fresh or frozen). 02042299 Other cuts (pieces) bone (mutton, fresh or chilled). 02042301 Boneless (mutton, fresh or chilled).
[image:3.595.41.287.257.756.2] [image:3.595.312.560.687.758.2]In Table 2, the amount of sheep meat are listed in the above tariff, highlighting the 2003, with an import of 10 thousand tons, with an increasing trend, the fraction being the most important 02044101 in 2003 through their participation 2009 which was more than 50% of the 2010 to 2012, the fraction contributed 02044301 over 50 %. The figures FAO does not agree with the Ministry of Economy, in 2003 the FAO reported 40 000 t and the Ministry of Economy 10 000 t, this is a difference of 30 000 t in 2011 reported 10,000 FAO 1404 t Economy with a difference of about 9000 t. The volume of domestic production is in deficit as imports of sheep meat have remained high in recent years and currently range from 43.5 to 50 % of national consumption, which means less than 50 thousand tons of which 100 thousand currently consumed in our country are imported (Arteaga, 2008), which are brought mainly from Australia and New Zealand, which have more than 90 % of world sheep production, as well as Canada, USA and lately Uruguay (Mondragón et al., 2010), in Figure 7 is shown to have greater participation Chile and Uruguay.
Figure 8. Countries participation where they import sheep for breeding
New Zealand was the fourth largest producer of sheep meat, with just 6% of the total sheep population and was the leading exporter with 40% of the total. Like Australia, have developed programs to increase productivity of the herd, which have been reduced but at the same time increasing both the volume and value of exports. Australia has the second largest inventory of sheep in the world with 10 % of the total and was the second largest producer with 8% of total sheep meat and it is the second largest exporter with nearly 30% of exports. In this country, thanks to the implementation of Lambplan program have succeeded in reducing the herd but at the same time increased its productivity, allowing them to maintain the same levels of production and export (Carrera, 2008), which shows
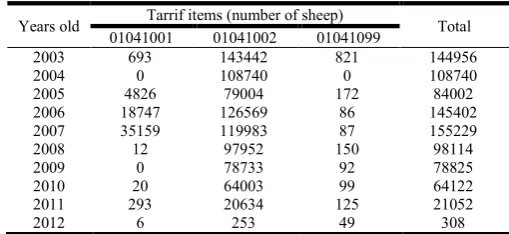
[image:4.595.42.289.444.584.2]that these two countries have emerged as the main introducers of sheep meat to Mexico. The consumption of meat from sheep 95% is in the form of barbecue (Mondragon et al., 2010), meanwhile Molina (2005) reports that 98 % of sheep meat produced in Mexico or imported is intended for the barbecue market. The barbecue is native to central Mexico (State of Mexico, Tlaxcala and Hidalgo), although this spread throughout the country. Mainly consumed in tacos, but this type of food is carried on holidays, celebrations or weekends and is accompanied with broth. The preference of domestic livestock is the freshness of the meat and the presence of visors, to which attribute performance and taste of the product (Molina 2005). There are three tariff items for imports of sheep standing with the 01041001 or certificate of high pedigree registered, 01041002 and 01041099 to supply others (livestock of sheep). The number of sheep for slaughter is the fraction more animal matter in comparison with the other two being 2003 the year recording the highest number of sheep (143,000 heads) and the fraction of high record was in 2007 when it imported 35 thousand livestock for breeding (Table 3).
Table 3. Tariff items sheep standing
Years old Tarrif items (number of sheep) Total 01041001 01041002 01041099
2003 693 143442 821 144956
2004 0 108740 0 108740
2005 4826 79004 172 84002
2006 18747 126569 86 145402
2007 35159 119983 87 155229
2008 12 97952 150 98114
2009 0 78733 92 78825
2010 20 64003 99 64122
2011 293 20634 125 21052
2012 6 253 49 308
[image:4.595.304.559.472.589.2]In Figure 8 the main countries where sheep are imported for breeding highlighting New Zealand and in 2007 was the greater number of sheep imported high registration and participation of this country was shown 98.3%, second Australia introduced in 2006 to 100% of animals with a greater amount to 18 thousand livestock, USA in some year has placed 100% purebred breeding animals to the mexican market remains small amounts (Table 2). Table 4 units displaced sheep production shown were calculated from 2000 to 2011, Stratum II was that turned most affected this is because it contributes 55.3% of the population of sheep in 2004 coincides with the increased meat imports in that year moved to Stratum II over 1.7 million, Stratum I 1.2 million; Stratum III 224,000 and Stratum IV 25, 000 units of sheep production.
Table 2. Import tariff items sheep meat (tons)
Years old Tariff items Total
02041001 02042101 02042299 02042301 02043001 02044101 02044301
2003 0 0.5 15.2 7.6 324.5 9895.8 47.2 10290.8
2004 0.0 0.0 166.9 7.1 2004.2 5395.2 49.0 7622.3
2005 64.9 0.0 54.5 3.4 2797.9 5408.1 203.5 8532.4
2006 0.5 0.0 49.4 2.0 1331.5 6288.0 568.5 8239.9
2007 49.5 56.6 136.2 23.3 568.1 5406.3 639.7 6879.7
2008 50.3 0.0 65.2 13.7 2318.8 4679.1 871.1 7998.3
2009 29.8 705.8 23.4 16.8 496.5 2264.2 724.7 4261.2
2010 0 314.7 8.0 9.3 0.1 687.7 1024.6 2044.3
2011 0 342.7 18.7 12.3 17.1 293.3 720.8 1404.9
Table 4. Sheep production units displaced by stratum
Years old Stratum (number of sheep)
1 a 20 21 a 100 101 a 500 Over 500 2000 1082265 1635226 215862 23656 2001 1103940 1667974 220185 24130 2002 1112744 1681277 221941 24322 2003 828858 1252346 165319 18117 2004 1125605 1700710 224506 24603 2005 762475 1152046 152078 16666 2006 677864 1024204 135202 14817 2007 713976 1078768 142405 15606
2008 654450 988827 130532 14305
2009 430814 650930 85927 9417
2010 305385 461415 60910 6675
2011 212145 320536 42313 4637
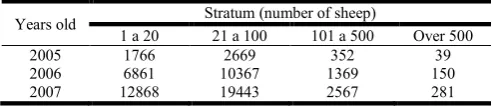
The trend from 2004 to 2011 is down ward, as imports of sheep meat and its tendency was to diminish. This unfavorable environment for the agricultural sector, has resulted in the abandonment of millions of rural producers, the power does not cross the border, given the recession in the United States are forced to augment the reserve army jobber and/or part of the growingun employment in large and mediumcities (Carrera, 2008). Applied the formula for the number of sheep imported to tariff item with high pedigree or certified registered for the years of greatest import (Table 5) in theory should support for 2007 to 12868 Stratum I and Stratum II 19443 units of sheep production as shown in Table 4 for each of the strata and the three years of highest import of this fraction. Study conducted in the State of Mexico in 2007, seventeen months after the subsidies for the purchase of sheep for breeding stock at the time of the survey 16% of family units no longer had a single head of cattle have been delivered, 36 % were declining and only 48% of producers were supported stable or growing.
Table 5. Sheep productio nunits supported in theory
Years old Stratum (number of sheep)
1 a 20 21 a 100 101 a 500 Over 500
2005 1766 2669 352 39
2006 6861 10367 1369 150
2007 12868 19443 2567 281
In the latter group, the estimated growth rate was only 0.6 bellies per year, while those that did were decreasing at a rate of at least ten sows per year, so that globally the growth rate of the herds was bellies least four year. Since in general, the amount of subsidies can purchase a herd of fifteen bellies on average, this means that at this rate of loss of livestock assets in just four years public investment (subsidy) and private investment is lost (contribution producer with own resources) (Martínez-González et al., 2011). This is that policies to agricultural sector have not been appropriate for the above more than 50 % of the units are closed or decreasing; González and Sánchez (2008), reporting inefficiencies in resource allocation to the agricultural sector and is in need of structural changes in national policy. Statistical evidence of the amounts targeted promotion and productivity, it has not been reflected or productivity, competitiveness and social well-being of the mexican population.
Conclusions
The sheep population in forty years (1970-2011) had an average annual growth rate of 0.71%, the production was
amarginal increase inannual average 2.41%, which did not cover the demand of the domestic market first have to import cattle sheep up and after having a AAGR meat of 10.49%. Best price have both feet as sheep carcass compared to cattle, pigs and chickens. With the importation of sheep and beef have been lostor have not been developed for 2011 about 579 thousand units of sheep production and imports of sheep for breeding in theory in 2007 were due to support 35,000 units production. The economic policy developed in the last forty years in the Mexican state has no incentive to domestic production, but imports of sheep or meat to supply domestic demand.
REFERENCES
Arteaga, C.J. 2008. Situación Actual de la Ovinocultura en México. AMCO. II Foro de Rentabilidad Ovina.
Bobadilla-Soto, E.E., Espinoza-Ortega, A. and Martínez-Castañeda, F.E. 2012. Comercio exterior del sector porcino mexicano. Rev. Méx. Cienc. Pec. 3(2):201-214
Bobadilla-Soto, E.E., Espinoza-Ortega, A. and Martínez-Castañeda, F.E. 2010. Dinámica de la producción porcina en México de 1980 a 2008. Rev. Méx. Cienc. Pec. 1(3):251-268
Calva, T.J.L. 1994. Crisis agrícola y alimentaria en México 1982-1988. Segunda edición. Ed. Fontamara, México D.F. Carrera, C.B. 2008. La ovinocultura en México: alternativa para los productores rurales? UACJ. Avances Cuadernos de Trabajo 207: 1-17
Cuéllar, O.J.A. 2003. Perspectivas de la ovinocultura en México. Mem. Segundo Seminario sobre Producción Intensiva de Ovinos. Villahermosa, Tabasco.
González, E.A. and Sánchez, Y. 2008. Ineficiencia de las transferencias del estado a la agricultura mexicana. Revista mexicana de economía y de los recursos naturals 1: 7-26. Huerta, H.M. and Chávez, P.M.F. 2003. Tres modelos de
política económica en México durante los últimos sesenta años. Análisis Económico 37: 55-80
Lucas, L.J. and Arbiza, A.S. 2006. Situación y perspectivas, la producción de carne ovina en México. Bayvet. 21: 22-28. Martínez, G.A. 1982. Métodos econométricos. Colegio de
Posgraduados. Motecillos, Estado de México.
Martínez-González, E., Muñoz-Rodríguez, M., García-Muñiz, J., Santoyo-Cortés, V., Reyes Altamirano-Cárdenas, J. and Romero-Márquez, C. 2011. El fomento de la ovinocultura familiar en México mediante subsidios en activos: lecciones aprendidas. Agronomía Mesoamericana 22(2): 367-377.
Molina, C.L. 2005. Aplicación de una medida de salvaguarda, a las importaciones de cortes secundarios de carne congelada de ovino, como un impulso a la cadena productiva y de comercialización ovina en México. Tesis de licenciatura. Instituto de ciencias económico administrativo de la UAEH.
Mondragón, A.J., Domínguez-Vara, I.A., Rebollar, R.S., Borques, G.J.L. and Hernández, M.J. 2010: Canales de comercialización de la carne de ovino en Capulhuac Estado de México. En: Cavallotti VBA, Marcof ACF y Cesin VA (coordinadores). Los grandes retos de la ganadería: hambre, pobreza y crisis. UACH-CP 341-349.
[image:5.595.39.286.463.516.2]producción, importación y precio de la carne ovina en México y Michoacán (1980-2010). 13er Congreso nacional de investigación socioeconómica y ambiental de la producción pecuaria. 18 y 19 de octubre. Colegio de Posgraduados Puebla, México. 579-585
Romero, J. and Puyana, A. 2004. Evaluación integral de los impactos e instrumentación del capítulo agropecuario del TLCAN. Documento Maestro. Chapingo, Estado de México. Universidad Autónoma de Chapingo.