Full Length Review Article
ANALYTICAL QUALITY BY DESIGN (AQBD): NEW PARADIGM FOR ANALYTICAL METHOD
DEVELOPMENT
*Mohini Bajaj and Sanju Nanda
Department of Pharmaceutical Sciences, Maharshi Dayanand University, Rohtak, Haryana (India) -124001
ARTICLE INFO ABSTRACT
Quality of a finished product is gauged by compliance of certain predetermined specifications. This is ascertained by validated analytical procedures carried out by quality control personnel and laid down by the Quality Assurance (QA) department of a pharmaceutical company. In the present scenario, testing of the finished product alone is not sufficient, but emphasis is on ‘Total Quality Management’ through in-process testing and analysis. To achieve this goal, Quality by Design (QbD) concept has already been introduced and practised by all countries following guidelines of International Conference on Harmonization (ICH guidelines). Other features like Quality Risk Management, Pharmaceutical Quality System and Process Analytical Technology (PAT) guidelines are also being now introduced and integrated into analytical method development processes. They are very popularly accepted as AQbD (Analytical Quality by Design) concepts by the industry. Though not officially circulated, this new paradigm has attracted appreciation from all concerned and is evident by increasing publications in this field. The day may not be far off when this becomes official. Till then, certain observations and suggestions are compiled and presented through this review paper.
Copyright © 2015 Mohini Bajaj and Sanju Nanda.This is an open access article distributed under the Creative Commons Attribution License, which permits unrestricted use, distribution, and reproduction in any medium, provided the original work is properly cited.
INTRODUCATION
Quality should be built in by design, it cannot be tested in a product, is the main motto of ‘Total Quality Management’. To achieve this goal of optimized quality product, the knowledge gained from pharmaceutical development studies and manufacturing provides the scientific background. The method optimization was earlier based on One Factor at a Time (OFAT) approach (Bhoop Bhupinder Singh et al., 2013) where a single component was varied with time and its effect studied.
This approach was not much helpful as it neglected the effect caused due to interaction of more than one factors. Now a day, the approach followed is Quality by Design (QbD) which employs Design of Experiments (DoE) as important concept. DoE approach is a systematic, scientifically analysed better understandable approach. The figure 1 highlights the demerits of OVAT leading to use of DOE approach.
*Corresponding author: Mohini Bajaj
Department of Pharmaceutical Sciences, Maharshi Dayanand University, Rohtak, Haryana (India) -124001
Regulatory Control Guidelines emphasising QbD
The QbD approach which is based on scientific and methodical product development was included in the quality guidelines of International Conference on Harmonization (ICH) from 2005 onwards. This approach includes, ICH Q8 (Pharmaceutical Development), Q9 (Quality Risk Management), and Q10 (Pharmaceutical Quality System) guidelines. The pharmaceutical products quality was also emphasised in Process Analytical Technology (PAT) guidelines for new pharmaceutical product development and quality. In 2004, USFDA agreed to include QbD in “Pharmaceutical cGMP 21st Century- A risk based approach” (ICH, 2009 and Sangshetti Jaiprakash et al., 2014).
Some key definitions as given by ICH Q8 are mentioned below:
Design space: “The multidimensional combination and interaction of input variables (e.g., material attributes) and process parameters that have been demonstrated to provide assurance of quality. Working within the design space is not considered as a change.”
ISSN: 2230-9926
International Journal of Development Research
Vol. 5, Issue, 02, pp. 3589-3599, February,2015
International Journal of
DEVELOPMENT RESEARCH
Article History:
Received 27th November, 2014 Received in revised form 18th December, 2014 Accepted 23rd January, 2015 Published online 27th February, 2015
Key words:
Analytical method, DoE, Design space, HPLC,
Design of Experiments, AQbD,
Modelling, Software DoE, Simulator.
Fig. 1. Showing demerits of OFAT leading to DOE approach
Design of Experiments: “A structured, organized method for determining the relationship between factors affecting a process and the output of that process.”
Process Analytical Technology (PAT): “A system for designing, analyzing, and controlling manufacturing through timely measurements (i.e., during processing) of critical quality and performance attributes of raw and in-process materials and processes with the goal of ensuring final product quality.”
ICH Q9 guideline considers quality risk management as a valuable component of an effective quality system. Risk is defined as the combination of the probability of occurrence of harm and the severity of that harm. It is important to understand that product quality should be maintained throughout the product lifecycle. This further ensures the high quality of the drug product.
ICH Q10 guideline describes model quality management system for pharmaceutical manufacturing.
QbD Principles for Analytical Method Development
Analytical testing, is a critical step for pharmaceutical development processes like raw material analysis, in-process checking, release testing, stability studies. To ensure the quality product analytical method should also be in unison with the QbD and PAT. Thus, due stress should also be laid on regulatory guidelines for AQbD describing the development of method as per DoE including risk management system and details of quality systems required (Bhoop et al., 2010).
Proposed key definitions for AQbD (Tang, Yubing, 2014 and Chatterjee, Sharmista, 2013)
[image:2.595.40.289.64.205.2]According to ICH Q8, main terminology used in the process optimization are Quality Target Product Profile (QTTP), Design Space (DS) and Design of Experiments (DoE). The analogous terminologies for analytical method development used by quality experts are Analytical Target Profile (ATP), Method Operable Design Region (MODR) and Method Development Strategy (MDS).
Fig. 2. Comparative terminology for QbD and AQbD
The definition of these terms are given in the figure
3.
Fig. 3. Key definitions for AQbD
Steps involved in Analytical Method development in unison with QbD (Sangshetti Jaiprakash et al., 2014; Candioti Luciana Vera et al., 2014; Karmarkar et al., 2011 and Debrus et al., 2013)
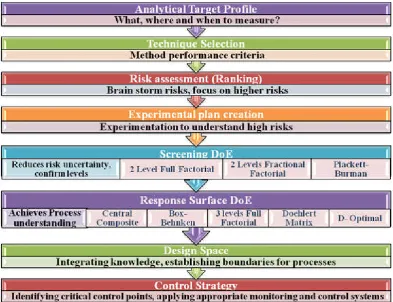
The first step in designing of analytical methods by using the principle of QbD is the selection of the type of analytical method and the various factors affecting the method. These factors can be classified as primary parameters and secondary parameters. This step involves the study of primary parameters. The parameters are then prioritized based on the extent of the effect caused on analysis. This phase is followed by Screening phase which, calculates approximately the effects of secondary parameters on selected responses (like resolution and selectivity in case of HPLC). The model which can be used for this stage are Two Levels Full Factorial, Two
Levels Fractional Factorial, Plackett- Burman. The next step
is response surface generation by using any of the method from Central Composite Design, Box-Behnken Design, Full Factorial Design at three levels, Doehlert Matrix Design or
D- Optimal design. This stage is followed by the optimization
stage which employs the use of computer software as well virtual screening to determine MODS.
[image:2.595.315.553.297.455.2]This approach when applied to HPLC analytical method development includes four main steps: The first step is to determine primary parameters like screening of column chemistry, organic modifier, pH of buffer and mobile phase. This is followed by next step where the selectivity optimization is confirmed through changes in gradient time and mobile phase temperature. Finally, column geometry optimization to get sufficient resolution and MODS is determined. The optimization process is a continuous process and should be monitored from time to time for efficient outcome. Figure 4 gives the schematic representation of the steps involved in analytical method development.
Computer softwares used in optimization of parameters and generation of MODS (Bhoop Bhupinder Singh et al., 2013 and Debrus et al., 2013)
[image:3.595.103.497.207.509.2]The method development based on structure defining physicochemical parameters is in vogue.
Table 1. Computer Softwares used for HPLC and DoE.
Software for Chromatography Software for DoE DryLab
(Molnár Institute, Germany)
Fusion AE
(S-Matrix, United States) ACD/LC and GC Simulator
(ACD/Labs, Canada)
MODDE (Vicenza, Italy) ChromSword
(ChromSword Group, Latvia)
Design Expert (State-Ease Inc., USA) Osiris
(Datalys, Grenoble, France)
Modde
(Umetrics,Sweden) JMP
(SAS Institute Inc.) Unscrambler (CAMO, Norway)
A simple example is selection of conditions for chromatographic method development on the basis of structure of drug defining physicochemical properties like logP, logD, pKa etc. The advent of computer technology has reduced the time required for calculation and results are more precise with the use of statistical methods for treatment of data. The various statistical methods used can be Multiple Linear Regressions (MLR), Partial Least Square (PLS) or Principal Component Analysis and other tools like Analysis of Variance (ANOVA), student’s t-test, Pearson coefficient are also used whenever required.
This is made much easier by the use of computer based programmes. The given Table 1 shows some of the softwares used for chromatographic and DOE simulations.
Review of some publications for Analytical Methods employing DoE concept
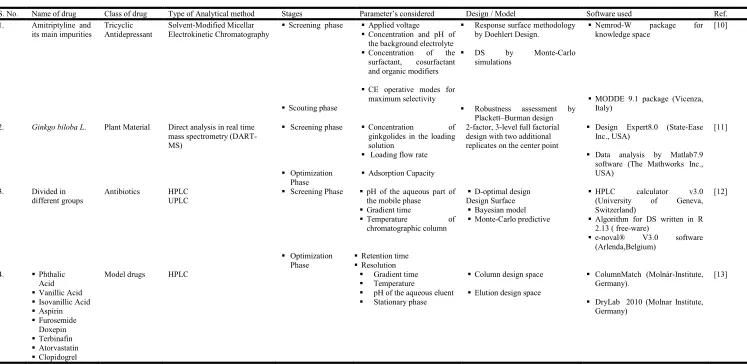
The information from various publications using concept of QbD and PAT including DoE concept for the development of the analytical method for assay and determination of stability has been compiled in Table 2. The main parameters selected for the collation are the screening along with optimization parameter.
[image:3.595.50.275.642.768.2]These are the two main steps which are foundation of the further decision making. The models or designs used for screening as well as response surface designing are also compiled. The computer software packages, if used are also included as important parameter for designing.
Fig. 4. Showing steps involved in the DOE and designs employed for Screening and Response Surface Steps
Table 2. Highlighting the various important parameters studied in DoE
S. No. Name of drug Class of drug Type of Analytical method Stages Parameter’s considered Design / Model Software used Ref. 1. Amitriptyline and
its main impurities
Tricyclic Antidepressant
Solvent-Modified Micellar Electrokinetic Chromatography
Screening phase
Scouting phase
Applied voltage Concentration and pH of
the background electrolyte Concentration of the
surfactant, cosurfactant and organic modifiers
CE operative modes for maximum selectivity
Response surface methodology by Doehlert Design.
DS by Monte-Carlo simulations
Robustness assessment by Plackett–Burman design
Nemrod-W package for knowledge space
MODDE 9.1 package (Vicenza, Italy)
[10]
2. Ginkgo biloba L. Plant Material Direct analysis in real time mass spectrometry (DART-MS)
Screening phase
Optimization Phase
Concentration of ginkgolides in the loading solution
Loading flow rate
Adsorption Capacity
2-factor, 3-level full factorial design with two additional replicates on the center point
Design Expert8.0 (State-Ease Inc., USA)
Data analysis by Matlab7.9 software (The Mathworks Inc., USA)
[11]
3. Divided in different groups
Antibiotics HPLC UPLC
Screening Phase
Optimization Phase
pH of the aqueous part of the mobile phase Gradient time
Temperature of chromatographic column
Retention time Resolution
D-optimal design Design Surface
Bayesian model Monte-Carlo predictive
HPLC calculator v3.0 (University of Geneva, Switzerland)
Algorithm for DS written in R 2.13 ( free-ware)
e-noval® V3.0 software (Arlenda,Belgium)
[12]
4. Phthalic Acid Vanillic Acid Isovanillic Acid Aspirin Furosemide
Doxepin Terbinafin Atorvastatin Clopidogrel
Model drugs HPLC Gradient time
Temperature
pH of the aqueous eluent Stationary phase
Column design space
Elution design space
ColumnMatch (Molnár-Institute, Germany).
DryLab 2010 (Molnar Institute, Germany)
[13]
5. Luliconazole in bulk and cream formulation
Antifungal drug HPLC Screening phase
Optimization phase
Acid Hydrolysis Alkali degradation
Oxidative degradation Dry heat degradation Wet heat degradation
Factorial design
Multiple Regression equation
3 variables at two levels
2 variables at two levels
ColumnMatch (Molnár-Institute, Berlin, Germany)
DryLab 2010 (Molnár-Institute, Germany)
[14]
6. Hydrolyzed Protamine sulfate peptides
Biotechnologica l Products
RP-HPLC Screening Phase
Optimization phase
Mobile phase pH Flow rate
Column temperature Injection volume Methanol concentration
Peak Resolution USP tailing
Plackett–Burman experimental design
Multivariate regression Pareto ranking analyses
Box–Behnken design
NA [15]
7. Histamine Paroxetine Cetirizine Caffeine Pseudoephedrin
e Serotonin Dopamine
DL-Norepinephrine
Model drugs Supercritical Fluid Chromatography
Screening
Robust method optimization
Nature of stationary and mobile phase
Concentration of TFA dissolved in methanol Temperature
4 factors central composite design
Polynomial equation using multiple linear equation Monte–Carlo simulations
Chemstation (Agilent) Empower3(Waters) HPLC calculator JMP10.0.0 (SAS Institute)
[16]
8. Acetaminophen Phenylephrine Chlorpheniramine
Common-cold pharmaceutical formulation
HPLC Screening stage
Optimization Designs
pH of the aqueous part Gradient time
Selectivity
Plackett and Burman design
Full factorial design Fractional factorial design D optimal design Central Composite Designs
In-house computer software
[17]
9. Spirospermum penduliflorum
Thouars (Menispermaceae)
Vasorelaxantap orphine alkaloids (dicentrine and neolitsine)
HPLC-UV Screening stage
Validation
Mobile phase pH Initial proportion of
methanol Gradient slope
Full factorial design of 36 experimental condition
Multiple linear equations
[18]
10. API and P4NX99-D, the P4NX99 molecule
Coded drug and impurities
Stability-indicating LC-MS method
Optimization of the method for the determination of impurities and the API
Optimization of the method taking into account the aged matrix
LC factors Flow rate Injection volume
MS factors Cone temperature Capillary temperature Nebulizer gas Desolvation gas Cone voltage Capillary voltage Dwell time
Polynomial Regression Monte Carlo simulations for
error propagation Grid search method
RStudio v 0.96 a Integrated Development Environment (IDE) e.noval software v3.0 (Arlenda,
Belgium)
[19]
11. Ebastine and its pharmaceutical formulations
Antihistaminic Stability-indicating UHPLC
Screening Phase
Optimization
Gradient time Temperature
Ternary composition of the eluent
Flow rate
Start and end concentration of the gradient
Selectivity
2-D resolution maps 3-D resolution cube
DryLab (Molnar Institute,
Germany) [20]
12. Atomoxetine Treatment of Attention Deficit Hyperactivity Disorder
HPLC impurity method Screening phase
Optimization phase
pH of mobile phase Buffer concentration Organic solvent
concentration Ion-Pair concentration Column temperature
Five-factor, two-level fractional factorial design with four centerpoints
[21]
13. Darifenacin and degradation prodcts
M3 selective receptor antagonist
RP-UPLC Temperature,
% organic ratio Buffer pH
Central Composite Design DesignExpert version 8.0.7.1(Stat-Ease, Inc., USA)
[22]
14. 15
Antipsychotic Basic Drugs
RP-LC Initial screening
Selectivity optimization
Robust optimization
Column chemistry Mobile phase pH Organic modifier
Changes in gradient time Mobile phase temperature Resolution
Stepwise Regressions Error propagation by Monte
Carlo Simulations
Fusion AE 9.6 (Matrix Softwares) [23]
15. Pramipexole Parkinson’s Disease Restless
Legs Syndrome
RP-HPLC Gradient time
Temperature pH of aqueous eluent Flow Rate
Start and end concentration of organic mobile phase
Multi-Factorial Design Space DryLab (Molnár-Institute, Germany)
[24]
16. Furosemide Diuretic RP-HPLC Primary Parameter Selection
Secondary Parameter Screening
Method Optimization
Organic modifier Buffer pH Gradient time Initial hold time
Initial % organic modifier Final % organic modifier Flow rate
IV optimal design and cubic model for individual design
Taguchi orthogonal array
Face centred central composite design
DesignExpert version 8.0.7.1(Stat-Ease, Inc., USA)
[25]
17.
4-dimethylaminopyri dine impurity in glucocorticoids
Genotoxic impurity
LC–MS/MS Initial screening
Optimization
For HPLC Flow Gradient Injection Volume
For MS
Cone Voltage Collision Energy
Separation of peaks peak prea
Length of analysis signal to noise ratio
Regression Analysis
Fractional Factorial
Quadratic model, Central Composite Face
Modde 9.0.0.0 (Umetrics, Sweden) [26]
18. API and P4NX99-D
Liquid Chromatography (LC)
Screening phase
Optimization of the method for the determination of impurities and the API
Optimization of the method taking into account the aged matrix
Organic modifier % pH of mobile phase Column type
Analyzer resolution Accuracy Signal noise ratio Signal spikes in total ion
current
D-optimal mixture design
Polynomial regression response modelling
Monte Carlo simulations for error propagation
RStudio v0.96, Integrated Development Environment (IDE) e.noval v3.0 (Arlenda, Belgium)
[27]
19. Bovine serum albumin
Biological product
UPLC Screening Phase
Optimization Phase
Acetonitrile (%) Formic Acid (%) Boiling Time
Percentage Bovine Serum Albumin Loss
Multivariate data-analysis Modde 8.0.2 software (Umetrics, Sweden)
[28]
20. Zileuton racemate in bulk and tablet Formulation
Inhibits 5-Lypoxygenase
RP-HPLC-PDA
LC – GC
Screening phase
Optimization phase
Methanol content Flow rate
Concentration of orthophosphoric acid
Central Composite Design (CCD) and Response Surface Methodology
Multiple Linear Regression (MLR) and ANOVA
Design Expert (Stat-Ease Inc., US)
[29]
21. Separation of curcumin, arteether, tetra- hydrocurcumin and dihydroar- temisinin
Malaria HPLC Screening phase
Optimization phase
Percentage of organic modifier
Flow rate of the mobile phase
Column temperature
Full Factorial Design Empower2.0 forWindows
e-noval® V3.0
software(Arlenda, Belgium).
[30]
22. Noradrenergic Dopaminergic Serotonergic
Compounds from Mouse Brain Tissue
Multiple Neuropsychiatri c Disorders
Reversed-Phased Ion-Pair With Amperometric End-Point Detection
Screening phase
Optimization
Modifier
Methanol concentration pH of mobile phase Column temperature Ion-Pair counter
concentration Voltage of detector
Resolution Analysis time
Two-Level Fractional Factorial Experimental Design
JMP® 8.0.1 software (SAS Institute Inc.)
[31]
23. Six organotin compounds
Toxins in water Headspace-Solid-Phase Micro-Extraction (HS-SPME) combined with Gas chromatography Tandem Mass Spectrometry (GC– MS/MS)
Screening
Optimization
Extraction efficiency Pre- incubation time Incubation temperature Agitator speed Extraction time Desorption temperature Buffer (pH , concentration
and volume) Head space volume Sample salinity Preparation of Standards Ultrasonic time
Desorption time in injector
GC-IT-MS/MS Excitation voltage Excitation time Ion source temperature Isolation time Electron energy
Plackett–Burman design (Screening method)
Central Composite Design (CCD)
Full Factorial Design
MINITAB program. [32]
24. BEL097 BEL174
Coded drugs HPLC with polysaccharide-based stationary phase
Screening phase
Optimization phase
Trifluoroacetic acid (TFA) concentration
n-Hexane concentration Column temperatures
Resolution or separation criterion
Central Composite Design (CCD)
Monte Carlo simulations
JMP v 8.0.2 (SAS Institute, Tervuren, Belgium)
[33]
25. Sulfadiazene Sulfacetamide Sulfathiazole
Antibiotics HPLC Screening phase
Optimization phase
Pump flow rate Gradient time Gradient slope
Column oven temperature Maximise resolution Minimize retention time
Experimental Error Transformation Regression Outlier Residuals
Pareto Ranking Analyses
Fusion AE (Matrix software) [34]
26. Vancomycin Antibiotics UPLC Rapid Screening
Optimization
Column chemistry Buffer pH
Organic mobile phase
Pump flow rate Gradient time Final % organic Column temperature
Rank Response Variable Monte Carlo Simulation Process Capability Statistics
Fusion ( Matrix) Empower 2 software
[35]
27. Linagliptin Diabetes Type II
Stability indicating HPLC
Screening
Optimization
% Organic
component Column chemistry Gradient time
Run time
Selectivity Factor Capacity Factor
Monte Carlo Simulation Fusion AE (Matrix Software) Agilent 1200 Infinity Series
Method Development Solution [36]
28. Coenzy
me Q10
Ascorbi
c Acid
Folic
Acid
Nutraceutical Microemulsion Electrokinetic
Chromatography Method (MEEKC)
Mixture Components Buffer
Surfactant–Cosurfactant Oil
Process Variables Voltage
Buffer Concentration Buffer pH
I-optimality criterion MPV models
Special-cubic mixture model
[37]
29. Compound A Coded Sample HPLC Instrumentation and chromatographic Conditions System suitability
test Intermediate
precision study Robustness study
% Acetonitrile (ACN) pH of Mobile Phase Detector Wavelength Column Temperature Flow Rate
Buffer Concentration Column Types
Fractional Factorial Design
JMP® software [38]
30. Almotriptan and its
main Impurities
Migraine Headaches
Capillary
Electrophoresis (CE)
Scouting Phase
Screening Asymmetric Matrix
CE operative modes Addition of pseudo
stationary phases
Additives to the background electrolyte
Process Variables (PVs) Voltage
Temperature Buffer Concentration
Buffer pH
Mixture Components (MCs) Borate Buffer,
n-Heptane as Oil Sodium Dodecyl
Sulphate/N-Butanol As Surfactant/Cosurfactant
Monte-Carlo simulations MPV D-optimal design
MODDE (Umetrics, Sweden) [39]
Conclusion
The paradigm shift from OFAT to QbD (DoE) has supported the pharmacy professionals to cater the needs of combative Quality Assurance. Discerning the importance of analytical methods in pharmaceutical formulation development, the same principles should be applied to analytical method development also. The main endeavour of review is to focus on the use of aforementioned Design of Experiment concept in Research and Development and afterwards translation to Quality Assurance Department. The number of research publications reviewed in the paper endorses the fact. The designing increases the confidence in the method developed, as it covers all the aspects and compiles the results categorised under the Design Space. The initial process is costly but ultimately becomes cost effective in case of errors and risks. The benefits of Analytical Quality by Design concept are enormous. The main is during regulatory registration, the changes within the design space for the formulation development do not require refilling. So, to make the process of change in analytical method for registered product unproblematic, regulatory agencies should issue the guidelines pertaining to Analytical Quality by Design. The awareness in the professionals can be ensured by conducting various training programmes, workshops and awareness campaigns. Another important aspect is use of computer software for accurate statistical analysis of data. Cheaper reliable software accessibility will be appreciable. Thus, concluding with the remarks that Analytical Quality by Design is in infancy recently, will grow with regulatory control to its full potential.
REFERENCES
Aldem, Peter G., Potts, Warren, Yurach and Dana, ?. “A QBD with Design of Experiments Approach to the development of a Chromatographic Method for Separation of Impurities of Vancomycin.”Application notes, Water Cooperation, 34 Maple Street, Milford, USA, PageNo. 1-8.
Amandine Dispas, Pierre Lebrun, Bertyl Andri, Eric Rozet and Philippe Hubert, 2014. “Robust method optimization strategy—A useful tool for method transfer: The case of SFC.” Journal of Pharmaceutical and Biomedical Analysis
88: 519–524.
Bhoop Bhupinder Singh, Raza Kaisar and Beg Sarwar, 2013. “Developing “Optimized” Drug Products Employing “Designed” Experiments.” Chemical Industry Digest (June 2013): 70-76.
Bhoop, Bhupinder Singh, Kapil and Rishi, 2010. “Developing DDS via modern DoE approaches.” Chronicle Pharmabiz, November 25, 2010 A special supplement, 30-32.
Binjun, Yan, Teng, Chen, Zhilin, Xu, Haibin, Qu. 2014. “Rapid process development of chromatographic process using direct analysis in real time mass spectrometry as a process analytical technology tool.” Journal of Pharmaceutical and Biomedical
Analysis 94: 106–110. Short communication
Candioti Luciana Vera, Zan María M. De, Cámara María, S. and Goicoechea Héctor, C. 2014. “Experimental design and multiple response optimization. Using the desirability function in analytical methods development.” Talanta 124: 123–138. Chatterjee, Sharmista, 2014. “QbD consideration for analytical
methods- FDA perspective.” Presented on Jan, 25, 2013, htt://www.fda.gov/downloads/About FDA/centers office/ office of Medical Products and Tobacco/CDER/UMC35 9266.pdf accessed on 15 July.
Coscollà, Clara, Olivares Santiago, Navarro, Martí, Pedro, Yusà and Vicent, 2014. “Application of the experimental design of experiments (DoE) for the determination of organotin compounds in water samples using HS-SPME and GC– MS/MS”, Talanta 119:544–552.
Debrus, Benjamin, Guillarme, Davy, Rudaz and Serge, 2013. “Improved quality-by-design compliant methodology for method development in reversed-phase liquid chromatography.” Journal of Pharmaceutical and Biomedical
Analysis 84: 215– 223.
Debrus, Benjamin., Guillarme, Davy., Rudaz and Serge., 2013. “Improved quality-by-design compliant methodology for method development in reversed-phase liquid chromatography.” Journal of Pharmaceutical and Biomedical
Analysis 84: 215– 223.
Debrusa, Benjamin, Lebruna, Pierre, Ceccatob, Attilio, Caliaroc, Gabriel, Rozeta, Eric, Nistora, Iolanda, Opreand, Radu, Rupéreze, Francisco J., Barbase, Coral, Boulangerf, Bruno, Huberta and Philippe, 2011. “Application of new methodologies based on design of experiments, independent component analysis and design space for robust optimization in liquid chromatography.” Analytica Chimica Acta 691:33– 42.
Furlanettoa, S., Orlandini, S., Pasquini, B., DelBubba, M. and Pinzauti, S. 2013. “Quality by Design approach in the development of a solvent-modified micellar electrokinetic chromatography method: Finding the design space for the determination of amitriptyline and its impurities.” Analytica
Chimica Acta 802: 113–124.
Ganorkar, Saurabh, B., Dhumal, Dinesh, M. and Shirkhedkar Atul, A. 2014. “Development and validation of simple RP-HPLC-PDA analytical protocol for zileuton assisted with Design of Experiments for robustness determination.”
Arabian Journal of Chemistry: http://dx.doi.org/10.1016/
j.arabjc. 03.009.
Gavin, Peter, F., Olsen and Bernard, A., 2008. “A quality by design approach to impurity method development for atomoxetine hydrochloride (LY139603).” Journal of
Pharmaceutical and Biomedical Analysis 46: 431–441
Hubert, C., Lebrun, P., Houari, S., Ziemons, E., Rozet, E. and Hubert, Ph., 2014. “Improvement of a stability-indicating method by Quality-by-Design versus Quality-by-Testing: A case of a learning process” Journal of Pharmaceutical and
Biomedical Analysis 88:401–409.
Hubert, C., Lebrun, P., Houari, S., Ziemons, E., Rozet, E. and Hubert, Ph. 2014. “Improvement of a stability-indicating method by Quality-by-Design versus Quality-by-Testing: A case of a learning process.” Journal of Pharmaceutical and
Biomedical Analysis 88: 401–409.
International Conference on Harmonization (ICH) of Technical Requirements for Registration of Pharmaceuticals for Human Use, Topic Q8 (R2): Pharmaceutical development, 2009, Available at: http://www.ich.org/fileadmin/Public Web Site/ICH Products/Guidelines/Quality/Q8 R1/Step4/Q8R2 Guideline.pdf
Karmarkar, S., Garber, R., Genchanok Y., George, S., Yang X. and Hammond, R. 2011. “Quality by Design (QbD) Based Development of a Stability Indicating HPLC Method for Drug and Impurities.” Journal of Chromatographic Science, 49: 439-446.
Kurmi, Moolchand, Kumar, Sanjay, Singh, Bhupinder, Singh and Saranjit, 2014. “Implementation of design of experiments for optimization of forced degradation conditions and development of a stability-indicating method for furosemide.”
Journal of Pharmaceutical and Biomedical Analysis 96: 135– 143.
Lateef, Sayed salman and Vinayak, A K. 2014. “Quality-by-Design Approach to Stability Indicating Method Development for Lingliptin Drug Product.”Application Notes, Agilent Technologies Inc., Banglore, India, Accesed on April. Mbinzea, J. K., Dispasa, A., Lebruna, P., MavarTayeyMbay, J.,
Habyalimanaa, V., Kalendaa, N., Rozeta, E., Huberta, Ph. and Marinia, R.D., 2013. “Application of an innovative design space optimization strategy to the development of LC methods for the simultaneous screening of antibiotics to combat poor quality medicines.” Journal of Pharmaceutical
and Biomedical Analysis 85: 83–92.
Memvangaa, Patrick, B., Mbinzeb, Jérémie, K., Rozet, Eric, Hubert, Philippe, Préat, Véronique, Marini and Roland, D., 2014. “Development of a liquid chromatographic method for the simultaneous quantification of curcumin, arteether, tetrahydrocurcumin and dihydroartemisinin. Application to lipid-based formulations.” Journal of Pharmaceutical and
Biomedical Analysis 88: 447–456.
Monks, K. E., Rieger, H. J. and Molnár, I. 2011. “Expanding the term “Design Space” in high performance liquid chromatography (I).” Journal of Pharmaceutical and
Biomedical Analysis 56: 874– 879.
Murthy, M. Vishnu, Krishnaiah, Ch., Srinivas, K., Rao K. Srinivasa, Kumar, N., Ramesh and Mukkanti, K. 2013. “Development and validation of RP-UPLC method for determination of darifenacin hydrobromide, its related compounds and its degradation products using design of experiments.” Journal of Pharmaceutical and Biomedical
Analysis 72:40-50.
Nguyen, A.T., Aerts, T., Van Dam, D. and De Deyna, P.P. 2010. “Biogenic amines and their metabolites in mouse brain tissue: Development, optimization and validation of an analytical HPLC method.” Journal of Chromatography B, 878: 3003– 3014.
Nistora, Iolanda, Lebrun, Pierre, Ceccato, Attilio, Lecomte, Frédéric, Slama, Ines, Radu Oprean, Eduard Badarau, Fabien Dufour, Katin Sourou Sylvestr, Dossou, Marianne Fillet, Jean-Franc¸ ois Liégeoise, Philippe Hubert and Eric Rozet, 2013. “Implementation of a design space approach for enantiomeric separations in polar organic solvent chromatography.” Journal
of Pharmaceutical and Biomedical Analysis 74:273– 283.
Orlandini, S., Pasquini, B., Stocchero, M., Pinzauti, S. and Furlanetto, S. 2014. “An integrated quality by design and mixture-process variable approach in the development of a capillary electrophoresis method for the analysis of almotriptan and its impurities.” Journal of Chromatography A
1339: 200–209.
Otoo David Awotwe-, Agarabia, Cyrus Patrick J. Faustino, Muhammad J. Habib, Sau Leec, Mansoor A. Khana and Rakhi B. Shaha, 2012. “Application of quality by design elements for the development and optimization of an analytical method for protamine sulfate.” Journal of Pharmaceutical and
Biomedical Analysis 62: 61– 67.
Piepel, G., Pasquini, B., Cooley, S., Heredia-Langner, A., Orlandini, S. and Furlanetto, S. 2012. “Mixture-process variable approach to optimize a microemulsion electrokinetic chromatography method for the quality control of a nutraceutical based on coenzyme Q10.” Talanta 97: 73–82.
Rafamantanana, Mamy, H., Debrus Benjamin, Raoelison Guy, E., Eric Rozet, Pierre Lebrun, Suzanne Uverg-Ratsimamanga, Philippe Hubert and Joëlle Quetin-Leclercq, 2012. “Application of design of experiments and design space methodology for the HPLC-UV separation optimization of aporphine alkaloids from leaves of Spirospermum
penduliflorum Thouars.” Journal of Pharmaceutical and
Biomedical Analysis 62: 23– 32.
Sandford, Lori and Shelver and Graham, ?. ”Fusion AE Method Development Application Using a Design of Experiments Approach to Develop Fast LC Methods for Automated Scale-up to Preparative Chromatography of Sulfa Drugs.” Application notes, Varian Inc. Walnut Creek, CA, 94598, 2S-Matrix Corp. Eureka, CA 95501, Page No.- 1-8.
Sangshetti Jaiprakash, N., Deshpande Mrinmayee, Arote Rohidas, Zaheer Zahid and Shinde Devanand, B. 2014. “Quality by design approach: Regulatory need.” http://dx.doi.org/10.1016/j.talanta.2014.01.034.
Schmidt, Alexander, H., Molnár and Imre 2013. “Using an innovative Quality-by-Design approach for development of a stability indicating UHPLC method for ebastine in the API and pharmaceutical formulations.” Journal of Pharmaceutical
and Biomedical Analysis 78– 79: 65– 74.
Schmidt, Alexander, H., Stani, Mijo, Molnár and Imre, 2014. “In silico robustness testing of a compendial HPLC purity method by using of a multidimensional design space build by chromatography modeling—Case study pramipexole.”
Journal of Pharmaceutical and Biomedical Analysis 91: 97–
107.
Sonawane, Sandeep, Gide and Paraag, 2012. “Application of experimental design for the optimization of forced degradation and development of a validated stability-indicating LC method for luliconazole in bulk and cream formulation.” Arabian Journal of Chemistry: http://dx.doi.org/10.1016/j.arabjc.2012.03.019.
Szekelya, Gy., Henriques, B., Gil, M., Ramos, A. and Alvarez, C., 2012. “Design of experiments as a tool for LC–MS/MS method development for the trace analysis of the potentially genotoxic 4-dimethylaminopyridine impurity in glucocorticoids.” Journal of Pharmaceutical and Biomedical
Analysis 70: 251– 258.
Taevernier, Lien, Wynendaele, Evelien, D’Hondt, Matthias, Spiegeleer and Bart De, 2014. “Analytical quality-by-design approach for sample treatment of albumin c3_ontaining solutions.” Journal of Pharmaceutical Analysis, http://dx.doi.org/10.1016/ j.jpha. 06.001.
Tang, Yubing, 2014. “Quality by design approach to analytical methods- FDA perspective.” htt://www.fda.gov/ downloads/About FDA/centers office/office of Medical Products and Tobacco/CDER/UMC30 1056.pdf accessed on 15 July.
Ye, Christine, Liu, June, Ren, Feiyan, Okafo and Ngozi, 2000. “Design of experiment and data analysis by JMP® (SAS institute) in analytical method validation.” Journal of
aceutical and Biomedical Analysis 23: 581–589.